Abstract
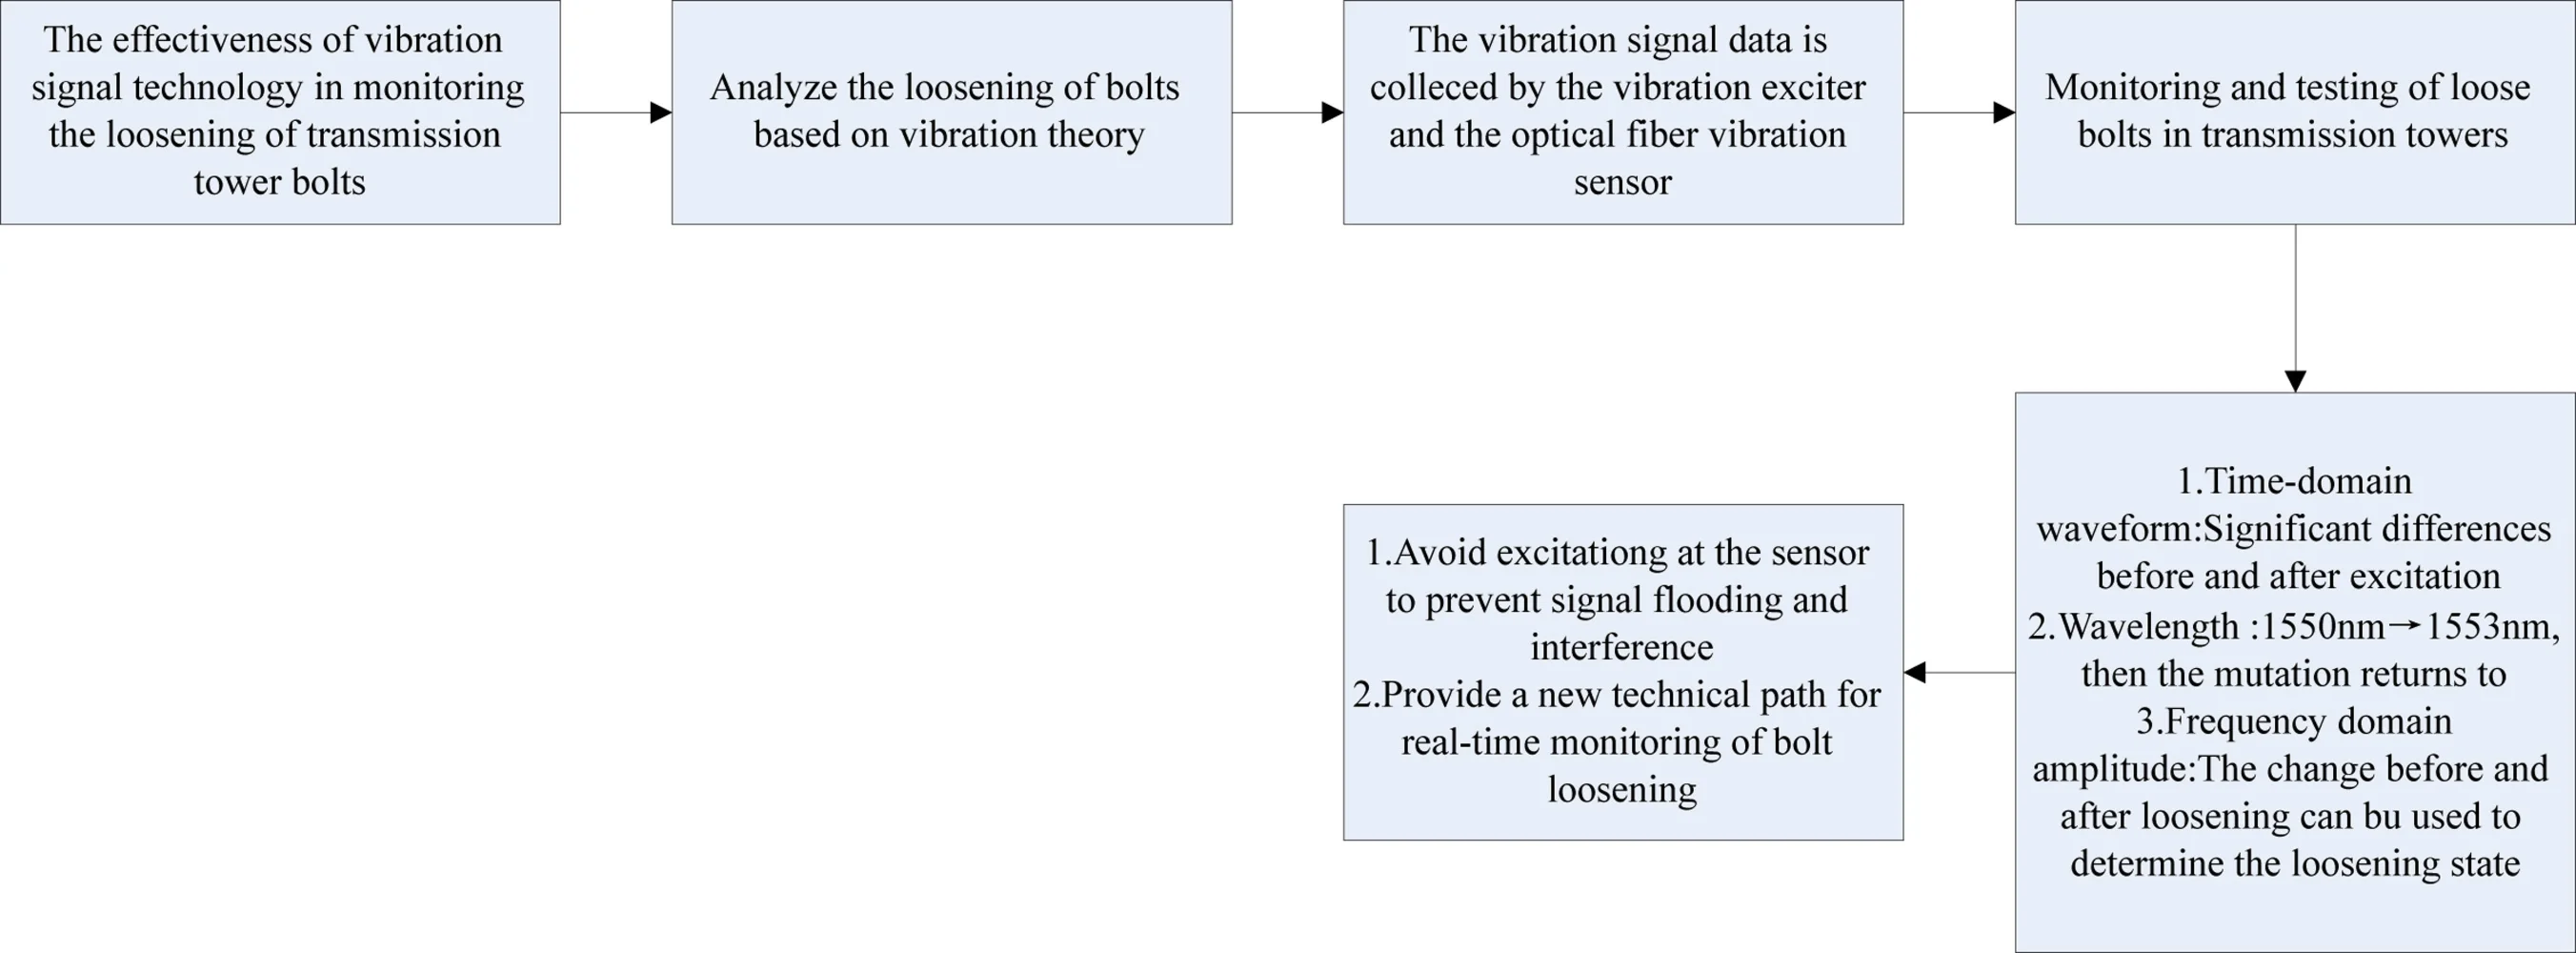
The loose failure of transmission tower bolts may lead to structural instability and safety risks, so effective monitoring methods are crucial to the stable operation of transmission lines. The purpose of this study is to explore the effectiveness of vibration signal technology in monitoring the loose bolts of transmission tower. Based on vibration theory, the principle of bolt loosening of transmission tower is analyzed, vibration signal data is collected by means of vibration exciter and optical fiber vibration sensor, and then the monitoring test of transmission tower loosening fault is carried out. The obtained test results show that the time domain waveform is significantly different before and after excitation, and the wavelength after excitation has a significant mutation, increasing from 1550 nm to 1553 nm, and slowly decreasing to the original wavelength, which also means that the transmission tower bolt loosening fault monitoring system has a good monitoring ability and can be used for vibration measurement. According to these monitoring results, the conclusions can be obtained as follows: first, the frequency domain data amplitude changes before and after loosening can be used to judge whether the bolt is loose, so as to achieve the monitoring purpose; Second, the strength of the vibration signal is large, the vibration signal change caused by the loosening of the bolt is submerged, and the installation of excitation at the sensor should be avoided to ensure that the monitoring is not disturbed by external factors. The research provides a new technical way for real-time monitoring of loose bolt fault of transmission tower, which has practical value and popularization prospect.
Highlights
- It overcomes high-cost manual limits, enabling low-cost real-time bolt loosening monitoring.
- It identifies 300-400 Hz amplitude change via FFT as the accurate, core diagnostic indicator.
- It optimizes sensor placement for reliability and reduces maintenance costs, with strong practical value.
1. Introduction
Transmission tower is an important part of the power grid transmission line, and its structural integrity and tilt degree are closely related to the safe operation of the transmission line [1-3]. The transmission line is affected by wind load, especially strong wind, and ice covering all the year round, which is easy to cause the conductor to dance, thereby indirectly causing the pole and tower to vibrate through the connecting part of the conductor and the pole and tower [4-5]. At this time, the bolts at the connecting pieces of each part of the tower are also affected by the stress and gradually loosen, and the rigid strength of the tower structure also decreases, threatening the safety of the tower. If not detected in time, the tower will seriously tilt and collapse. In recent years, such accidents have also occurred frequently, causing serious economic losses to the power grid [6-9]. Therefore, in order to ensure the safety of transmission tower, it is necessary to carry out real-time monitoring and timely maintenance of bolt loosening to prevent accidents. At present, the operation and maintenance of the transmission tower is mainly through the regular inspection of the operation and maintenance personnel, climbing the pole and tightening the bolts of the connecting parts, which is the most effective method, but the workload is large, time-consuming and high cost. With the continuous construction of the transmission line, the burden of the power grid operation and maintenance personnel is becoming heavier and heavier, reducing the efficiency of the power grid operation and maintenance work. Therefore, a fast and effective detection method is urgently needed to ensure the structural strength of the tower, ensure the safety of the transmission tower, reduce the workload of operation and maintenance, and improve the efficiency of operation and maintenance. Although certain research has been conducted on the vibration characteristics of poles and towers both at home and abroad, the research on the loosening of pole and tower bolts is still relatively limited. A large number of sensors and detection devices need to be installed to carry out corresponding detection, which seriously restricts the detection of pole and tower bolt loosening [10]. Meanwhile, the construction of the simulation experiment platform is difficult to take the actual field environment into account, which has also become another influencing factor for the inspection of the loosening of tower bolts. Based on the vibration signal, this paper analyzes and compares the vibration signal characteristics of bolts under different loosening conditions, and gives the preliminary method and basis for judging bolt loosening, which provides a reference for further research on monitoring bolt loosening of poles and towers.
2. Transmission tower bolt loosening monitoring principle
2.1. Theoretical basis of vibration
2.1.1. Simple harmonic vibration
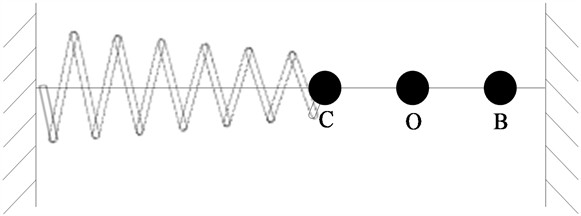
The regular reciprocating motion of an object near a certain position is called mechanical vibration. In life, the vibration of atoms and molecules in the crystal, the vibration of the pendulum and the vibration of the tower are all mechanical vibration phenomena. In mechanical vibration, when the vibrating object leaves the equilibrium point in the process of motion and is subjected to a force pointing to the equilibrium point (that is, a restoring force), the process of the object moving around a certain position is called simple harmonic vibration [10]. Simple harmonic motion can be described here by the spring vibrator motion system shown in Figure 1. The motion system holds one end of a smooth glass rod in place and inserts a ball with a smooth hole and a spring into the rod. The friction of the system is negligible. Assume that point O is the equilibrium position of the system, apply force to the ball, so that the ball slides from point O to point B. At this time, the spring is stretched, and the system generates a restoring force to the left. When the restoring force is less than the force applied to the ball, the ball returns to the equilibrium position O under the action of the restoring force, and the restoring force returns to zero. However, since the ball has kinetic energy when it returns, it will continue to slip to the left when it slides to the equilibrium position. At this time, the spring is compressed and the system generates a elasticity to the right. This restoring force makes the sliding speed of the ball gradually decrease. In this way, under the action of the spring force, the ball slides in both directions in the balance position. This is simple harmonic vibration.
Fig. 1Spring oscillator movement system
Through the force analysis of the spring oscillator movement system in Fig. 1, the motion equation of the object for simple harmonic vibration can be obtained, as shown in Eq. (1):
where is the maximum distance of the object from the equilibrium position, which is called the amplitude; represents the number of vibrations of the vibration system in 2 time, which is called the angular frequency; is called the initial phase.
2.1.2. Forced vibration and resonance
In free vibration, the external force only transmits the initial energy to the system at the very beginning, causing the system to vibrate. When periodic external forces are applied to a vibrating system, the system will continue to vibrate, and such vibration is called forced vibration [11]. In a forced vibration system, assume that the periodic external force applied is:
Based on Newton’s second law there is:
where, is elastic force; is the medium resistance; If 1, , , then Eq. (3) can be changed to:
The forced vibration system moves according to the sinusoidal law, and the period of the vibration after the system is stabilized is the same as that of the exciting force. Then the solution of Eq. (4) is:
The above equation is the motion equation of simple harmonic vibration, and the Eq. (5) is substituted into the Eq. (4). If the Eq. (4) can be established, the following conditions must be met:
In summary, it can be concluded that in a vibration system, when the system generates forced vibration, when the angular frequency of the exciting force is constant, the relationship between the position and time of the vibration system conforms to the simple harmonic vibration law, and the period of the system is consistent with that of the exciting force. According to Eq. (6), when the frequency of the exciting force meets Eq. (8) below, the amplitude of the vibration system will reach the limit value:
This phenomenon in which the amplitude reaches a maximum value under the action of periodic external forces is called resonance. The resonance angular frequency is:
When the frequency of the exciting force is close to a certain natural frequency of the vibration system, the system resonates and the amplitude reaches the maximum value. When the frequency of the exciting force gradually moves away from the natural frequency, the amplitude of the vibration system gradually decreases. For the tower, when the bolt of the tower is loosened, the natural frequency will change. Therefore, using the natural frequency of the tower to stimulate the tower, the loosening of the bolt can be monitored.
2.1.3. Mechanical wave
A wave is a signal that travels at a certain speed from one end of an object to the other. The signal is easily identifiable, its location can be found and determined at any time, and its speed and shape can be changed during propagation. Particles in the elastic medium vibrate under the action of external forces, and due to the interaction between particles, the surrounding particles also vibrate, and the vibration gradually spreads outward from the vibration source, such a phenomenon is called wave. Waves can be divided into mechanical waves and electromagnetic waves [12-13]. Among them, the propagation process of mechanical vibration in elastic medium is called mechanical wave. To generate mechanical waves, two conditions must be met: first, there must be an exciting source to make the system vibrate; Second, there must be a carrier that can propagate the vibration. Mechanical wave can be divided into shear wave and longitudinal wave, the particle vibration direction and wave propagation direction perpendicular to each other called shear wave; A wave whose particle's vibration direction is the same as the wave's propagation direction is called a P-wave. Among them, the velocity of the longitudinal wave is much greater than that of the shear wave. In elasticity, the dynamic effect of elastic waves on the propagating medium can be expressed by the Lamay equation:
where, and are Lamay constants; is a Hamilton operator; is the triple Villapras operator; is the material density; is the displacement field vector; is for physical strength. In the Cartesian coordinate system, if a plane is perpendicular to the axis, then the plane only has displacement in the direction, and no displacement in the and directions, and the points on the plane always remain on the plane during motion, such a displacement propagation mode is plane wave propagation. The mathematical abstraction of wave process, namely plane wave, is widely used in the theory of elastic wave propagation. For a plane wave, if the -axis coincides with the wave propagation direction, then the displacement vector:
The components , , and are related only to the coordinate, not to and . For the plane -wave, that is, , , the displacement component is taken as the disturbance function, the influence of physical force is ignored, and these parameters are put into Eq. (10) to obtain:
where is the propagation speed of the P-wave. The general solution of Eq. (12) is shown in Eq. (13):
where and are arbitrary wave functions. For P-wave, regardless of wavelength size, it propagates forward and back in elastic medium in the form of dense wave, and its wave speed is only related to , , and . For the plane shear wave, when , , the displacement component is also used as the disturbance function, ignoring the influence of physical force, and these parameters are brought into Eq. (10) to obtain:
where is the propagation speed of the shear wave. The general solution of Eq. (14) is:
where and are arbitrary wave functions. For plane shear wave, regardless of its wavelength and waveform, it propagates forward and back in elastic medium in the form of shear strain and transverse displacement, and its wave speed is only related to and . To learn more about P-wave and S-wave, the P-wave velocity ratio can be calculated, as shown in Eq. (16):
where, is the Poisson ratio of the material, and its value ranges from 1/4 to 1/3. Eq. (16) shows that the velocity of P-wave is about 1.73 times that of S-wave. Therefore, longitudinal wave is currently used for seismic detection, and the research materials on longitudinal wave are relatively rich. However, due to the high resolution of transverse waves, they can precisely locate small faults, sharp failures, reef bodies, and small fractures, and this feature has gradually become well-known.
2.2. Transmission tower model parameter setting
Solid45unit has expansion, creep, plasticity, large strain and large deformation capacity, which can meet the needs of tower simulation, so the transmission tower unit type is set to Solid45. After selecting the unit type, the material properties of the tower Angle can be set. Among them, density 7850 kg/m3, spring modulus 200 GPa, Poisson ratio 0.3. One point to note is that when setting material properties, care should be taken to maintain unit consistency. The default unit in ANSYS is m-kg-S, while solidedge designs the transmission tower model in mm, so units need to be converted during parameter setting. In order to ensure the accuracy of ANSYS simulation results, the size of the meshing element and the time step of the finite element transient analysis should not be too large, but if the two are too small, the simulation time will be increased and the simulation efficiency will be reduced. Therefore, it is very important to select the appropriate mesh size and simulation time step. In this paper, combined with the structural characteristics of the tower angle steel itself, the mesh size is set to 3mm, and the time step of ANSYS transient dynamic analysis is 2×10⁻⁴[14].
3. Experimental analysis
3.1. Experimental platform selection and preparation
Based on the above theoretical analysis and model parameter setting, an experimental platform can be built for experiments. The experimental platform of transmission tower monitoring is mainly composed of vibration exciter (rebound meter), fiber optic vibration sensor, fiber optic signal analysis host, display and power supply. In order to generate a vibration source with a certain intensity, the resilient instrument is used as the exciter in this paper, which has the characteristics of convenient carrying and simple operation, and is convenient for field testing. The spring stiffness of the rebound instrument is (785±30) N/m, and the stroke of the rebound hammer is (75.0±0.3) mm, which can meet the excitation of the local region of the transmission tower. The vibration sensor used for experimental acquisition is a fiber grating vibration sensor. Its working principle is that one end of the mechanical cantilever beam is fixed on the package shell and connected with the object to be measured. When the vibration is measured, the vibration source and the platform vibrate at the same time, which causes the vibration of the cantilever beam. Under the action of vibration inertia force, the cantilever beam vibrates mechanically, driving the two gratings to produce periodic strain stretching or contraction, thus causing the Bragg wavelength of FBG to change. Vibration measurement can be realized by detecting whether the wavelength information is consistent [15]. The vibration is measured by the change of wavelength of the light transmitted in the optical fiber. Because the vibration signal generated by the exciter propagates at high speed in the transmission tower, in order to ensure the accuracy of the collected vibration signal, high requirements are put forward for the data acquisition system, which must have a fast enough acquisition and processing speed to keep up with the changeable signal. The test site is the QZ power tower training experimental base of Shanghai Electric Power Company. There are 3 transmission towers on the site, and all the accessories and structures on the transmission tower are the same as the actual transmission tower, which has very good experimental test conditions. The vibration sensor is fixed on the No. 1 base, 94 cm away from the base. The sensor is connected to the analysis host, connected to the power supply, and the signal acquisition is controlled by PC software. Finally, the elastic meter is used to stimulate the bolt at 1 meter away from the base, and the vibration signal is measured respectively at different positions after the bolt is not loosened, so as to achieve the purpose of monitoring. The relevant monitoring situation is shown in Table 1.
Table 1Experimental monitoring content
ID | Bolt condition | Exciting position | Position/number of loose bolts |
A | Become loose | 1# base | |
B | 2# base | ||
C | 3# base | 2# pedestal /2 | |
D | 4# base | ||
E | 1# base | 1# Base column diagonal brace /1 | |
F | 1# base | 1# Base column diagonal brace /2 | |
G | unexcited | – | |
H | Not loose | 1# base | |
I | 2# base | ||
J | 3# base |
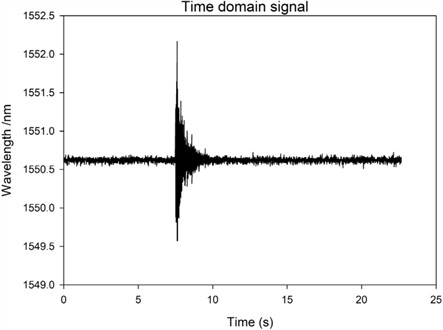
By using the analysis software, the vibration data collected by the experiment is analyzed by fast Fourier transform (FFT), and the frequency data before and after the bolt loosening is compared to find the basis for judging the bolt loosening. First of all, the original data collection is carried out to obtain the time-domain waveform of the transmission tower bolts under different states, such as the time-domain waveform when the bolts are not loosened and excited, the time-domain waveform when the bolts are not loosened and the time-domain waveform after the bolts are loosened and excited. The data collection is carried out with the QZ power tower of Shanghai Electric Power Company as the research object. The obtained time domain signals are shown in Figs. 2-4 respectively.
By comparing Figs. 2-3, it is not difficult to find that before and after excitation, the time-domain waveform has a relatively obvious difference, and the wavelength after excitation has a relatively obvious mutation, increasing from 1550 nm to 1553 nm, and slowly decreasing to the original wavelength, which also means that the transmission tower bolt loosening fault monitoring system has a good monitoring ability and can be used for vibration measurement.
Fig. 2Time domain of vibration excitation under the premise that the bolt is not loose
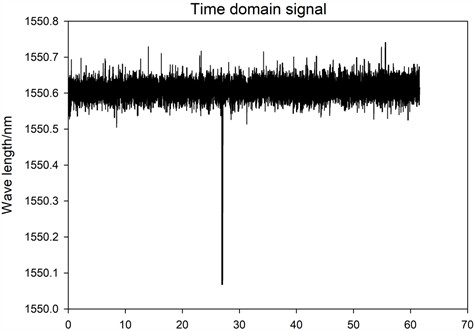
Fig. 3Time domain of vibration excitation at the 2# base without loosening of bolts
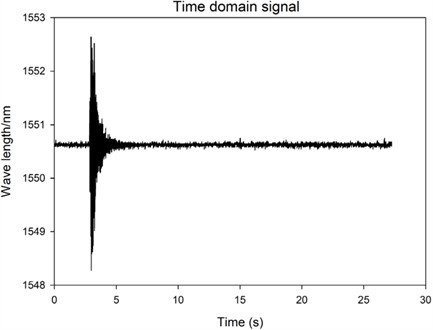
Fig. 4Time domain situation of excitation of 2# base when the bolt of 2# base is loose
When the excitation point is not changed, the data before and after loosening are found to have abrupt changes in the two time-domain waveforms. However, due to the on-site measurement cannot be carried out at the same time, the time of the two sets of data cannot correspond, and it is difficult to distinguish the change characteristics before and after loosening through the time-domain signal. Therefore, it is necessary to transform the original time domain data into frequency domain data for comparative analysis. That is, FFT transformation is carried out to obtain frequency domain data, and then comparison is made. If the time-frequency data collected by the bolts of the transmission tower without loosening or excitation is transformed by FFT, the corresponding spectrum can be obtained, as shown in Fig. 5. Time-frequency data under other conditions are also transformed through FFT.
Fig. 5Spectrum of bolts without vibration under the premise that they are not loose
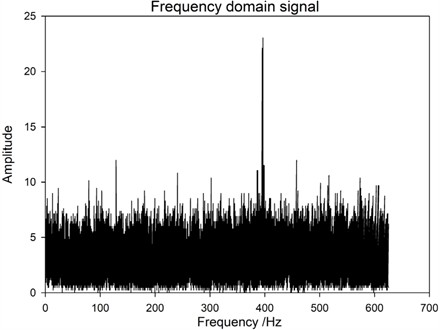
Fig. 6Spectrum of excitation at the 1# base without loosening of bolts
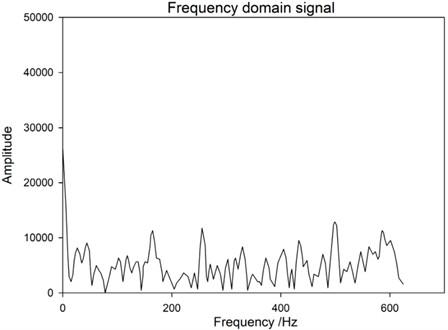
Fig. 7Spectrum of excitation at base 2# under the premise that the bolt is not loosened
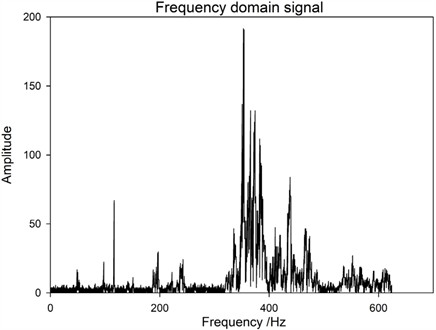
The excitation spectra at Base 1 without loose bolts were obtained in sequence (Fig. 6), at Base 2 without loose bolts (Fig. 7), at Base 3 without loose bolts (Fig. 8), at Base 1 without loose bolts after the bolts at Base 2 were loosened (Fig. 9), at Base 2 without loose bolts (Fig. 10), and the diagonal brace of base 1 The frequency spectrum of the No. 1 base when one bolt is loose at the position (Fig. 11) and the frequency spectrum of the No. 1 base when two bolts are loose at the No. 1 base column diagonal brace position (Fig. 12).
Fig. 8Spectrum of excitation at the 3# base under the premise that the bolt is not loosened
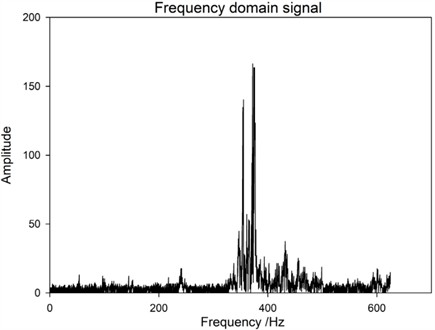
Fig. 9Spectrum of the excited 1# base under the premise of loosening of 2# pillar bolts
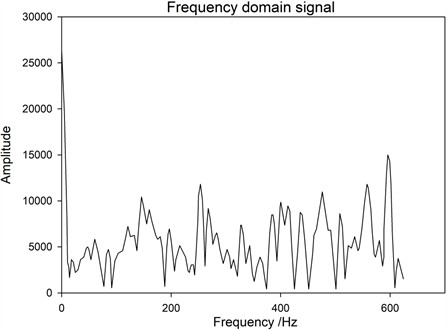
Fig. 10Spectrum of excited 2# base under the premise of loosening of 2# pillar bolts
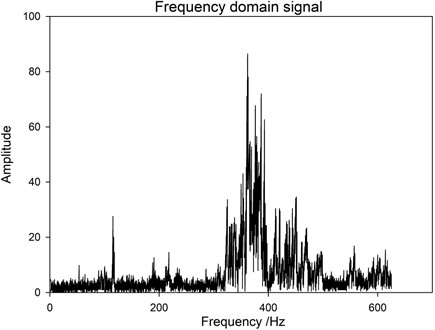
Fig. 11Frequency spectrum of excited 1# base with one bolt loose at the position of 1# base column skew
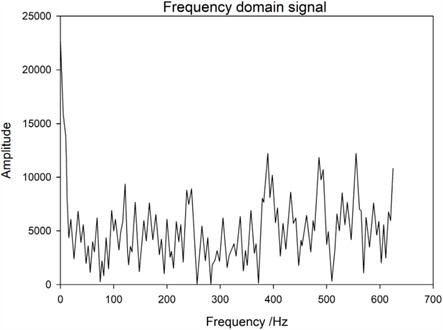
Fig. 12Spectrum of excited 1# base with two loose bolts at the 1# base column diagonal brace position
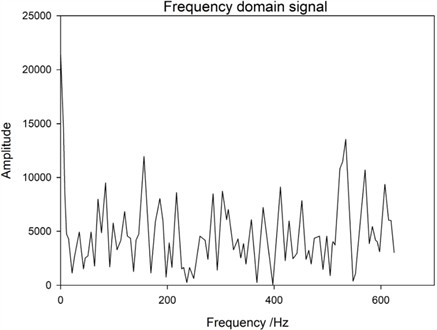
Based on the above frequency spectrum, the following inspection results can be obtained: First, under the same excitation position, that is, under the condition of sensor monitoring point 1# base, the frequency domain data of three cases, namely, the bolt is not loose, 1 bolt is loose at 1 # base slant support, and 2 bolts are loose at 1# base slant support. From Fig. 6 and Figs. 11-12, it can be seen that the amplitude change of the transmission tower bolts before and after loosening is not significant, all below 1.5×10⁴. Therefore, it is difficult to determine the loosening of the bolts and the number of looseness at this point. Secondly, when the adjacent bases of the monitoring points are excited, the excitation points are all on the 2# base (the sensor monitoring point is on the 1# base). Comparing the frequency domain data of two bolts that are not loosened and two bolts that are loosened on the 2# base, as shown in Fig. 7 and Fig. 10, it can be found that the frequency of the array changes at 300-400 Hz after the bolts are loosened, and the amplitude measured decreases after loosening the two bolts. So, the amplitude change of frequency domain data before and after loosening can be used to determine whether the bolt is loose. This result is different from the previous results, as the positions of surface excitation points and monitoring points will have an impact on vibration information. In response to this conclusion, a more in-depth research analysis was conducted, comparing the frequency domain data of the 1# base excitation, 2# base excitation, and 3# base excitation when the bolt is loose, as shown in Figs. 6-8. It can be found that with different excitation points, the amplitude of the 300 Hz-400 Hz frequency signal decreases as the distance between the excitation position and the sensor monitoring point increases. This is because the shockwave decreases as the distance increases during propagation. Thirdly, by comparing and analyzing the frequency domain data of bolt loosening at different positions, a study on bolt loosening location localization is conducted. From the comparison of Fig. 6, Fig. 9, and Fig. 11, it can be seen that the frequency domain data of the vibration signal does not change significantly. Based on Result 1, it can be concluded that their commonality is that the excitation position is on the same base column as the sensor monitoring point, and the distance is relatively close. So, the vibration signal strength is relatively high, and the vibration signal changes caused by bolt loosening are submerged and difficult to distinguish. Therefore, in subsequent experiments, it should be avoided to install excitation at the sensor location. By comparing and analyzing this data, it is possible to effectively monitor the loosening of bolts in transmission towers and determine whether there is a loosening problem with the bolts.
4. Conclusions
This research focuses on the monitoring of bolt loosening faults in transmission towers using vibration signals. Firstly, it lays the research foundation with vibration theory as the core, deeply analyzes the characteristics of simple harmonic vibration, forced vibration and resonance, and mechanical waves, and clarifies that simple harmonic vibration follows the motion equation. These theories provide principle support for subsequent monitoring, that is, bolt loosening will change the natural frequency of the tower. This further leads to changes in the vibration signal. Meanwhile, to ensure the consistency between the experimental and actual characteristics of the transmission tower, the model parameters of the transmission tower were set. The Solid45 element with expansion, plasticity, and large deformation capabilities was selected. The density 7850 kg/m3, elastic modulus 200 GPa, and Poisson’s ratio 0.3 of the Angle steel material were clearly defined, and the grid size of 3mm and the time step for transient dynamics analysis were determined to balance the simulation accuracy and calculation cost. Based on this, an experimental platform was built at the Power Tower Training and Experiment Base of Shanghai Electric Power Company. The platform consists of an exciter, an optical fiber vibration sensor, an optical fiber signal analysis host, a display and a power supply. Three transmission towers of actual specifications were taken as the research objects, and the sensors were fixed at a distance of 94cm from the No. 1 base. Excitation is carried out at a height of 1 meter from the base, and monitoring is conducted for different bolt conditions (loose or not loose), excitation positions (1#-4# bases, not excited), loose positions and numbers (2 for 2# base, 1/2 for 1# base column diagonal braces). In the data processing, the time-domain waveforms were first collected. It was found that there was a significant difference in the time-domain waveforms before and after excitation. After excitation, the wavelength suddenly changed from 1550 nm to 1553 nm and then slowly dropped back to the original value, proving that the monitoring system has the ability to measure vibration. However, since the time-domain data cannot correspond to the time before and after loosening simultaneously, the time-domain data is converted into frequency-domain data through FFT transformation. It is analyzed that the positional relationship between the excitation point and the monitoring point is the key to judging the loosening of the bolt: At the same position (such as 1# base excitation + 1# base monitoring), whether the bolts are loose and the frequency domain amplitude corresponding to the number of loose bolts are both below 1.5×10⁴, making it difficult to distinguish. When adjacent positions (such as 2# base excitation + 1# base monitoring) occur, the amplitude in the 300-400 Hz frequency band decreases after the bolt loosens, which can be used as a basis for judgment. Moreover, when not loose, the farther the distance between the excitation point and the monitoring point, the weaker the amplitude in this frequency band (due to the energy attenuation of mechanical wave propagation). At the same time, it is necessary to avoid the overlap of the excitation point with the sensor monitoring point. Prevent strong vibration signals from drowning out the changes in loose signals. From the perspective of technical advantages, this vibration signal monitoring technology breaks through the limitations of traditional contact sensors and adopts non-contact optical fiber sensors, eliminating the need for extensive device deployment. The vibration signal is global and can capture the modal changes of bolts as a whole, making it suitable for complex tower structures. The device is portable, easy to operate, low in cost and easy to deploy. In terms of application value, it can replace traditional manual inspection (reducing workload, time consumption and cost), achieve real-time monitoring of bolt loosening, promptly identify potential hazards, prevent accidents such as tower tilting and collapse, provide a guarantee for the safe operation of the power grid, and fill the gap in existing research on the monitoring of tower bolt loosening. However, there are still certain deficiencies, such as the need to further increase the data volume. In the future, this will be taken as the research direction, and the specific situation of the monitoring system will be further verified by increasing the data volume, making due contributions and efforts to the power transmission industry.
References
-
N. A. He et al., “Research on the application of Beidou positioning technology in the operation condition monitoring of transmission tower,” (in Chinese), Hongshui River, Vol. 42, No. 3, pp. 100–103, 2023, https://doi.org/10.3969/j.issn.1001-408x.2023.03.019
-
J. C. Cai et al., “Unmanned aerial vehicles (uavs) based on transmission tower refinement checking study,” (in Chinese), Electric Technology, No. 7, pp. 104–106, 2023, https://doi.org/10.19768/j.cnki.dgjs.2023.07.027
-
Y. Wang et al., “Inner Mongolia power grid transmission tower tilted platform development and application of monitoring and early warning analysis,” (in Chinese), Journal of Inner Mongolia Electric Power Technology, Vol. 41, No. 1, pp. 40–44, 2023, https://doi.org/10.19929/j.cnki.nmgdljs.2023.0007
-
N. Qu and H. Zhang, “Research on operation condition monitoring of transmission tower and its LSD Algorithm Based on anti-ice flashover,” (in Chinese), Modern Industrial Economy and Informatization, Vol. 12, No. 1, pp. 240–242, 2022, https://doi.org/10.16525/j.cnki.14-1362/n.2022.01.085
-
W. B. Li, J. P. Chen, and F. Zhou, “Research on damage characteristics of transmission tower under strong wind,” (in Chinese), Journal of Wuhan University of Technology, Vol. 41, No. 12, pp. 81–88, 2019.
-
S. Chen and Y. X. Lv, “Design and implementation of an overall tilt angle detection device for Transmission tower,” (in Chinese), Chinese Journal of Sensing Technology, Vol. 34, No. 10, pp. 1279–1284, 2021, https://doi.org/10.3969/j.issn.1004-1699.2021.10.001
-
H. B. Zai et al., “Warning method of transmission tower tilt in goaf based on magnetic field sensing and Beidou positioning,” (in Chinese), ournal of Electrical Engineering, Vol. 15, No. 3, pp. 44–49, 2020, https://doi.org/10.11985/2020.03.006
-
P. Ling and W. Q. Xi, “High precision monitoring and early warning system of transmission tower tilt based on ZigBee technology,” (in Chinese), Electronic Testing, No. 9, pp. 16–18, 2020, https://doi.org/10.16520/j.cnki.1000-8519.2020.09.004
-
T. L. Wang et al., “Deformation of transmission tower and the research state of skew detection,” (in Chinese), Journal of Communication Power Supply Technology, Vol. 35, No. 11, pp. 91–92, 2018, https://doi.org/10.19399/j.cnki.tpt.2018.11.030
-
H. Yang, X. Zhou, and B. Gao, “Non-contact perception method for loosening defects of transmission tower bolts,” (in Chinese), Yunnan Electric Power Industry, No. 1, pp. 20–25, 2025.
-
H. J. Yu, “Derivation and application of motion equation of simple harmonic vibration,” (in Chinese), Journal of Jiamusi University (Natural Science Edition), Vol. 40, No. 3, pp. 168–170, 2022, https://doi.org/10.3969/j.issn.1008-1402.2022.03.043
-
X. M. Zhou and Z. J. Yuan, “Innovation and practice of forced vibration and resonance demonstration experiments,” (in Chinese), Physics Teaching, Vol. 46, No. 1, pp. 23–25, Jan. 2024.
-
S. W. Yu and X. K. Luo, “Multifunctional demonstration device of mechanical vibration and mechanical wave,” (in Chinese), Experimental Physics, Vol. 42, No. 8, pp. 54–58, 2022, https://doi.org/10.19655/j.cnki.1005-4642.2022.08.009
-
M. Li et al., “Research on electromagnetic wave interference source location method based on Circle Theorem,” (in Chinese), Journal of Civil Aviation, Vol. 8, No. 3, pp. 135–138, 2024, https://doi.org/10.3969/j.issn.2096-4994.2024.03.025
-
S. F. Wang, “Choose the gangue manipulator based on ANSYS transient dynamics analysis,” (in Chinese), Journal of Coal Technology, Vol. 40, No. 11, pp. 199–201, 2021, https://doi.org/10.13301/j.cnki.ct.2021.11.047
-
Z. Y. Wang et al., “Wavelength measurement system based on acousto-optic Bragg diffraction,” (in Chinese), University Physics, Vol. 38, No. 5, pp. 53–56, 2019, https://doi.org/10.16854/j.cnki.1000-0712.180472
About this article

This study was supported by State Grid Shanxi Electric Power Company Technology Project: Research and Application of an Online Monitoring System for Bolt Looseness in Transmission Towers Based on DSP Voiceprint Information 52051K240001.
The datasets generated during and/or analyzed during the current study are available from the corresponding author on reasonable request.
Huiwei Liu was responsible for the systematic collection, organization and screening of research materials, built the core literature database and data foundation for the article, and participated in the construction of the first draft framework. Pengjie He led the market research work, including designing the research plan, conducting data collection (such as questionnaires and interviews) and statistical analysis of results to provide empirical support for the article. Ziqiang Lu undertook the writing of the main content of the article, integrated materials and research data to form a complete discussion, optimized the logical structure and completed the revision of the final draft. Jie Li was in charge of the proofreading of professional terms in the article and the polishing of language expression to ensure the accuracy and fluency of the content, and assisted in standardizing the format of literature citations. Ziying Lu mainly undertook the bilingual translation work of the article (such as Chinese-English version conversion), and verified the accuracy of the translated content to ensure the professionalism of cross-language communication.
The authors declare that they have no conflict of interest.
