Abstract
To enhance the rationality of the anchor winch drum structure design and reduce costs and energy consumption, a lightweight design scheme was put forward based on multi-objective optimization technology. According to the working principle, load characteristics, and composition of the anchor winch, a parameterized coupled model of modal and strength was established using the finite element method, from which the stress, deformation, natural frequency, and mode shapes characteristics of the drum part were obtained. Under the premise of not changing the assembly dimensions and not causing structural interference, the dimensions of the cylinder, side panels, and ribs were determined as design variables, and corresponding sensitivity analysis was derived. The maximum stress, first-order equivalent stiffness, and mass were set as the optimization targets, and the Kriging model was used as an approximating function in the construction of mathematical model. The standard criteria for evaluating the precision of the response surface model were chosen as the coefficient of determination, adjusted coefficient of determination, and root mean square error. Under the condition of maintaining equivalent stiffness without degradation, two lightweight design schemes were obtained under the conditions of no less than the initial stress peak value and 1.5 times the stress peak value. The results show that it is possible to achieve a weight reduction rate of 14.1 % without increasing the stress peak value and without reducing the equivalent stiffness, effectively achieving the design goal of energy saving and cost reduction.
Highlights
- A parameterized coupled model of modal and strength was established using the finite element method, from which the stress, deformation, natural frequency, and mode shapes characteristics of the drum part were obtained.
- Under the premise of not changing the assembly dimensions and not causing structural interference, the dimensions of the cylinder, side panels, and ribs were determined as design variables, and corresponding sensitivity analysis was derived.
- The maximum stress, first-order equivalent stiffness, and mass were set as the optimization targets, and the Kriging model was used as an approximating function in the construction of mathematical model.
1. Introduction
Anchor winch is a crucial ship equipment utilized for securely anchoring anchor chains or steel wire ropes on the seabed, thereby enabling the ship to be steadfastly positioned [1]. As a vital load-bearing component of the anchor winch, the winding drum can be employed to tow large vessels such as cargo ships, oil tankers, and barges, facilitating their maneuvering and movement in ports or at sea to satisfy various transportation requirements. Therefore, the winding drum is frequently designed to possess a relatively large mass and a high safety factor, thereby leading to excessive redundancy in local structures, which is detrimental to energy conservation and cost reduction [2, 3]. A poor structural design not only wastes equipment costs, but also increases the fuel consumption of the vessel. Regarding the anchor winch, it undergoes intense dynamic loading and excitation vibrations during its operation. Hence, the strength and modal characteristics of the winding drum constitute critical factors for ensuring performance. According to the performance requirements, the optimal improvement plan is to reduce stress peaks and enhance natural frequencies while minimizing mass to the greatest extent possible, which requires a multi-objective optimization method. Currently, research on similar parts of winding drum mainly focuses on mechanical strength analysis and optimization of single performance. Representative studies include: Mihai [4] used SolidWorks to create the geometric model of the drum and imported it into COMSOL Multiphysics for thermal-mechanical simulation. Based on the deformation and von Mises stress determined by the thermal-mechanical simulation, the durability limit of the material was validated. Pi [5] established a dynamic model with dual drums, discretized and solved the model using the Galerkin method and Runge-Kutta method, which can handle three-dimensional displacement excitation and three-dimensional eccentricity. The proposed three-dimensional dynamic model has higher accuracy in some actual situations, such as external excitation or maintaining eccentricity. Jassinbekov [6] conducted a strength analysis of the spool parts under limit load conditions, combined the analysis results, proposed a directional optimization scheme and validated it to eliminate stress concentration problems. Celik [7] conducted a strength analysis of the spool parts using experimental strain gauge-based stress analysis and advanced computer-aided engineering simulation methods. The study successfully conducted experimental stress analysis, 3D solid modeling, and validated finite element analysis. Quynh [8] proposed an optimization scheme based on modal testing technology, which could significantly improve the first-order natural frequency and thus reduce the probability of resonance. Wang [9] conducted finite element modal analysis and multi-point input-multi-point output modal tests to determine its inherent vibration characteristics. A method combining size optimization and topology optimization was proposed through the analysis of excitation frequencies. Perfetto [10] adopted the finite element numerical method to study the influence of variable thickness on the propagation of guided waves, which can efficiently reproduce geometric discontinuities.
According to the operating conditions of the anchor winch, it can be known that in the optimization design of the drum structure, the criteria of strength and stiffness are indispensable, otherwise, the conventional single-objective optimization scheme cannot fully meet the reliability requirements [11]. Therefore, a lightweight method based on multi-objective optimization was proposed, which could obtain a better structure under the condition that the performance is not reduced or further improved. The innovations of this paper include the following two aspects: (1) A coupling analysis model of modal and strength is proposed, which can parameterize the design variables and obtain the peak stress values and natural frequencies of the model simultaneously. (2) The response surface model of mass, peak stress, and equivalent stiffness were constructed and error-checked, respectively, to solve the design variables under different constraint conditions, effectively improving the optimization effect, and reducing the R&D and application costs.
2. Working mechanism and load characteristics of winding drum
2.1. The composition and working principle
The principal components of the anchor drum encompass the side plates and the cylindrical body, as shown in Fig. 1. In mooring operations, it operates by means of having ropes wound around it. When a vessel berths, it is moored through shore-based mooring piles and anchor winch drums with ropes wound thereon. When the vessel departs from the dock, the ropes are wound around the anchor drum and stored thereon. The ropes wound around the anchor drum ought to be capable of being released promptly. During the vessel’s voyage, the ropes wound around the anchor drum should be safeguarded to avert rope breakage.
In overload operations, the anchor winch drum must not exceed its maximum load for longer than two minutes during operation. The hydraulic motor conveys its power to the drum situated on the driving shaft of the anchor winch via the power system, and the energy transferred by the power system actuates the rotation of the driving shaft. During the operation of the anchor winch, the transmission system regulates the rotational speed of the driving shaft within a certain range based on diverse working conditions. The two can operate independently by manipulating the clutch of the drum. When the drum halts, the rotation of the anchor wheel enables anchoring and mooring. When the anchor wheel stops, the rotation of the drum facilitates winching and reeling in. The braking system of the drum is capable of effectuating emergency parking operations.
Fig. 1The structure and composition of anchoring machinery
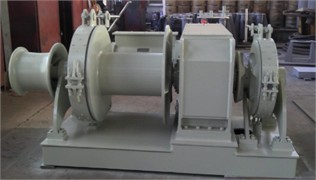
a) Overall structure of anchoring machinery
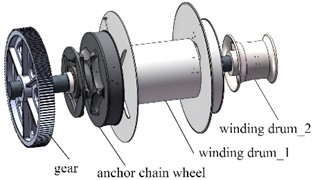
b) Internal transmission mechanism
2.2. Loads and boundary conditions
In accordance with the working principle, the external load borne by the drum primarily stems from the tension force exerted by the wire rope on the drum and the compressive force of the wound wire rope on the drum surface. The tension force induces the bending stress in the drum, and the compressive force leads to the drum being compressed and bent. To compute the stress caused by the wire rope tension on the drum wall, initially determine the radial pressure per unit area on the drum surface. A section is taken from the drum, and a ring with a diameter equivalent to that of the wire rope along the axial direction is regarded as the section. Given that both the structure and the load are symmetrical, half of it is taken along the circumferential direction as depicted in Fig. 2.
Fig. 2Model for load analysis of the drum
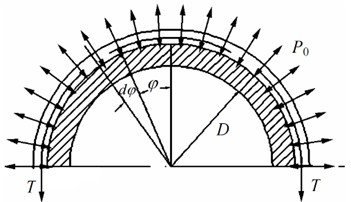
In a vertical cross-section perpendicular to the axis, take the arc length corresponding to the angle at the center, then the surface area of the separated body is:
where is the diameter of the drum, in meters, is the diameter of the rope, in meters, and is the angle between the separator and the center, in radians.
The sum of the loads carried by each separation unit along the roller surface in the vertical direction perpendicular to the axis is balanced by the tension force , i.e.:
Taking into account the frictional force between the rope and the drum, the tension on the drum wire rope satisfies the Euler formula. Since the coefficient of friction between the wire rope and the drum is 0.16, the reduction in tension on the wire rope as it wraps around the drum can be estimated at around 4 % of the tension at the outlet end. It can therefore be assumed that the radial pressure distribution of the rope acting on the outer surface of the drum follows a linear decay pattern, with the maximum pressure applied 132 mm from the diaphragm. Based on the characteristics of the anchor winch drum assembly and actual working conditions, constraints are applied to the drum sleeves on both sides along the circumferential, radial, and axial directions.
3. Analysis of modal and strength
3.1. The establishment of finite element models
Parameterized modeling refers to the process of generating controllable models or objects from defined input parameters, through logical analysis of the program. Parametric modeling requires considering the model’s malleability, so the order of modeling is very critical. Before conducting parametric modeling, it is necessary to analyze the shape of the model first. If the model cannot be decomposed into basic geometric elements or if the model is composed by Boolean operations, such a model cannot be parameterized by basic features. In Creo, a parametric model of the anchor winch drum can be created, as depicted in Fig. 3. The internal structure of the drum incorporates multiple reinforcing ribs that significantly enhance its overall stability. Even under extreme torque loading conditions, it maintains exceptional strength and stiffness characteristics. While ensuring that assembly dimensions remain unchanged, the parametric dimensions and their corresponding value ranges for the drum component are specified as shown in Table 1. Given that there is no dimensional interference, these value ranges were designed to exhibit symmetrical distribution. To guarantee that parameterized dimensions are accurately recognized by ANSYS, it is recommended to prepend the prefix “DS” to the dimension names in Creo.
Fig. 3Definition of parametric dimensions
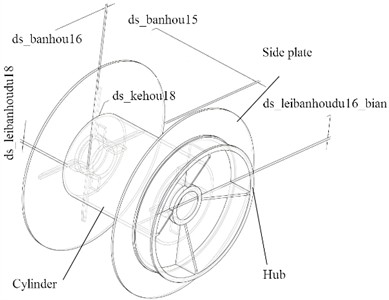
Table 1The range of values for design variables
Name of parameter | Code | Initial value / mm | Minimum value / mm | Maximum value / mm |
ds_leibanhoudu16_bian | P1 | 16 | 12 | 20 |
ds_leibanhoudu18 | P2 | 18 | 12 | 24 |
ds_leibanhoudu16 | P3 | 16 | 12 | 20 |
ds_banhou15 | P4 | 15 | 12 | 20 |
ds_kehou18 | P5 | 18 | 12 | 24 |
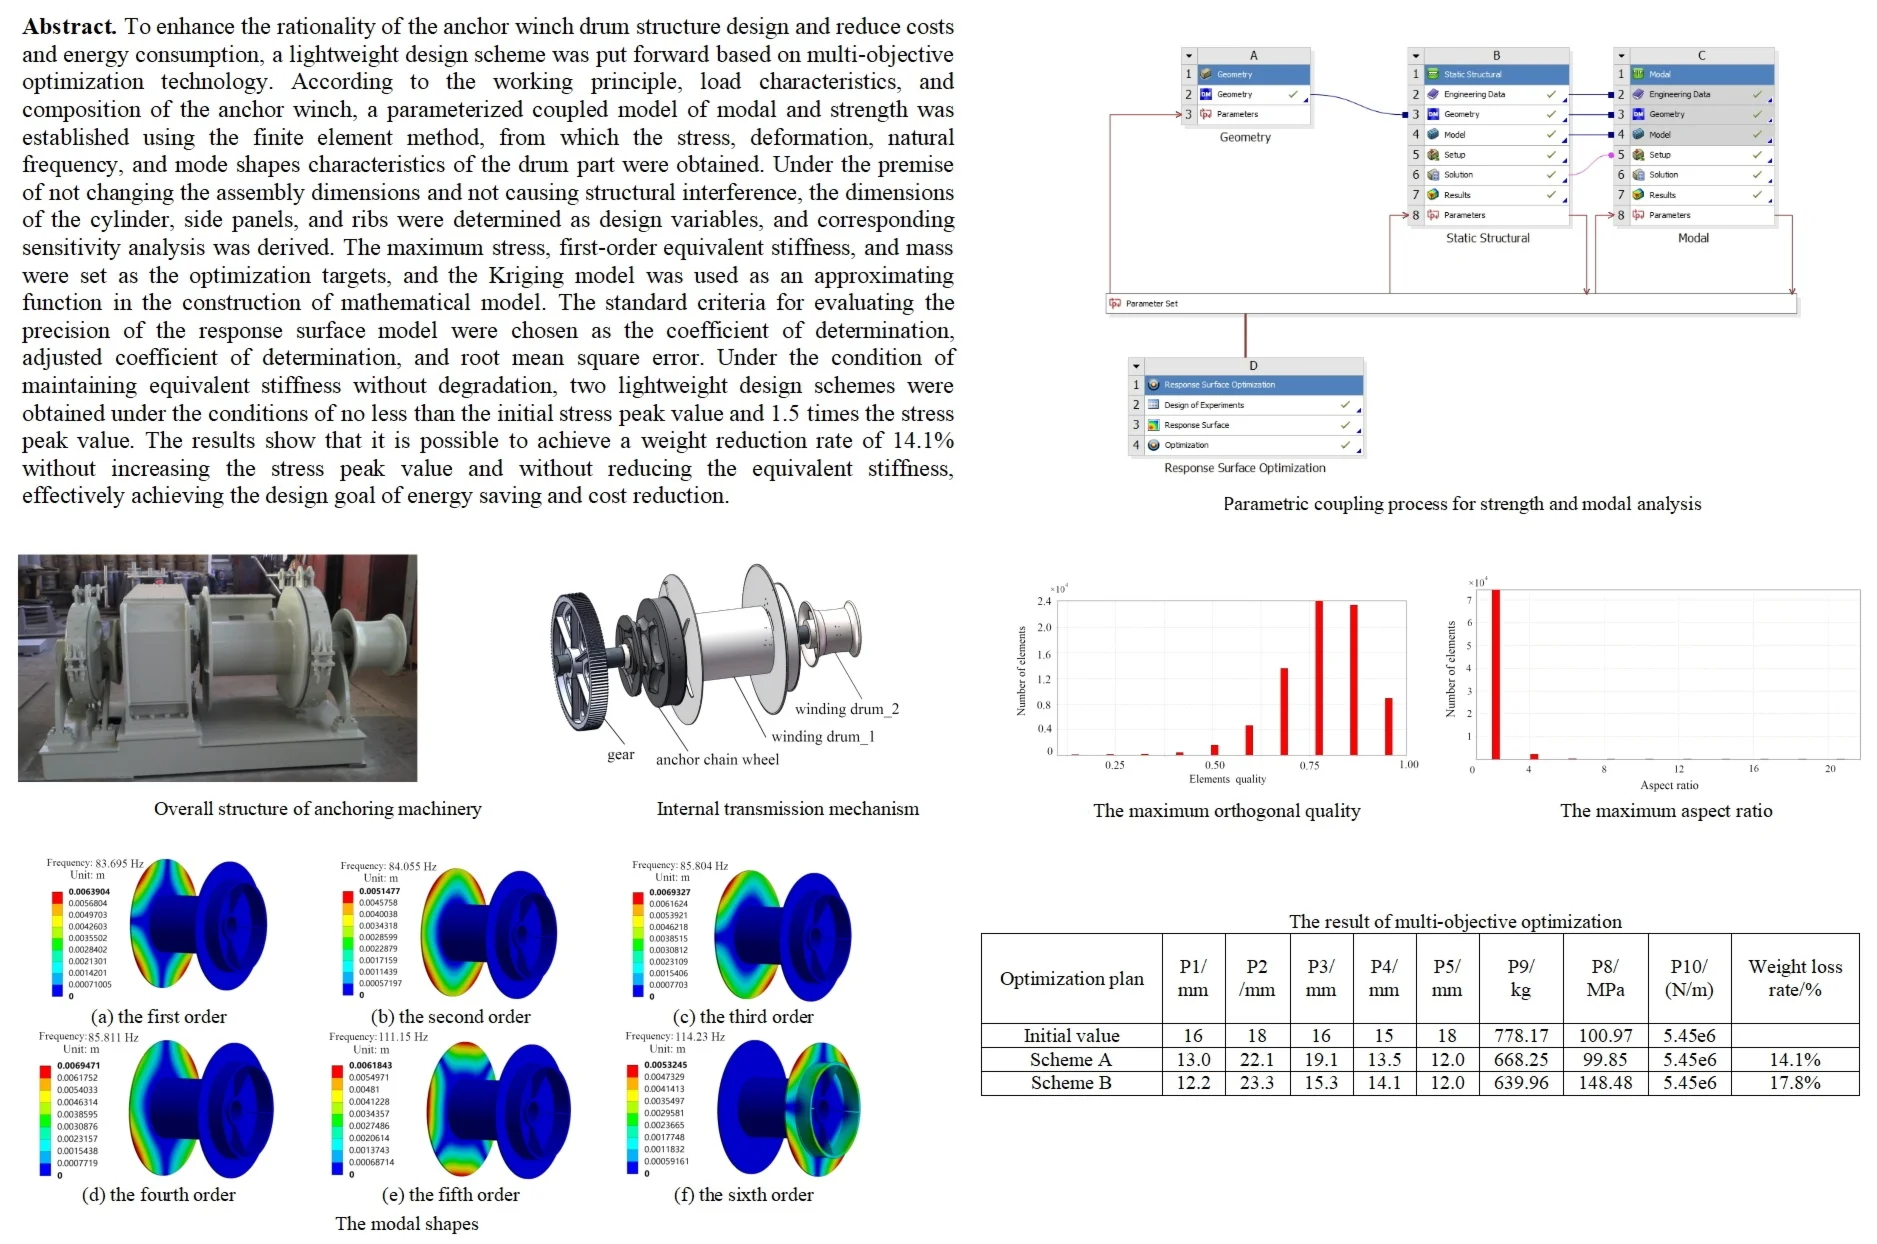
In ANSYS, the coupling analysis module is established as shown in Fig. 4, which includes strength analysis, modal analysis, and optimization analysis of response surface functions. Under coupling conditions, the update of parameterized models and the calculation of modes and stresses are synchronized, ensuring the real-time and reliability of multi-objective optimization. To ensure the consistency of the fitting data for the optimized model, the settings of the load, boundary conditions, material properties (as shown in Table 2), and grid partitioning method are kept unchanged. The data of parameterized design variables and optimization objectives can be collected in the response surface optimization module.
Fig. 4Parametric coupling process for strength and modal analysis
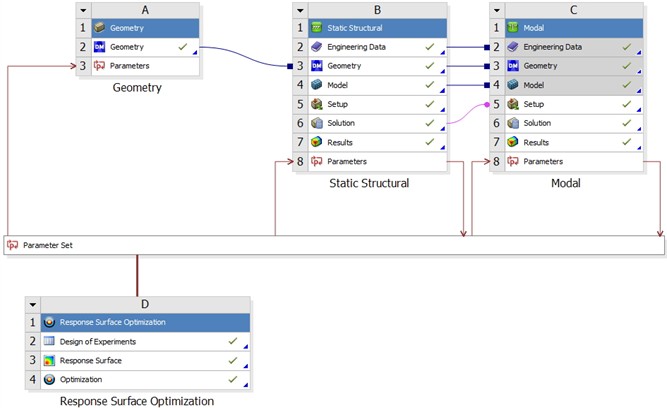
Table 2Material properties of key components
Parts | Material type | Modulus of elasticity / GPa | Poisson’s ratio | Yield strength / MPa |
Cylinder | DH36 | 210 | 0.3 | 355 |
Side plate | Q235B | 206 | 0.3 | 235 |
Hub | 45# steel | 206 | 0.25 | 260 |
3.2. Modal analysis
The number and density of grids will affect the accuracy and efficiency of finite element calculations. Generally speaking, as the number of grids increases, the calculation accuracy will improve, but at the same time, the computational workload will also increase accordingly. Especially when the grid density increases to a certain extent, the calculation error does not change significantly, but the calculation efficiency will significantly decrease, which is very unfavorable for parameterized optimization [12]. Therefore, it is necessary to adjust the density of the adaptive grid through pre analysis. The results indicate that when the resolution of the grid is set to 6, reasonable computational efficiency and accuracy can be achieved. At this point, the evaluation results of the finite element mesh are shown in Fig. 5, including the maximum orthogonal quality and maximum aspect ratio.
Fig. 5The evaluation results of the finite element mesh
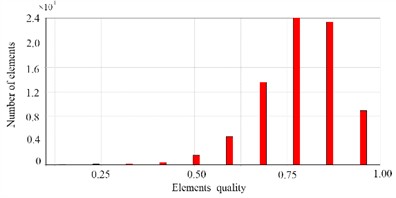
a) The maximum orthogonal quality
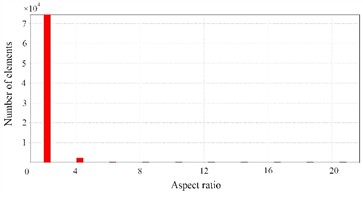
b) The maximum aspect ratio
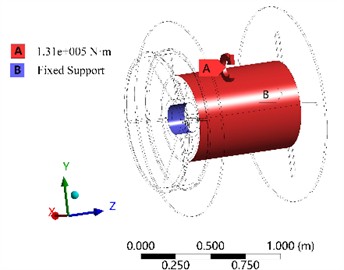
The grid partitioning results are shown in Fig. 6, where the number of elements is 144150 and the number of nodes is 227683. It is observable that the degree of distortion of the finite element mesh is extremely low, and the quality of the vast majority of the mesh is exceptionally high, which can effectively fulfill the requirements of calculation accuracy and efficiency. Based on the actual ultimate load and constraints, the boundary conditions are set as shown in Fig. 7, which can calculate the modal characteristics under constrained conditions. Considering the factor of gravity, the cylindrical surface of the bearing connection inside the drum is defined as a fixed constraint, and the torque on the outer cylindrical surface is set to 1.31e5 N·m.
The definition of load refers to industry standards GB/T 42058-2022 and ISO 4568-2021. The fluctuation range of the load is required to be controlled within ±10 % of the rated tension. This is to prevent excessive or insufficient tension from causing the anchor chain to be overly stressed or slack, thereby affecting the safety of anchoring and the service life of the anchor winch and anchor chain. For extreme conditions, according to the standard requirements, the anchor winch drum should be able to withstand no less than 80 % of the breaking tension of the anchor chain. This is to ensure that in extreme circumstances, even if the anchor chain is subjected to a force close to its breaking limit, the anchor winch drum can still provide a certain buffer and protection, avoiding serious consequences such as sudden chain breakage and loss of ship control.
Fig. 6Mesh division results
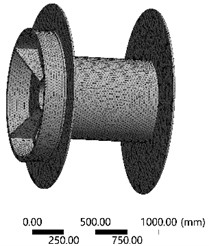
Fig. 7Setting of load and boundary conditions
To verify the convergence of the finite element calculation, the maximum residual force and the maximum DOF increment are taken as the criteria for judgment, as shown in Fig. 8 and Fig. 9. When the convergence is judged by the maximum residual force, it is to observe whether this value approaches a relatively stable state as the calculation iteration or structural adjustment continues. For example, in numerical simulation calculations, the maximum residual force at different stages is obtained through repeated iterations. If the value of the maximum residual force changes less and less as the number of iterations increases, it can be considered to show the characteristic of convergence. When conducting loading, deformation and other analyses on a structure, the numerical values at each degree of freedom (DOF) will change. The maximum DOF increment is the largest value among these changes in numerical values within a specific time period of the analysis or an iterative process. When the maximum DOF increment is less than a pre-determined threshold, it is considered that the calculation process has converged. The analysis results show that both the maximum residual force and the maximum DOF increment eventually tend to zero and remain stable, which proves that this finite element model has good convergence characteristics.
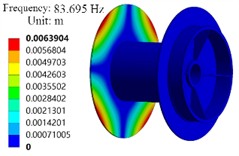
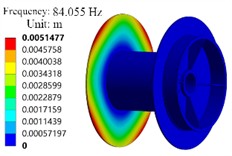
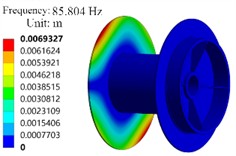
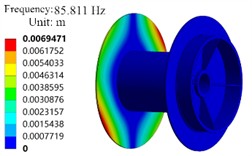
From the modal analysis results in Fig. 10, it can be seen that the maximum vibration displacement from the 1st to the 5th order is located on the left side of the plate, while the 6th order is located on the right side of the plate. When the drum rotates, it will be stimulated by other anchor winch components such as shaft rotation. If the external load frequency of other anchor winch components matches its natural frequency, it will also cause resonance between the drum and other components, making the anchor winch drum unable to work normally. When designing anchor winch components, consideration should be given to avoiding the operating frequency of other components of the anchor winch from the natural frequency of the drum. The components that can resonate with the anchor winch drum include bearings and gears. The working frequency of bevel gear meshing is 60 Hz, and that of planetary gear meshing is 27 Hz. These operating frequencies have a certain difference from the first-order frequency of 83.695 Hz of the drum, and during normal operation, these components will not resonate with the drum.
Fig. 8The change of maximum residual force
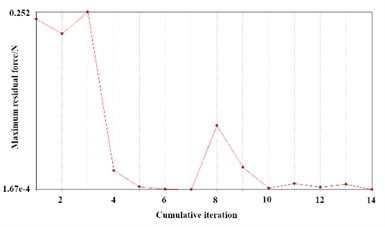
Fig. 9The change of maximum DOF increment
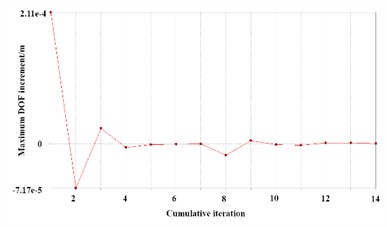
Fig. 10The modal shapes
a) The first order
b) The second order
c) The third order
d) The fourth order
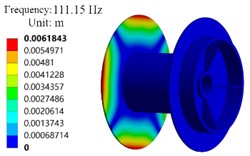
e) The fifth order
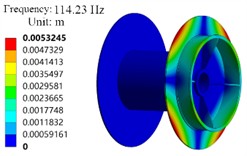
f) The sixth order
3.3. Strength analysis under limiting conditions
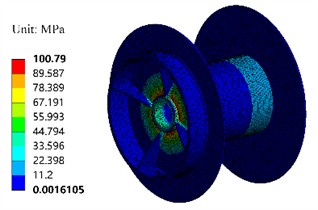
Under extreme load conditions, the overall deformation and stress results of the drum can be obtained, as shown in Fig. 11 and Fig. 12. It can be seen that the maximum stress of the drum component is 100.97 MPa, much lower than its yield limit of 245 MPa. The maximum stress is distributed on the inner side of the reinforcing ribs, indicating a certain degree of stress concentration. The maximum deformation of the model is 0.33 mm, and the stiffness characteristics show good performance. In multi-objective optimization analysis, stress peak is one of the most important basis for building mathematical models. If the stress peak is much smaller than the yield strength, it is possible to lower the stress requirements when setting boundary conditions, which is of great significance for lightweighting [13].
Fig. 11Deformation cloud map
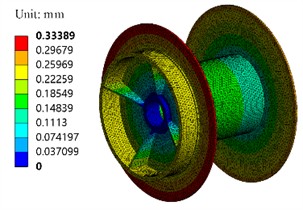
Fig. 12Stress cloud map
To verify the accuracy of the finite element simulation, the DH5902 data acquisition and analysis system and strain gauges were used to test and comparatively analyze the stress, as shown in Fig. 13. This type of dynamic signal testing and analysis system has a wide range of applications and features the ability to achieve multi-channel parallel synchronous high-speed long-term continuous sampling, with high reliability.
Fig. 13Verification plan for the experiment
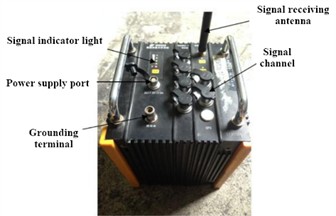
a) DH5902 data acquisition and analysis system
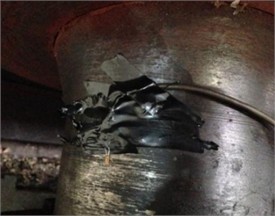
b) Installation of strain gauges
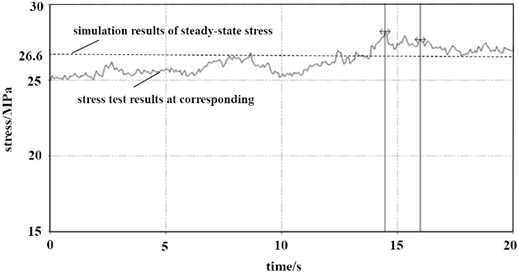
Under the same load conditions as the simulation model, stress tests were conducted at a position 200mm away from the side plate of the drum. The comparison and analysis results are shown in Fig. 14. It can be seen that when the load is maintained for 14.5 seconds, the stress response value tends to a stable state, with an average stress of 27.7 MPa. Compared with the steady-state stress simulation results, the deviation between the two is only 4.1 %, which proves that the finite element model fully meets the accuracy requirements.
Fig. 14Comparison of stress simulation and test values at corresponding position
4. Multi objective optimization and performance evaluation
4.1. Design of discrete samples
For the optimization objective, multiple variables were selected as follows. The first natural frequency is defined as P6, the maximum deformation is defined as P7, the maximum stress is defined as P8, the mass is defined as P9, and the equivalent stiffness is defined as P10. The sensitivity analysis results between design variables and optimization objectives are shown in Fig. 15. It can be seen that the sensitivity changes of strength and stiffness have opposite trends. Therefore, in lightweight design, it is possible to search for design variables that simultaneously meet the optimization objectives.
According to the range of values for design variables, it can be seen that under the condition of allowable assembly dimensions, the range of values for most design variables is symmetrically distributed. Although P4 is an asymmetric value result, the deviation between the lower and upper limits is still relatively small. Therefore, the G-optimization scheme in the central group and design methods was adopted to obtain sample data. In the continuous data interaction and iterative operation between ANSYS and Creo, parameter variables are shared in real-time, and the optimization objectives corresponding to different design variables are finally obtained as shown in Table 3. According to the obtained experimental design table, the response surface required for optimization design can be fitted. From the method of obtaining response surface processes, it can be seen that obtaining design points has a significant impact on the results. When too many design points are selected, the entire optimization design time will be too long, which will affect the efficiency of research and development. When too few design points are selected, the resulting data will result in insufficient accuracy of the response surface model. Therefore, selecting fewer design points to obtain a better response surface model is a key step in experimental design. The interaction relationships between different design variables are shown in Fig. 16. It can be seen that no overlapping problems occur between the data, and the discrete data can all serve as effective foundations to support the response surface function.
Fig. 15Sensitivity analysis results of design variables
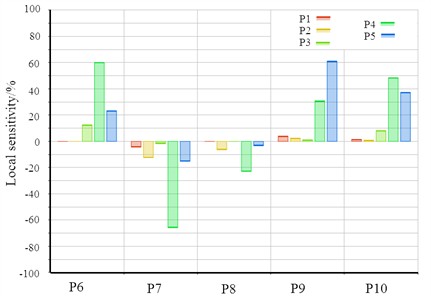
Fig. 16Interaction between design variables
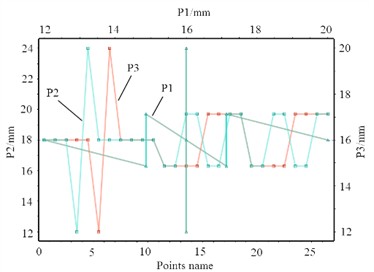
a) Data points corresponding to P1, P2, and P3
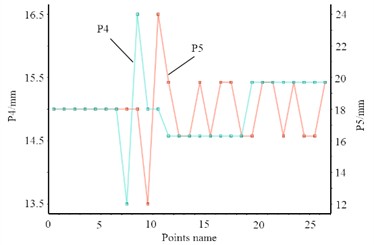
b) Data points corresponding to P4 and P5
4.2. Fitting and error analysis of response surface function
Response surface model is an approximate description that aims to construct a mathematical substitute for a finite element analysis model [14, 15]. This enables the exploitation of this simplified form in optimization design procedures. Through the adoption of this methodology, it becomes practicable to approximate the functional relationship within a particular domain with fewer experimental attempts and express it by means of simple algebraic formulations. Moreover, choosing a suitable regression model can efficaciously capture intricate response connections, demonstrating considerable robustness and facilitating more straightforward design optimization undertakings. In connection with the response surface methodology, it is of paramount importance to establish a fitted association between discrete optimization target variables and design variables . Commonly, one can utilize the least squares technique to determine this functional relationship; the corresponding equation is presented as follows:
where is the fitted response surface target variable, and is the fitting error.
Table 3Discrete sample data
Number | P1/ mm | P2/ mm | P3/ mm | P4/ mm | P5/ mm | P6/ Hz | P7/ mm | P8/ MPa | P9/ kg | P10/ N/m |
1 | 16.00 | 18.00 | 16.00 | 15.00 | 18.00 | 83.70 | 0.33 | 100.79 | 778.17 | 5.45e6 |
2 | 12.00 | 18.00 | 16.00 | 15.00 | 18.00 | 83.69 | 0.34 | 104.02 | 773.45 | 5.41e6 |
3 | 20.00 | 18.00 | 16.00 | 15.00 | 18.00 | 83.69 | 0.33 | 106.61 | 782.89 | 5.48e6 |
4 | 16.00 | 12.00 | 16.00 | 15.00 | 18.00 | 83.69 | 0.34 | 106.04 | 775.26 | 5.42e6 |
5 | 16.00 | 24.00 | 16.00 | 15.00 | 18.00 | 83.70 | 0.33 | 99.86 | 781.08 | 5.47e6 |
6 | 16.00 | 18.00 | 12.00 | 15.00 | 18.00 | 82.01 | 0.33 | 104.66 | 776.76 | 5.22e6 |
7 | 16.00 | 18.00 | 20.00 | 15.00 | 18.00 | 84.55 | 0.33 | 102.60 | 779.57 | 5.576 |
8 | 16.00 | 18.00 | 16.00 | 13.50 | 18.00 | 76.51 | 0.36 | 115.15 | 742.26 | 4.34e6 |
9 | 16.00 | 18.00 | 16.00 | 16.50 | 18.00 | 88.64 | 0.31 | 99.24 | 814.07 | 6.39e6 |
10 | 16.00 | 18.00 | 16.00 | 15.00 | 12.00 | 80.40 | 0.34 | 103.10 | 706.41 | 4.56e6 |
11 | 16.00 | 18.00 | 16.00 | 15.00 | 24.00 | 85.05 | 0.33 | 99.95 | 848.49 | 6.13e6 |
12 | 14.87 | 16.30 | 14.87 | 14.57 | 19.70 | 81.90 | 0.34 | 108.29 | 785.51 | 5.26e6 |
13 | 17.13 | 16.30 | 14.87 | 14.57 | 16.30 | 80.96 | 0.34 | 110.12 | 747.92 | 4.90e6 |
14 | 14.87 | 19.70 | 14.87 | 14.57 | 16.30 | 80.97 | 0.34 | 109.29 | 746.90 | 4.89e6 |
15 | 17.13 | 19.70 | 14.87 | 14.57 | 19.70 | 81.91 | 0.34 | 107.90 | 789.83 | 5.29e6 |
16 | 14.87 | 16.30 | 17.13 | 14.57 | 16.30 | 81.44 | 0.35 | 112.95 | 746.05 | 4.947e6 |
17 | 17.13 | 16.30 | 17.13 | 14.57 | 19.70 | 82.38 | 0.34 | 113.24 | 788.98 | 5.35e6 |
18 | 14.87 | 19.70 | 17.13 | 14.57 | 19.70 | 82.38 | 0.34 | 106.45 | 787.95 | 5.34e6 |
19 | 17.13 | 19.70 | 17.13 | 14.57 | 16.30 | 81.45 | 0.34 | 106.45 | 750.36 | 4.97e6 |
20 | 14.87 | 16.30 | 14.87 | 15.43 | 16.30 | 83.79 | 0.33 | 100.92 | 765.60 | 5.37e6 |
21 | 17.13 | 16.30 | 14.87 | 15.43 | 19.70 | 85.59 | 0.33 | 103.70 | 808.53 | 5.92e6 |
22 | 14.87 | 19.70 | 14.87 | 15.43 | 19.70 | 85.66 | 0.32 | 102.86 | 807.50 | 5.92e6 |
23 | 17.13 | 19.70 | 14.87 | 15.43 | 16.30 | 84.04 | 0.33 | 101.47 | 769.92 | 5.43e6 |
24 | 14.87 | 16.30 | 17.13 | 15.43 | 19.70 | 86.43 | 0.33 | 104.29 | 806.65 | 6.02e6 |
25 | 17.13 | 16.30 | 17.13 | 15.43 | 16.30 | 84.98 | 0.33 | 106.57 | 769.07 | 5.55e6 |
26 | 14.87 | 19.70 | 17.13 | 15.43 | 16.30 | 85.07 | 0.33 | 97.43 | 768.04 | 5.56e6 |
27 | 17.13 | 19.70 | 17.13 | 15.43 | 19.70 | 86.44 | 0.32 | 102.48 | 810.97 | 6.05e6 |
Depending on the characteristics of the optimization objective, the Kriging model was used as an approximating function in the construction of the model. The Kriging technique, widely recognized as a spatial interpolation approach, provides an unbiased and optimal estimation of regionalized variables within a particular area through the utilization of variability function theory and structural analysis. This methodology holds significant importance in statistical studies. Let signify an unobserved point that requires assessment, while , ,..., represent the adjacent observed points with their corresponding values being , ,..., . The value at the unmeasured point is computed as via a weighted combination of the known observed values from the surrounding points:
where is a yet-to-be-determined weight coefficient. The key to Kriging interpolation is calculating the weight coefficient.
Fig. 17The response surface models of P8
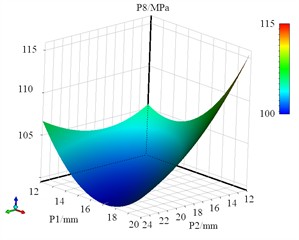
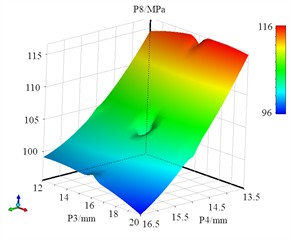
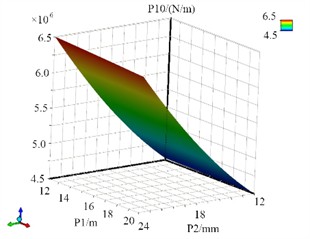
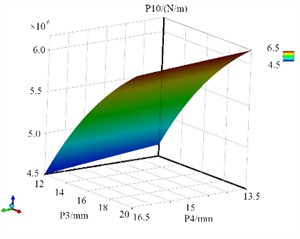
Based on the design of discrete sample data, it is necessary to construct a response surface model for the drum. The intrinsic relationship between design variables and optimization objectives in response surface methodology, where the response surface models of P8, P9 and P10 are shown in Fig. 17, Fig. 18 and Fig. 19. It can be seen that the fitting function of mass has significant linear characteristics. To ensure the accuracy of the fitting model, error validation of the response surface function is required. The principle underlying the optimization of the Design of Experiments (DOE) accentuates that there will invariably exist certain disparities between the response surface model and the actually observed responses, which can profoundly influence the reliability of the optimization procedure. To attain precise fitting functions, it is indispensable to evaluate their accuracy. If this variance lies within an acceptable scope, it implies that the optimization function is efficacious. On the contrary, if it exceeds this limit, alternative experimental design methodologies should be adopted to re-evaluate the optimization parameters.
Fig. 18The response surface models of P9
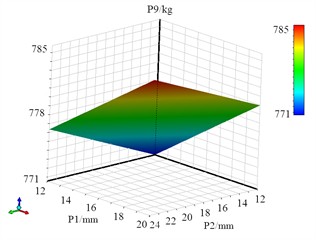
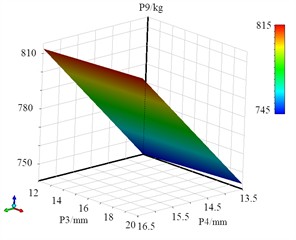
Fig. 19The response surface models of P10
The criteria for assessing the accuracy of response surface models encompass indicators such as (coefficient of determination, the optimal value is 1), , (adjusted , the optimal value is 0), and RMSE (root mean square error, the optimal value is 0). The results of error verification is shown in Table 4. It is observable that the response surface functions corresponding to the three optimization objectives exhibit relatively low fitting errors, thereby rendering them highly reliable for optimization computations.
Table 4Results of error verification
Target parameters | RMSE | ||
P8 | 1 | 0.005 | 0.116 |
P9 | 1 | 5.33e-4 | 0 |
P10 | 1 | 1.26e-5 | 0 |
4.3. Analysis and discussion of optimization results
Once the response surface function is settled, it is feasible to establish an optimization mathematical model that delineates the criteria for choosing the optimization variables. When dealing with multi-objective optimization problems, it is necessary to develop a mathematical framework that accurately represents the problem. Basically, specific optimization problems can be transformed into mathematical forms to facilitate understanding and analysis of different performance improvements. Commonly, an optimization mathematical model encompasses several fundamental elements: objective functions, constraints, design variables, and the like. By making use of this model, the optimization of a reel’s structure can be categorized as a constrained multi-variable nonlinear optimization challenge, which can subsequently be reconfigured to ascertain its optimal solution. The established optimized numerical order model is shown in Eq. (5) and Eq. (6). Where represents the initial isostatic stiffness, and represents the initial peak stress:
In order to process the mathematical model, the sequential quadratic programming algorithm was adopted. This algorithm is considered one of the most effective methods for handling nonlinear constraints, with strong convergence characteristics, high computational accuracy, and efficient search capabilities. This research method can accurately represent approximate functions within a local range with fewer sample data points and express them in simple algebraic form. By developing regression models, complex response relationships can be fitted with significant robustness, greatly promoting design optimization. When dealing with multi-objective optimization functions, the model can be reconstructed to search for the extremum of a single objective function, thereby improving convergence and solving efficiency.
To ensure that the winding drum parts remain with good strength and stiffness after lightweight design, the target parameters P8 and P10 are converted into boundary conditions. Since the stress peak value is lower under the limit load, the boundary conditions are set separately for the two schemes. Scheme A sets the initial value of P8 as the boundary value, i.e., P8 ≤ 100.97 MPa, P10 ≥ 5.45e6 N/m. Scheme B sets the boundary value as 1.5 times the initial value of P8, i.e., P8 ≤ 151.46 MPa, P10 ≥ 5.45e6 N/m. The optimization goal remains unchanged, with the minimum value of the quality parameter P9 as the objective. Based on the sequential quadratic programming algorithm, the parameter variables and the objective extreme values can be obtained for the two optimized schemes, as shown in Table 5. It can be seen that scheme A can reduce the weight of winding drum by 14.1 % while maintaining the maximum stress from increasing and the equivalent stiffness from decreasing. Scheme B can reduce the weight of winding drum by 17.8 %, with a maximum stress of 148.48 MPa and an equivalent stiffness that does not decrease. Furthermore, through verification of other parameters, it can be seen that under the two lightweighting schemes the maximum deformation of P7 has not increased, and the first-order natural frequency of P6 has not decreased. The optimization design effect fully meets the engineering requirements.
Table 5The result of multi-objective optimization
Optimization plan | P1/ mm | P2 /mm | P3/ mm | P4/ mm | P5/ mm | P9/ kg | P8/ MPa | P10/ (N/m) | Weight loss rate / % |
Initial value | 16 | 18 | 16 | 15 | 18 | 778.17 | 100.97 | 5.45e6 | |
Scheme A | 13.0 | 22.1 | 19.1 | 13.5 | 12.0 | 668.25 | 99.85 | 5.45e6 | 14.1% |
Scheme B | 12.2 | 23.3 | 15.3 | 14.1 | 12.0 | 639.96 | 148.48 | 5.45e6 | 17.8% |
5. Conclusions
Science and rational structural design are the basis for ensuring mechanical properties, and one of the necessary means to achieve the energy-saving and cost-reducing design goal of the anchor winch equipment. Based on multi-objective optimization technology, a design scheme that satisfies the modal and strength requirements and weight reduction requirements at the same time was proposed. The response surface function was built by fitting the approximate model, and the accuracy of the mathematical model was verified. The main conclusions are as follows:
1) Coupled parameterized modeling methods can efficiently obtain finite element calculation results that simultaneously meet modal analysis and strength analysis requirements, which provides excellent convenience for multi-objective optimization of complex models and can save computing time to obtain more reliable discrete data sets.
2) Based on the 27 discrete data sets obtained from finite element analysis, an approximate function can be established between the design variables and the optimization objective. Through error verification, it can be seen that the response surface model fitted has high accuracy and reliability. In ANSYS Workbench, the deviation between the calculated and input data can also be verified by data input, and the results show that the maximum error is less than 1 %, which proves the effectiveness of the Kriging model in the lightweight design of the drum parts.
3) The maximum stress under the limit load is only 100.97 MPa, which is much smaller than the minimum yield limit of 235 MPa, therefore, two schemes can be adopted for different types of anchor winches to choose from. Scheme A, compared with the initial model, has a weight reduction rate of 14.1 %, and the maximum stress and equivalent stiffness remain basically unchanged. Scheme B, compared with the initial model, has a weight reduction rate of 17.4 %, the maximum stress is 148.48 MPa, and the equivalent stiffness remains unchanged.
4) The current research mainly focuses on the dynamic response under a single extreme load condition, which can effectively ensure the safety of the equipment. As complex loading conditions often cause nonlinear behaviors in structural components, the influence of complex marine environments on the loads can be further considered. In the lightweight analysis, nonlinear factors of materials can also be added, such as the impact of temperature on material properties, which can enhance the reliability of the simulation results.
References
-
C. Wu, S. Wang, J. Long, and Q. Liu, “Research on modular design and manufacturing of ship anchor winch structure under artificial intelligence optimisation,” International Journal of Wireless and Mobile Computing, Vol. 22, No. 2, p. 148, Jan. 2022, https://doi.org/10.1504/ijwmc.2022.123315
-
G. Chen, G. Wang, S. Liu, J. Zhu, X. Niu, and Y. Wang, “The development of a fillet design tool based on light-weight marine diesel engine crankshafts,” Journal of Marine Science and Engineering, Vol. 12, No. 10, p. 1806, Oct. 2024, https://doi.org/10.3390/jmse12101806
-
R. N. Ferreira, J. C. Falleiros, P. R. Zampieri, J. V. Ferreira, and M. L. Bittencourt, “Experimental and numerical fatigue evaluation of lightweight crankshafts,” Results in Engineering, Vol. 23, p. 102730, Sep. 2024, https://doi.org/10.1016/j.rineng.2024.102730
-
S. M. Radu, F. D. Popescu, A. Andraș, Z. Virág, I. Brînaș, and M.-I. Draica, “A thermo-mechanical stress based fatigue life evaluation of a mine hoist drum brake system using COMSOL multiphysics,” Materials, Vol. 15, No. 19, p. 6558, Sep. 2022, https://doi.org/10.3390/ma15196558
-
Y. Pi, J. Zhang, X. Tang, and J. Zhu, “Three-dimensional dynamic modeling and simulation of a multi-cable winding hoister system considering bidirectional coupling between cage and flexible guides,” Journal of Vibration and Control, Vol. 29, No. 7-8, pp. 1678–1699, Mar. 2022, https://doi.org/10.1177/10775463211068901
-
O. Jassinbekov, M. Isametova, and G. Kaldan, “Development of a technique for computer simulation of the stress state of the drive drum shell of a belt conveyor to optimize its design parameters,” Eastern-European Journal of Enterprise Technologies, Vol. 2, No. 7 (110), pp. 31–39, Apr. 2021, https://doi.org/10.15587/1729-4061.2021.229213
-
H. K. Celik, I. Akinci, N. Caglayan, and A. E. W. Rennie, “Structural strength analysis of a rotary drum mower in transportation position,” Applied Sciences, Vol. 13, No. 20, p. 11338, Oct. 2023, https://doi.org/10.3390/app132011338
-
L. Quynh, Z. Jianrun, N. Liem, B. Cuong, L. X. Long, and D. T. Phuong, “Experimental modal analysis and optimal design of cab’s isolation system for a single drum vibratory roller,” Vibroengineering Procedia, Vol. 31, pp. 52–56, May 2020, https://doi.org/10.21595/vp.2020.21325
-
J. Wang, C. Xu, Y. Xu, X. Qi, Z. Liu, and H. Tang, “Vibration analysis and parameter optimization of the longitudinal axial flow threshing cylinder,” Symmetry, Vol. 13, No. 4, p. 571, Mar. 2021, https://doi.org/10.3390/sym13040571
-
D. Perfetto, C. Pezzella, V. Fierro, N. Rezazadeh, A. Polverino, and G. Lamanna, “FE modelling techniques for the simulation of guided waves in plates with variable thickness,” Procedia Structural Integrity, Vol. 52, No. 1, pp. 418–423, Jan. 2024, https://doi.org/10.1016/j.prostr.2023.12.042
-
R. Talebitooti, M. Zarastvand, and H. Darvishgohari, “Multi-objective optimization approach on diffuse sound transmission through poroelastic composite sandwich structure,” Journal of Sandwich Structures and Materials, Vol. 23, No. 4, pp. 1221–1252, Jun. 2019, https://doi.org/10.1177/1099636219854748
-
R. Talebitooti, H. D. Gohari, and M. R. Zarastvand, “Multi objective optimization of sound transmission across laminated composite cylindrical shell lined with porous core investigating Non-dominated Sorting Genetic Algorithm,” Aerospace Science and Technology, Vol. 69, No. 1, pp. 269–280, Oct. 2017, https://doi.org/10.1016/j.ast.2017.06.008
-
H. D. Chalak, A. M. Zenkour, and A. Garg, “Free vibration and modal stress analysis of FG-CNTRC beams under hygrothermal conditions using zigzag theory,” Mechanics Based Design of Structures and Machines, Vol. 51, No. 8, pp. 4709–4730, Aug. 2023, https://doi.org/10.1080/15397734.2021.1977659
-
R. K. Bhamu, A. Shukla, S. C. Sharma, and S. P. Harsha, “Vibration response of steam turbine healthy and cracked blade under the stress stiffening and spin softening effects,” Proceedings of the Institution of Mechanical Engineers, Part K: Journal of Multi-body Dynamics, Vol. 236, No. 2, pp. 224–243, Feb. 2022, https://doi.org/10.1177/14644193221078656
-
A. Daşdemir, “A modal analysis of forced vibration of a piezoelectric plate with initial stress by the finite-element simulation,” Mechanics of Composite Materials, Vol. 58, No. 1, pp. 69–80, Mar. 2022, https://doi.org/10.1007/s11029-022-10012-7
About this article

The paper is supported by provincial scientific research projects (62874155).
The datasets generated during and/or analyzed during the current study are available from the corresponding author on reasonable request.
Yonghong Fan: initial draft of the paper, determining the research objectives and content. Daoping Han: construction of the model and simulation analysis. Na Li: verification of the simulation results.
The authors declare that they have no conflict of interest.
