Abstract
The transportation of liquids through pipelines has extensive applications in the industrial sector. However, due to factors such as localized negative pressure or discontinuities in fluid flow, the formation of bubbles within the pipeline is a common occurrence. Developing an effective method for detecting these internal bubbles is of significant practical importance. Pipelines containing bubbles can be conceptualized as multiphase flow systems, where the frequency domain characteristics of the system vary with changes in bubble volume. Based on this principle, this paper proposes a method for identifying bubbles within pipelines by analyzing the frequency domain features of mechanical vibration waves. To validate the efficacy of this method, a testing apparatus was constructed to use pressure sensors to detect the pressure signals at the inlet and outlet of a pipeline. By analyzing the amplitude ratio and phase difference of the two signals, the presence of bubbles within the pipeline can be determined. The results demonstrate that this method is effective in detecting bubbles within the pipeline.
1. Introduction
The use of closed-pipe systems for liquid transportation offers several advantages, including high efficiency, excellent sealing performance, high reliability, and ease of maintenance. Consequently, pipeline transportation and storage of liquids have become the primary method for liquid conveyance in modern industries such as chemical engineering, construction, and petroleum energy, with widespread applications in the current industrial sector. However, the presence of issues such as leaks and localized negative pressure within the transport pipelines may lead to the formation of bubbles in the conveyed liquid, which directly impacts the reliability of the entire connection process. The presence of bubbles in the pipeline not only affects the normal transmission of liquid, but also induces water hammer in the high-pressure pipeline, which leads to pipeline explosion and interruption [1]. The state of the liquid within the pipeline can be regarded as a black box, making it difficult to detect and control internal bubble defects. Thus, there is an urgent need for effective technology to detect bubble defects within pipelines. It has attracted many scholars to study this issue [2-10].
Detecting bubbles in pipelines has also become a very important technical problem [11-14]. Existing detection technologies, such as ray [15] and capacitance methods [16], often face the challenge of high detection costs. Additionally, the intrusion of inspection components may adversely affect the state of bubbles within the pipeline, thereby compromising its durability. Therefore, the development of a cost-effective, efficient, and non-intrusive bubble detection technology that does not interfere with the internal state of the pipeline is of paramount importance.
To address the limitations of the aforementioned detection methods, this paper proposes a novel technique for detecting bubbles in pipelines using vibration excitation signals. An excitation vibration signal is applied at the inlet of the pipeline, and the signal is then monitored and analyzed at the outlet. By examining the frequency domain characteristics of the signal during the excitation period, it is possible to determine the volume of bubbles present within the pipeline. This approach provides a nondestructive, efficient, and cost-effective method for identifying the presence of bubbles in pipelines.
2. Principle of detecting bubbles in the pipeline
This section elucidates the detection principle employed to ascertain the volume of cavities contained within a fluid pipeline. The detection methodology relies on the analysis of signal attenuation that occurs during transmission through the pipelines, subsequently deriving the volume of the bubbles within those pipelines. Let us denote the input signal as and the output signal as , where and represent the amplitudes of the input and output signals, respectively. Additionally, let denote the frequency of the signal, while and represent the phases of the input and output signals, accordingly. The relationship governing the attenuation between the input and output signals can be articulated as follows:
The attenuation coefficient at frequency ω, denoted as , is composed of two components: , , the intrinsic attenuation coefficient at frequency 𝜔, and αcavity(ω), the additional attenuation caused by the presence of bubbles at frequency , which varies with the volume of the bubbles. The variable represents the distance over which the signal propagates. The phase shift coefficient, , quantifies the phase change per unit length of the signal, and is given by , where is the average propagation speed of the signal in the pipelines. This speed v can vary due to the influence of the mechanical waves’ transmission medium, which is affected by changes in the content of bubbles. The combination of bubbles within the pipelines and the signal’s frequency itself leads to differential attenuation of the output signal.
3. Experimental part
In accordance with the established testing principle, this paper presents the design of a testing platform, the underlying principle of which is depicted in Fig. 1. The excitation vibration device generates a harmonic excitation signal of a specific frequency, which is precisely applied to the fluid transmission pipeline. This harmonic excitation signal uses the liquid as the propagation medium, is introduced into the pipe through the mounting seat located at the inlet, and is transmitted to the outlet mounting seat. Pressure sensors mounted on the inlet and outlet valve blocks continuously monitor the pressure signals. These monitored pressure signals are then captured by the data acquisition card and processed and analyzed by the computer system to accurately determine the pressure values and phase information at the inlet and outlet of the pipeline. The excitation vibration device has a frequency adjustment function, making it possible to detect and analyze the amplitude and phase characteristics of the pressure signals at both ends of the pipeline within different signal frequency ranges.
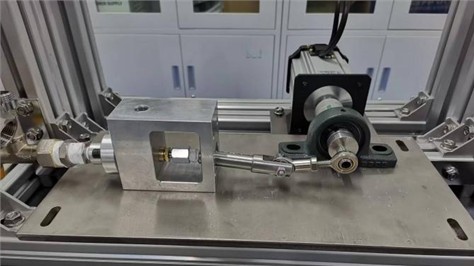
The experimental platform consists of three core components, as shown in Fig. 2. The primary component is the detection device, which is made up of a pressure sensor. The secondary component includes an excitation vibration device, driven by a variable-speed DC motor. This motor drives an eccentric wheel, which in turn operates a crank slider mechanism. This configuration converts rotational motion into reciprocating motion, generating harmonic pressure signals within the pipe, as shown in Fig. 3. The third level component comprises a computer, power supply, data acquisition card, motor, and its driver. The power supply provides energy to the pressure sensor. The motor driver regulates the speed of the DC motor, thereby adjusting the frequency of the input harmonic pressure signal. Additionally, the data acquisition card simplifies the transmission of pressure signals from the inlet and outlet pressure sensors to the computer. Subsequently, the computer analyzes the difference between the inlet and outlet pressure signals to determine the characteristics of the system within the pipe, particularly the amplitude-frequency and phase-frequency characteristics, and to investigate whether there are bubbles present in the pipe.
Fig. 1Schematic diagram of the test bench
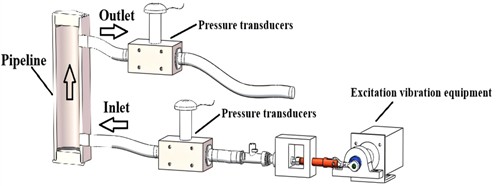
Fig. 2Test bench
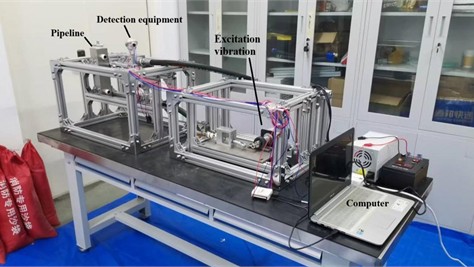
Fig. 3Excitation vibration equipment
In this study, bubbles in a pipe were simulated with different volumes of balloons. When the pipe is filled with fluid, the balloon placed inside takes up some volume so that the inside of the pipe is not filled with fluid. The volume occupied by the balloon is the volume of the bubble. Specifically, the balloons employed to mimic the bubbles had capacities of 0 ml, 5 ml, 20 ml, and 50 ml. The motor speed ranges from 0 revolutions per minute (r/min) to 1800 r/min, while the excitation frequency varies from 0 Hertz (Hz) to 30 Hz, and the angular frequency extends from 0 radians per second (rad/s) to 188.5 rad/s. Balloons of different volumes are systematically inserted into the pipeline to conduct the tests individually, during which the inlet and outlet pressure signals are collected and subsequently analyzed.
4. Result and discussion
According to the experimental results, the Bode diagram is drawn. The amplitude-frequency characteristics and phase-frequency characteristics are plotted as shown in Fig. 4.
The graph in Fig. 4 clearly shows a pronounced resonance peak in the amplitude-frequency response of the liquid flowing through the pipeline. With a 50 ml bubble trapped inside, the liquid exhibits a resonant frequency of about 70 rad/s, accompanied by a peak amplitude of approximately 4. As the volume of the bubble diminishes, the resonance points shift towards higher frequencies, resulting in an increase in the resonance peak value. Furthermore, the phase-frequency curve indicates that within the range of 90 rad/s to 100 rad/s, the phase difference gradually increases with the rise in gas bubble volume. It is evident that in this system, as the volume of bubble increases, the natural frequency decreases, and this trend is quite pronounced.
Fig. 4Amplitude-frequency characteristic curve and Phase-frequency characteristic curve

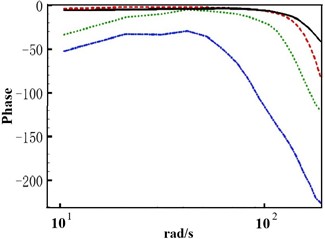
In summary, to detect the presence of bubbles in the pipeline, it can be judged according to the frequency domain response characteristics of the system. With the excitation frequency set to 180 rad/s, little or no air bubbles are detected in the pipeline when the amplitude ratio magnitude exceeds 6 or when the output phase lags the input phase by 0° to 50°. Detections of amplitude ratios between 3 and 6, or an output phase lag of 50° to 100° behind the input phase, indicate a small number of air bubbles in the pipeline. However, an amplitude ratio of less than 3 or an output phase lag of more than 100° indicates that the pipeline contains a large volume of air bubbles, some of which will need to be removed in order to fulfill the requirement. In the same frequency band, the larger the phase lag, the larger the volume of bubbles present in the pipeline and the general trend is relatively obvious.
5. Conclusions
In this paper, a new method for detecting air bubbles in pipelines using vibration excitation signals is proposed and the feasibility is verified by experiments. By applying harmonic excitation to the liquid, coupled with the detection and analysis of pressure signals at the entrance and exit of the pipelines, real-time monitoring of the bubbles within the pipelines is achieved. The method is a cost-effective, efficient and non-invasive bubble detection technique that does not interfere with the internal state of the pipeline, and can be used to detect internal bubbles in closed pipelines that are not readily observable. The proposed method is able to quantify the size of the detected bubble volume in the pipeline and also applicable to tests that detect the effect of bubbles of different volumes on the properties of the system. In this study, the principle of the method has been verified on the test bench and has theoretical guiding significance for practical application.
References
-
J. Hu et al., “Effect of bubble volume on the sweeping velocity of air bubbles in horizontal pipelines in water supply system,” Frontiers in Earth Science, Vol. 11, pp. 1–13, Jun. 2023, https://doi.org/10.3389/feart.2023.1214713
-
K. H. Bendiksen, “An experimental investigation of the motion of long bubbles in inclined tubes,” International Journal of Multiphase Flow, Vol. 10, No. 4, pp. 467–483, Aug. 1984, https://doi.org/10.1016/0301-9322(84)90057-0
-
B. Deng, R. J. Chin, Y. Tang, C. Jiang, and H. L. Sai, “New approach to predict the motion characteristics of single bubbles in still water,” Applied Sciences, Vol. 9, p. 3981, 2019.
-
G. Besagni, P. Brazzale, A. Fiocca, and F. Inzoli, “Estimation of bubble size distributions and shapes in two-phase bubble column using image analysis and optical probes,” Flow Measurement and Instrumentation, Vol. 52, pp. 190–207, Dec. 2016, https://doi.org/10.1016/j.flowmeasinst.2016.10.008
-
Q. Wang et al., “Study on the transient flow characteristics of a hump water pipeline based on the random distribution of bubbles,” Water, Vol. 15, No. 21, p. 3831, Nov. 2023, https://doi.org/10.3390/w15213831
-
D. Fakorede, O. E. Nyong, M. Ifere, A. Bepaye, D. I. Igbong, and C. E. Ebieto, “CFD Modelling of dispersed bubble two-phase flow in a concentric annulus pipe,” International Research Journal of Innovations in Engineering and Technology, Vol. 5, No. 9, pp. 82–85, Jan. 2021, https://doi.org/10.47001/irjiet/2021.509010
-
H. Cheng, J. H. Hills, and B. J. Azzorpardi, “A study of the bubble-to-slug transition in vertical gas-liquid flow in columns of different diameter,” International Journal of Multiphase Flow, Vol. 24, No. 3, pp. 431–452, Apr. 1998, https://doi.org/10.1016/s0301-9322(97)00067-0
-
Y. Taitel, D. Bornea, and A. J. A. J. Dukler, “Modelling flow pattern transitions for steady upward gas‐ liquid flow in vertical tubes,” AIChE Journal, Vol. 26, pp. 345–354, 1980.
-
X. Li et al., “Identification of two-phase flow pattern in porous media based on signal feature extraction,” Flow Measurement and Instrumentation, Vol. 83, p. 102123, Mar. 2022, https://doi.org/10.1016/j.flowmeasinst.2022.102123
-
D. Jiang, C. Zeng, Q. Lu, and Q. Guo, “Water hammer in pipelines based on different friction models,” Scientific Reports, Vol. 14, No. 1, p. 953, Jan. 2024, https://doi.org/10.1038/s41598-024-51409-9
-
S. Rassame and T. Hibiki, “Drift-flux correlation for gas-liquid two-phase flow in a horizontal pipe,” International Journal of Heat and Fluid Flow, Vol. 69, pp. 33–42, Feb. 2018, https://doi.org/10.1016/j.ijheatfluidflow.2017.11.002
-
K. J. Hay, Z.-C. Liu, and T. J. Hanratty, “A backlighted imaging technique for particle size measurements in two-phase flows,” Experiments in Fluids, Vol. 25, No. 3, pp. 226–232, Aug. 1998, https://doi.org/10.1007/s003480050225
-
K. de Kerpel, B. Ameel, C. T. ’Joen, H. Canière, and M. de Paepe, “Flow regime based calibration of a capacitive void fraction sensor for small diameter tubes,” International Journal of Refrigeration, Vol. 36, No. 2, pp. 390–401, Mar. 2013, https://doi.org/10.1016/j.ijrefrig.2012.10.010
-
Y. Fu and Y. Liu, “Development of a robust image processing technique for bubbly flow measurement in a narrow rectangular channel,” International Journal of Multiphase Flow, Vol. 84, pp. 217–228, Sep. 2016, https://doi.org/10.1016/j.ijmultiphaseflow.2016.04.011
-
R. Hanus, M. Zych, P. Ochał, and M. Augustyn, “Identification of the structure of liquid-gas flow in a horizontal pipeline using the gamma-ray absorption and a convolutional neural network,” Applied Sciences, Vol. 14, No. 11, p. 4854, Jun. 2024, https://doi.org/10.3390/app14114854
-
E. E. Okoro, J. E. Rachael, S. E. Sanni, and M. E. Emetere, “Liquid holdup measurement in crude oil transportation using capacitance sensors and electrical capacitance tomography: concept review,” IOP Conference Series: Earth and Environmental Science, Vol. 655, No. 1, p. 012037, Feb. 2021, https://doi.org/10.1088/1755-1315/655/1/012037
About this article

The authors have not disclosed any funding.
The datasets generated during and/or analyzed during the current study are available from the corresponding author on reasonable request.
The authors declare that they have no conflict of interest.
