Abstract
The liquid CO2 phase change fracturing technique has been widely applied in rock engineering for a long time. However, the ground vibration characteristics in bench excavation have not been well demonstrated. In this study, the particle velocities, main frequencies, and displacements of rock induced by liquid CO2 blasting are investigated based on field tests and numerical simulations. Firstly, three field tests of bench excavation using DM83-1.4 type liquid CO2 storage tube were implemented in a specific highway slope project, in which the TC-4850 N vibration monitors were installed at horizontal distances of 4.2 m, 10.6 m, 20.3 m and 32.2 m from the detonation source to detect the rock vibration velocity and frequency. Subsequently, by employing the dynamic finite element program LS-DYNA, a three-dimensional numerical model was established, and then the particle velocities and displacements were analyzed and discussed. The research results indicate that the peak particle velocity (PPV) decays with distance in an exponential pattern, that is, the PPV decays rapidly in the near zone of the blasting source, and it decays more slowly in the far zone. At the position of 20.3 m in the horizontal distance and 15.8 m in elevation, an elevation amplification effect appears with an amplification factor of 1.12. Moreover, the vibration frequency generated by the liquid CO2 phase change fracturing technique is in the range of 0-80 Hz, which is much smaller than that induced by explosive blasting. The main frequency in the near-field of the blasting source is dominated by the radial frequency (), while the vertical frequency () is dominant in the far-field. The attenuation law of displacement is generally consistent with the vibration velocity, and the difference between radial and tangential displacement increases gradually with distance.
Highlights
- The ground vibration characteristics induced by liquid CO<sub>2</sub> blasting technique in bench excavation is experimentally and numerically investigated.
- The elevation amplification effect is found at the position of x=20.3 M, y=15.8 m, and its amplification factor is 1.12.
- The main frequency of particle vibration induced by the liquid CO<sub>2</sub> phase transition fracturing method during excavation of stepped rock mass is in the range of 0 to 80 Hz, which is much lower than the particle vibration frequency induced by traditional explosive blasting.
1. Introduction
Nowadays, the number of slope engineering in open-pit mining and highway construction is increasing rapidly with the development of global society. It is known to all that the rock excavation technique plays a significant role in improving the construction efficiency of slope projects and optimizing the production structure [1-3]. Although explosive blasting has been the most widely used rock breaking technique due to the high efficiency and low cost [4, 5]. However, during the rock mass excavation of the bench in a complicated environment, it is severely restricted due to the strong blasting hazards [6, 7]. Therefore, it is crucial and urgent to develop a novelty excavation method used in the area with harsh conditions. Liquid CO2 phase-changing fracturing technology came into being with the innovation of blasting technology and began to be employed in extensive projects [8, 9]. Indeed, it has been proved to be an effective method on rock breaking, both safely and reliably [10-12]. Although the theoretical studies of this new technology are abundant, there are few open literature on ground vibration, even if the excavation-induced vibration response affects the safety of the slope and bench. Therefore, it is of great significance to perform an investigation on the ground vibration characteristics of bench excavation when using the liquid CO2 phase change fracturing technology to ensure the safety and stability of the slope structure and the further promotion and application of this technology.
Regarding the vibration responses induced by drill-and-blast technology, numerous researches have been conducted with different methods. Pu et al. [13] analyzed the time-frequency of blasting vibration by carrying out scale-model experiments and numerical simulations, the single-hole blasting vibration signals present a centralized distribution in the time domain and an uneven distribution in the frequency domain. In order to explore the propagation law of blasting vibration velocity in strata, Tian et al. [14] conducted a series of blasting vibration tests. The results indicated that PPV at the ground surface decreased with distance, and PPV in the -direction was greater than that in the horizontal direction. To this end, Zhang et al. [15] proposed an improved linear superposition model prediction considering the effect of reflected stretching waves and analyzed the influence of factors such as initiation position, inter-hole delay, and co-sound explosive on the distribution and size of near-field blasting vibration peak velocity. The conclusion shows that the short delay in the hole can significantly change the size and distribution of PPV. In order to evaluate the damage of underground stope blasting to open-air slopes, Jiang et al. [16] carried out field experiments to analyze the propagation and attenuation laws of blasting vibration. With the promotion of artificial neural networks in engineering applications, many researchers attempt to predict the blasting vibration velocity and frequency in different environments [17-19].
At present, there are few studies on the vibration response caused by liquid CO2 phase change technology in rock mass engineering. Tao et al. [20] carried out on-site rock excavation experiments by using explosive and liquid CO2 phase-changing rock breaking methods at the same time. The excavation-induced vibration characteristics of the two methods were analyzed and compared, which indicated that the PPV caused by rock emulsion explosives was significantly greater than that of liquid CO2 phase change rock breaking. Chen et al. [21] monitored the vibration signal through field tests and studied the distribution characteristics of the vibration signal energy of liquid CO2 rock breaking. The research results show that the main vibration frequency band has little correlation with the direction and propagation distance of the vibration signal. Based on the subway foundation pit excavation project, Li et al. [8] carried out a large number of field vibration tests to evaluate the vibration level induced by liquid CO2, and the monitoring vibration signals indicated that the velocity at the vertical direction is higher than that at longitudinal and transverse directions in general. In addition, vibration velocities in three directions significantly attenuate as the distances increase.
In summary, even though extensive studies on the ground vibration characteristics induced by drilling and blasting excavation and the vibration energy caused by liquid CO2 phase-changing technique in rock engineering have been conducted experimentally and numerically. There is still a lack of investigations on dynamic responses of ground vibration, including blasting vibration propagation and attenuation law [9, 22-24]. On this basis, the purpose of this paper is to study the ground vibration characteristics during the liquid CO2 rock fracturing process by performing on-site tests and numerical simulations. First, a slope project was taken as the engineering background, and numerous blasting vibrations were detected using the TC-4850N vibrometer, which is produced by Zhongke Instruments Co., Ltd. Subsequently, three-dimensional numerical models were established based on the explicit FEM program LS-DYNA to further investigate the vibration evolution and displacement of the rock mass. Finally, a comprehensive comparison was carried out between the test results and simulation results. The outcomes of this paper can be helpful to understand and assess the blasting vibration response characteristics of this new fracturing technology in the excavation of bench rock mass. Furthermore, they are of great significance to provide a practical reference for safety protection in similar projects.
2. Field tests of bench blasting using liquid CO2
2.1. Description of field-testing site
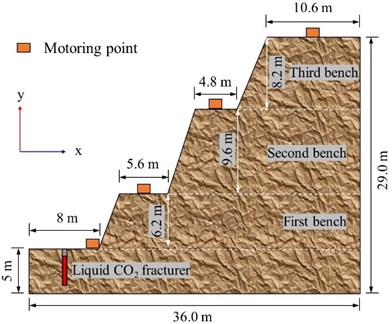
In the present study, the field tests on the bench excavation using liquid CO2 phase-changing fracturing technique were based on a highway modification project in China. As shown in Fig. 1, this road runs in a north-south direction, the west side of which is adjacent to industrial buildings and residential areas. In addition, there is a chimney of chemical production at a distance of approximately 60 m from the test site. The terrain at the test site is steep, in which the bedrock exposes obviously. The stratigraphic lithology is homogeneous, mainly mica schist with local outcrops of granite plants, and the rock mass is relatively hard and intact with RQD value of about 70. The geological investigations showed that the mica-schist formation is 210°∠75°, intersecting the slope at a large angle tangentially. There are a few joints and fissures distributed in the rock mass. Laboratory experiments on rock mechanics were carried out and the results showed that the uniaxial compressive and tensile strengths of the intact rock at the test site were 126.6 MPa and 8.97 MPa respectively. Because of the complex environment around the slope bench renovation project, the application of liquid CO2 phase change fracturing technology for rock excavation is a good way to outcome the defects induced by traditional explosives blasting and to ensure reliable excavation efficiency.
Fig. 1Field test site of rock breaking
2.2. Brief introduction of novel liquid CO2 phase-change fracturing technique
The liquid CO2 phase-changing fracturing technology was first developed in 1914 by Cardox company to improve the extraction rate of low permeability gas in coal mines. As this technology became more sophisticated in the 1980s, it began to be used worldwide in various engineering’s such as coal mining, steel, cement, and power engineering. Unlike chemical blasting with explosives, liquid CO2 phase change fracturing is a purely physical process that does not generate any toxic or harmful gases when breaking the rock medium. As shown in Fig. 2, the main structure of the liquid CO2 fracturing tube consists of a charging head, heat pipe, reservoir, gasket, pressure-setting shear plate, and energy relief tube, the specific functions of each structure are described in detail in the study of Xie et al. [17].
Fig. 2Schematic diagram of liquid CO2 fracturing instrument structure
The rock-breaking principle diagram of a non-disposable liquid carbon dioxide tube is shown in Fig. 3. The principle of liquid CO2 fracturing rock can be simply summarized as follows: first, CO2 is sealed in liquid form in the fracturing tube through high pressure, the fracturing tube is placed into the borehole and the detonation power cable is connected; subsequently, the heating element is triggered by the electric initiation device, and the generated temperature is as high as 1000 °C , at this moment the safety film is pierced and the liquid CO2 instantly vaporizes and expands dramatically generating high pressure. Gaseous CO2 expanding by more than 600 times its volume can generate a shockwave pressure of more than 300 MPa, causing the pressure relief valve to open automatically. Finally, the rock around the fracturing tube is rapidly propelled outwards and damaged by the high-pressure shock wave. Short reaction times and high shockwave pressures are the distinguishing features of liquid CO2 fracturing technology. As the novel rock fracturing technology operates at low temperatures, it does not blend with the liquid and gas of the surrounding environment, does not produce arcs or sparks, and is not affected by high temperatures, high heat, or high cold.
Fig. 3Principle diagram of rock breaking using liquid CO2 technology
The DM83-1.4 liquid CO2 fracturing tube was employed in the on-site bench excavation tests, it should be noted that “83” refers to the diameter of the CO2 storage tube, and “1.4” represents the CO2 primary charge weight. The detailed performance parameters of this type of fracturing tube are listed in Table 1.
Table 1Performance parameters of DM83-1.4 type liquid CO2 fracturing tube
Specific configuration | Unit | Value |
Fracture outer diameter | mm | 83 |
Fracture length | mm | 1130 |
Borehole diameter | mm | 100 |
Charger weight of CO2 | kg | 1.4 |
Maximum pressure | MPa | 9 |
Fracture weight | kg | 32 |
2.3. Implementation of bench excavation
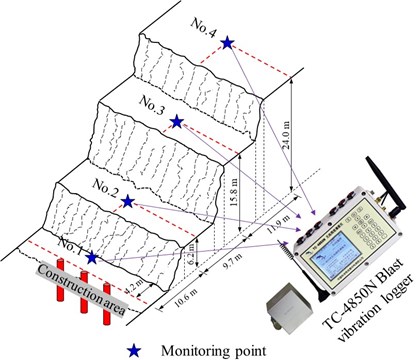
Field tests were carried out at the bottom of the slope to take further insight into the ground vibration at the step plane during the implementation of liquid CO2 fracturing technology. According to the construction design, two liquid CO2 storage tubes were placed in a single borehole and they were connected in tandem, thus a total of 12 tubes are detonated at the same time, as shown in Fig. 4. The detailed blasting parameters were listed in Table 2. In order to monitor the ground vibrations, four three-component geophones (TC-4850N) are installed at different locations along the monitoring line from the center of the blasting region as shown in Fig. 4. The horizontal distances from the center of the explosion source are 4.2 m, 10.6 m, 20.3 m, and 32.2 m in sequence. The vertical distances are 6.2 m, 15.8 m and 24.0 m, respectively. In addition, the TC-4850N vibrometer has a trigger level of 0-35 cm/s, the sampling frequency is 100000 Sps, the frequency range is 1-500 Hz, and the velocity range is between 0-35 cm/s (0-10 V). It should be noted that three field tests in this study have the same blasting parameters and motoring schemes, and to avoid the “whip effect” occurring at the edge of the bench, the four vibration sensors are installed in the middle of the bench plane, as shown in Fig. 5.
Fig. 4Top view of the blasting design
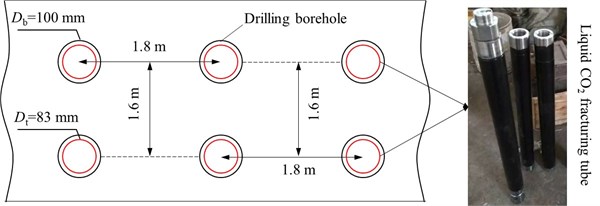
Table 2Blasting test parameters of bench excavation
Hole spacing / m | Row spacing / m | Hole length / m | Stemming length / m | / kg |
1.8 | 1.6 | 2.7 | 0.44 | 16.8 |
: maximum charger per delay | ||||
To ensure that valid vibration data is obtained during liquid CO2 phase-changing rock fracturing, the vibration sensors must be firmly bonded to the ground surface, otherwise, those sensors will loosen and slide during blast vibration, making the signal completely distorted. Thus, in the vicinity of the monitoring point, the debris and damaged rock should be first cleaned so that the intact rock mass is exposed, then bond the vibration sensors to the bedrock by using the concrete piers.
Fig. 5The layout of blasting vibration monitors
3. Results and discussions of field tests
3.1. Measurement results
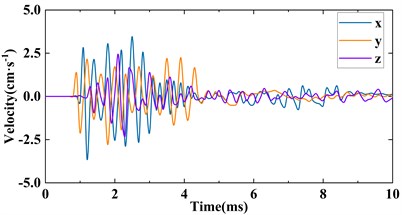
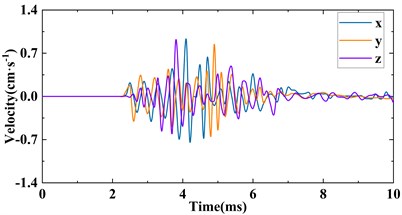
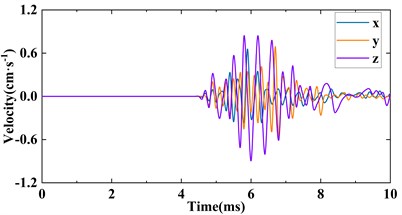
In order to ensure the reliability of the field test results, three groups of field tests were conducted. The vibration data collected at the horizontal distances of 4.2 m, 10.6 m, 20.3 m and 32.2 m from the blasting source were processed to obtain the three-component vibration velocities (, , ), frequencies (, , ) and synthetic PPV results. it is well acknowledged that the magnitude of the vibration velocity generated by blasting directly determines the safety of the structure in the vicinity of the blasting site to protect the object. To directly compared the ground vibrations at four monitoring points, PPV defined as the resultant velocity of three-component velocities is applied herein. The equation of PPV is given below [25]:
According to Eq. (1), PPVs at different monitoring points in the three field tests are calculated and listed in Table 3. The measurement results show that both the vibration velocity components and the PPV decrease with the increase of distance. In addition, the vibration principal frequencies are related to the peak energy characteristics of the vibration, the three-way principal frequency of each measurement point is thus obtained by Fast Fourier Transform (FFT). The results indicate that is significantly greater than the and in the near field (measurement point 1 and measurement point 2), while the distribution of the main vibration frequency changes, dominated the frequency field when the blasting-source distance is greater than 20 m (measurement point 3 and measurement point 4). Like the attenuation law of vibration frequencies caused by explosive blasting, the decreasing rate of the main frequency induced by liquid CO2 phase-changing fracturing tends to increase and then decrease with the distance.
Table 3Monitoring results of vibration velocity and main frequency
Test number | Measurement point | Source distance / m | Height / m | / (cm·s-1) | / (cm·s-1) | / (cm·s-1) | / Hz | / Hz | / Hz | PPV / (cm·s-1) |
T-1 | No. 1 | 4.2 | 0.0 | 2.20 | 2.81 | 3.22 | 78.4 | 80.7 | 81.6 | 4.81 |
No. 2 | 10.6 | 6.2 | 0.73 | 0.75 | 0.78 | 38.5 | 40.7 | 40.3 | 1.31 | |
No. 3 | 20.3 | 15.8 | 0.81 | 0.61 | 0.63 | 32.5 | 29.4 | 28.6 | 1.19 | |
No. 4 | 32.2 | 24.0 | 0.54 | 0.47 | 0.51 | 22.5 | 19.4 | 17.5 | 0.88 | |
T-2 | No. 1 | 4.2 | 0.0 | 1.95 | 2.61 | 3.03 | 80.4 | 82.1 | 81.3 | 4.45 |
No. 2 | 10.6 | 6.2 | 0.78 | 0.80 | 0.84 | 36.1 | 39.8 | 38.3 | 1.40 | |
No. 3 | 20.3 | 15.8 | 0.85 | 0.59 | 0.54 | 29.5 | 27.7 | 26.6 | 1.17 | |
No. 4 | 32.2 | 24.0 | 0.47 | 0.42 | 0.39 | 19.8 | 20.7 | 18.6 | 0.74 | |
T-3 | No. 1 | 4.2 | 0.0 | 2.34 | 2.68 | 3.27 | 75.6 | 79.3 | 85.7 | 4.83 |
No. 2 | 10.6 | 6.2 | 0.70 | 0.75 | 0.83 | 40.6 | 42.9 | 38.1 | 1.32 | |
No. 3 | 20.3 | 15.8 | 0.82 | 0.64 | 0.60 | 30.4 | 28.4 | 27.5 | 1.20 | |
No. 4 | 32.2 | 24.0 | 0.52 | 0.47 | 0.44 | 19.4 | 17.9 | 18.5 | 0.83 |
3.2. Analysis of vibration velocity
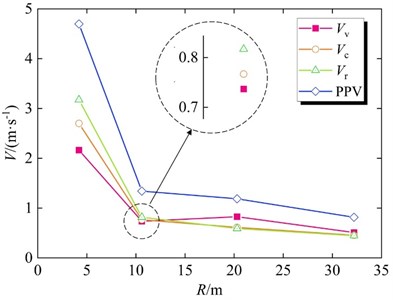
To determine whether the application of CO2 phase-changing fracturing technology will cause blasting hazards to adjacent structures, the velocity components, PPV, and blast source distance variation curves are plotted according to the monitoring vibration velocities and frequencies in Table 3, as shown in Fig. 6. Overall, the vibration velocity component and PPV show an attenuation trend with the increase of distance, and the vibration velocities attenuate as a power function in the near field ( 10.6 m). When 16.8 kg of liquid CO2 is detonated at one time, the PPV of monitoring point No. 1 (4.2 m) is 4.69 cm/s, which is significantly higher than the safe allowable particle vibration velocity of general civil buildings (≤ 3.0 cm/s). The reason for the excessive PPV is that No. 1 is located at the connection between the slope surface and the step surface, and the stress wave generated by the CO2 phase-changing propagates to this position and induces an obvious stress concentration phenomenon, and the obvious failure of rock mass at No. 1 on the test site can prove the conjecture of stress concentration again.
The vibration velocity result of measuring point 2 indicates that the PPV attenuates to an amplitude of less than 1.5 cm/s, and it is difficult to damage the rock mass or other structures currently. The stress wave continues to propagate forward, the velocities decay very slowly, and the velocity component basically remains at about 0.4 cm/s. The curve of and shows that the value of detected in No. 3 is greater than that detected in No. 2, and the amplification factor is about 1.12. This is due to the typical elevation amplification effect at the elevation of 15.8 m as the step elevation increases, and the vertical peak vibration velocity is significantly greater than the radial and tangential peak vibration velocities. However, it should be noted that the velocity component and PPV do not show an amplified phenomenon, and the elevation amplification effect does not occur in measuring points No. 2 or No. 4. Therefore, it is concluded that the elevation amplification effect only occurs under certain blast source distance and elevation conditions when the liquid CO2 phase change fracturing technology is used to excavate the rock mass, and it is not a phenomenon of linear monotonic change:
where represents the detecting point from the blasting source, represents the maximum charge weight per delay, is the parameter related to the rock and excavation environment, and is the attenuation coefficient:
in which, the coefficients and are determined as 4.738 and 1.038, respectively. is 0.966. It is noted that the statistical analysis of the data was conducted in view of the scatter and the limited number of PPVs data.
Fig. 6Decay curve of particle vibration velocity
3.3. Analysis of vibration frequency
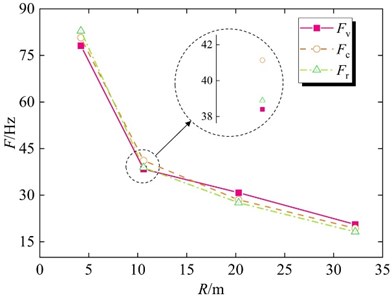
It is difficult to determine whether the adjacent structures are safe only by taking the vibration velocity as a single blasting vibration safety criterion. Thus, the vibration frequency of the rock mass caused by the liquid CO2 technology must also be analyzed. After averaging the frequency data in Table 3, the attenuation curve of the frequency with the blast source distance was drawn, as shown in Fig. 7. The results show that the three-direction main frequency decreases gradually with the increase of the distance, and the attenuation speed of the near-field frequency is greater than that of the far-field frequency. In addition, the main frequency of rock mass vibration caused by the liquid CO2 phase change fracturing technology is within 80 Hz, which is significantly lower than that caused by traditional explosive blasting [26], indicating that the novel l rock breaking technology not only has obvious advantages in blasting vibration velocity control but also has obvious advantages over explosives in vibration frequency control. Furthermore, it is worth noting that the vibration frequency field at No. 1, that is, the connection between the slope and the bench plane, is dominated by , while when exceeds 10.6 m, the plays a dominant role, which is consistent with the attenuation laws of the vibration velocity components. The phenomenon can be explained that the attenuation effects of elevation on the radial frequency and circumferential frequency are more significant than that on vertical frequency.
Fig. 7Decay curve of the main frequency
For most blast-induced vibration, the ratio of the excitation-induced structural vibration frequency to the structural self-oscillation frequency is often larger in the near blast zone, where the main frequency of blast vibration is mainly controlled by the frequency of the excitation load. In the distant area of the blast, the main frequency of vibration is closer to the self-oscillation frequency of the structure, and the structure will be more prone to damage due to resonance effects, this phenomenon has been found in many engineering projects. Conducting an attenuation law fitting for the main frequency value of each monitoring point, the following function is drawn:
where is the distance between blast source and monitoring point.
4. Numerical investigation of bench blasting using liquid CO2
The attenuation characteristics of particle vibration velocity and frequency on the bench plane were studied through field tests. However, it is very difficult to further study the multi-particle PPV, frequency response, displacement response, and its spatiotemporal evolution characteristics on the bench excavation when using the liquid CO2 blasting. Since field experiments are expensive and time-consuming. Therefore, according to the field test conditions and rock mass characteristics, LS-DYNA, a powerful commercial finite element software is utilized in the present study to establish a three-dimensional numerical model, and further investigation on the rock dynamic responses caused by liquid CO2 phase-changing fracturing technology in the bench excavation project was carried out. It should be noted that, in order to shorten the calculation duration, the model is simplified by ignoring the joints and fissures in the engineering rock mass under the premise of ensuring the accuracy of the solution. It is assumed that the rock mass is not a uniform continuum.
4.1. Material model
4.1.1. Rock
There are many constitutive models in the LS-DYNA material library that can simulate the dynamic mechanical behavior of rock and concrete materials subjected to impact loads. The most used are the following four constitutive models: MAT_PLASTIC_KNIMATIC, MAT_RHT, MAT_CONCERET_DAMAGE_REL3 and MAT_CSCM. In this study, MAT_CSCM will be used to characterize the dynamic response characteristics of granite under the stress wave generated by liquid CO2. This model was first developed by the Federal Highway Administration (FHWA) for highway safety protection analysis. The failure surface in the model is represented by three invariants and a cap hardening parameter. The yield function is expressed as [27, 28]:
in which represents the shear failure surface, represents cap function ( is the hardening parameter), is Rubin’s third-invariant factor. The shear failure surface mimics the failure of the tensile section and the lower confining pressure section, and its compression meridian equation is [29]:
in which , , , are obtained by conducting the triaxial experiments on the TRW-3000 true triaxial hydraulic servo testing machine at Central South University. Part of the parameters of rock materials is listed in Table 4.
Table 4Parameters of rock material
/ (kg·m-3) | USC / MPa | / GPa | / GPa | ||||
2680 | 126.6 | 172 | 196.1 | 4.06E+08 | 0.0751 | 3.91E+08 | 1E-09 |
/ MPa | / MPa | ||||||
0.761 | 2E-5 | 0 | 0 | 4 | 6E8 | 80.5 | 6.76 |
UCS: uniaxial compression strength; and are shear modulus and bulk modulus; and are the cap aspect ratio and cap initial location; and are the maximum overstress allowed in compression and tension, respectively. | |||||||
4.1.2. Explosion
At present, it is difficult for commercial simulation software (whether it is a finite element, discrete element, finite difference method, etc.) to mimic the process of the effect of liquid CO2 on external substances when it transforms into gas. Therefore, according to the research performed by Tao et al, the equivalent emulsion explosive is calculated that has the same explosion energy as the DM-83-1.4 fracturing tube. Thus, the ground vibration of bench excavation using the liquid CO2 phase change fracturing technology is numerically studied.
In the LS-DYNA material library, the explosive is characterized by the Jones-Wilkens-Lee equation of state (JWL EOS) through establishing a relationship between the volume, energy and pressure of detonation products. The JWL EOS is given below [30]:
where , pressure after the explosion; , the initial relative volume of detonation products; , the internal energy of detonation products; , , , and are the material constants.
Referring to the study of large-diameter blasting into a shaft [21], the material parameters of the emulsion explosive are listed in Table 5.
Table 5Parameters of the explosive material and JWL EOS
/ (kg·m-3) | VOD / (m·s-1) | / GPa | / GPa | / GPa | / GPa | ||
1250 | 4230 | 214.4 | 0.182 | 4.2 | 0.9 | 0.15 | 4.192 |
: density of emulsion explosive; VOD: detonation velocity | |||||||
4.1.3. Air
In the process of liquid CO2 phase change excavation, the diameter of the borehole is larger than the diameter of the cracker, indicating that the air coupling medium is filled between the rock mass and CO2. Therefore, the constitutive model of MAT_NULL coupled with the specified linear polynomial EOS is used to simulate air. This equation of state defines the relationship between pressure, density and internal energy, which is described by [31]:
where , air pressure; , , , , , and , user-defined constants; , initial internal energy; , compression parameter expressed as , where is the relative volume.
Referring to Cheng et al. research on the effect of air deck on blasting vibration response [4], the air material parameters are listed in Table 6.
Table 6Parameters of air material
/ (kg·m-3) | / (J·cm-3) | ||||||||
1.255 | 0 | 0 | 0 | 0 | 0.401 | 0.401 | 0 | 1.0 | 0.25 |
4.2. Numerical model
In order to make the numerical simulation as much as possible to reproduce the field test of the bench excavation using the liquid CO2 phase change fracturing technology, HyperMesh was used to establish a full-scale model consistent with the geometric parameters of the field test, as shown in Fig. 8. The model is composed of rocks, explosives and air, with a length of 36.0 m, a height of 24.0 m, and a width of 2.0 m. The inclination of the benches ranges from 65° to 75°. The boundary of the model is set as a non-reflection boundary except the upper surface is set as a free surface, which is used to mimic infinite rock mass and eliminate the damaging effect caused by the reflection of stress waves on the boundary. Forces and displacements between rock elements are calculated using the Lagrangian algorithm, and explosives and air are calculated using the ALE 11 algorithm. The unit system is kg-m-s. According to the structure of the liquid CO2 fracturing instrument, the explosive is detonated by means of the bottom of the hole.
Fig. 8Numerical model of liquid CO2 blasting
4.3. Vibration response
In the three-dimensional numerical model, four elements with the same location as the field measuring point were selected to analyze the temporal and spatial evolution characteristics of vibration and displacement caused by liquid CO2 phase transition cracking, the elements are numbered from near to far as H328329, H321166, H332564 and H277331. The cloud maps of the resultant vibration velocity at time 1.0 ms, 2.5 ms, 5.0 ms and 7.0 ms are shown in Fig. 9. When 1.0 ms, the stress wave generated by the energy released propagates to the toe of the slope. At this moment, due to the geometrical characteristics of the step, velocity concentration can be observed at the toe of the slope. As the stress wave continues to propagate forward, the rock mass near the detonation point will be damaged and destroyed by the strong disturbance of the instantaneously expanding CO2 gas. The velocity cloud map at 2.5 ms shows that the particle velocity in this range is much higher than the vibration velocity in other ranges. When the stress wave propagates to the H32116 element in the form of a plane wave, the particle starts to vibrate under the action of the stress wave. When 7.5 ms, the stress wave generated by the phase change blasting propagates to the monitoring point of the uppermost step. The cloud image shows that the velocity near the blast source is the highest, and the velocity cloud image which is obviously larger than that of the measuring points 2 and 4 can be observed under the measuring point No. 3. The color layer of the cloud map can be used as a brief criterion for evaluating the vibration velocity of rock mass particles.
Fig. 9Cloud map of particle synthetic velocity

The velocity history data of the monitoring elements were output by the LS-PrePost program and then imported into the OriginPro scientific drawing software to plot the unit velocity time history curve of different measuring points as shown in Fig. 10. As shown in Fig. 7(a), the duration of strong particle vibration caused by liquid CO2 phase change rock breaking is about 4 ms, and the radial velocity (), tangential velocity () and vertical velocity () of H328329 are 3.63 cm/s, 2.79 cm/s and 2.16 cm/s, respectively, and PPV is 5.18 cm/s, indicating that the rock mass is strongly disturbed and is likely to be damaged. The vibration velocity of H321166 is significantly lower than that of H328329. The values of , and are 0.92 cm/s, 0.84 cm/s and 0.90 cm/s, respectively, and PPV at this location induced by the seismic wave is 1.54 cm/s. It is worth noting that, comparing the vibration velocity between H332564 and H321166, the vertical vibration velocity of H332564 is greater than that of the H321166, indicating that the simulation of the liquid CO2 phase change step blasting by the finite element method also obtains the elevation method effect is also obtained at the same position, but the vector and velocity are still strictly attenuated with the increase of the blast source distance, as PPV = 1.31 cm/s.
Fig. 10Time histories of vibration velocity at different monitoring locations
a) Element H328329
b) Element H321166
c) Element H332564
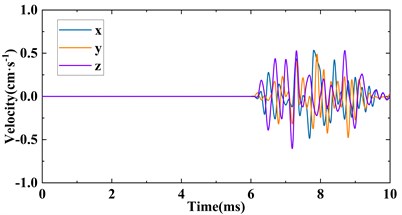
d) Element H277331
Table 7Comparison of vibration velocities between numerical simulation and field test
Detecting point | / m | / m | Numerical results / (cm·s-1) | Measurement results / (cm·s-1) | Relative error | |||||||||
PPV | PPV | PPV | ||||||||||||
No.1 | 4.2 | 0.0 | 2.16 | 2.70 | 3.17 | 4.696 | 2.43 | 2.79 | 3.63 | 5.18 | 0.11 | 0.03 | 0.12 | 0.09 |
No.2 | 10.6 | 6.2 | 0.74 | 0.77 | 0.82 | 1.341 | 0.90 | 0.84 | 0.92 | 1.54 | 0.19 | 0.09 | 0.11 | 0.13 |
No.3 | 20.3 | 15.8 | 0.83 | 0.61 | 0.59 | 1.187 | 0.90 | 0.69 | 0.66 | 1.31 | 0.08 | 0.11 | 0.10 | 0.09 |
No.4 | 32.2 | 24.0 | 0.51 | 0.45 | 0.45 | 0.816 | 0.85 | 0.49 | 0.52 | 1.11 | 0.40 | 0.07 | 0.14 | 0.26 |
: Distance from detecting point to explosion source; : Elevation of detecting point | ||||||||||||||
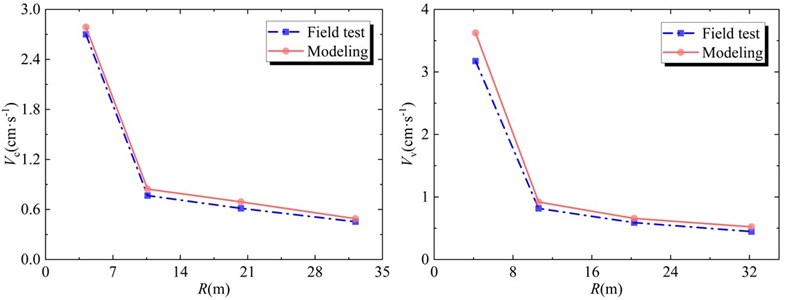
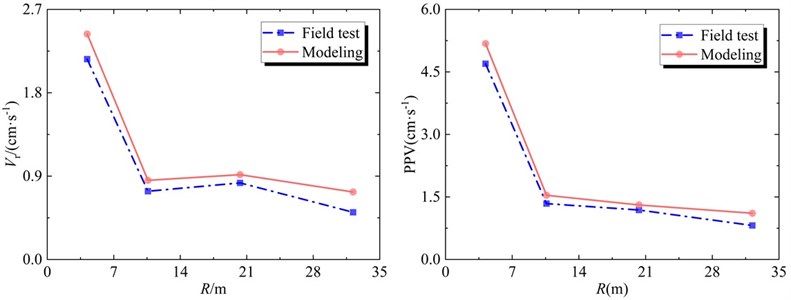
In order to analyze and discuss the blasting vibration results measured by field tests and numerical simulation, a dot-line diagram of the vibration velocity and the blast source distance change is plotted, as shown in Fig. 11. It is found that the attenuation law of vibration velocity obtained by numerical simulation is basically consistent with the field results, both of which show that the near-field attenuation of the blast source is rapid, and the vibration velocity attenuation slows down after the blasting seismic wave propagates to the far-field. The variation curve of radial vibration velocity and blast source distance reveals that the height amplification effect occurs in field tests and numerical simulation at the third monitoring point (20.3 m, 15.8 m), while other velocities strictly follow the law of attenuation. However, for both the velocity components and PPV, the numerical simulation results are larger than the field measurements, and for , the difference between the two is the largest. The reason for this phenomenon is that the rock mass is assumed to be a homogeneous continuum when the numerical model is constructed, and the effects of joints, fissures, discontinuities, and faults in the actual engineering rock mass on the propagation of stress waves are ignored. In fact, any discontinuous surface in the rock mass is equivalent to a material whose wave impedance is much smaller than that of the rock mass medium. When the seismic wave propagates to the interface, reflection and diffraction phenomena must occur, and the energy in the stress wave will inevitably occur. ground attenuation and the magnitude of the attenuation amplitude are closely related to the thickness, inclination, and other factors of the discontinuous surface.
Fig. 11Comparisons of vibration velocity between numerical simulation and field measurement
4.4. Dynamic response of rock displacement
The rock displacement is an intuitive representation of the intensity of the rock mass being disturbed. Therefore, the cloud map of the particle displacement at four states is selected in the calculation result file, as shown in Fig. 12. At 1.0 ms, the maximum displacement of the rock mass around the blast hole in the calculation model is 10.21 cm, which is much larger than the maximum allowable displacement value of the rock material, indicating that the rock mass near the blast source is severely damaged, which is consistent with the results of the particle vibration velocity cloud map. At 2.5 ms, the stress wave propagates to the measuring point 2, and it is found that the displacement of the rock mass near the explosion source is about 13.7 cm, indicating that the explosive is continuously releasing energy outward. At 7.5 ms, the cloud map of measuring point 1 is displayed in red, indicating that stress concentration occurs at this point, which makes the displacement increase significantly.
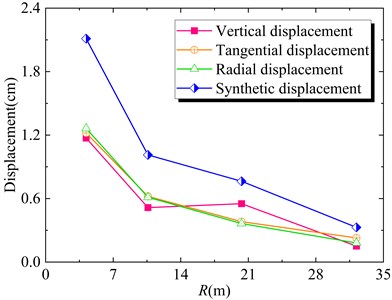
The rock displacements of the four monitoring points are plotted through the LS-DYNA post-processing program, and the attenuation curve of the rock mass particle displacement with the blast source distance is drawn using OriginPro software, as shown in Fig. 13. It can be seen from Fig. 13 that both the particle displacement component and the composite value show a trend of rapid decrease in the near field and slow decrease in the far-field with the increase of the detonation source distance, which is basically consistent with the change law of the particle vibration velocity. The maximum synthetic displacement of measuring point 1 is 2.12 cm, which is about 2.08 times the synthetic velocity of measuring point 2. When the blast source distance is 32.2 m, the maximum displacement of the particle drops to 0.18 m, and the complete rock mass is not damaged. It is worth noting that the radial displacement and tangential displacement are basically the same within the blast source distance range of 20.3 m, and then the error gradually becomes obvious.
Fig. 12Cloud map of particle displacement
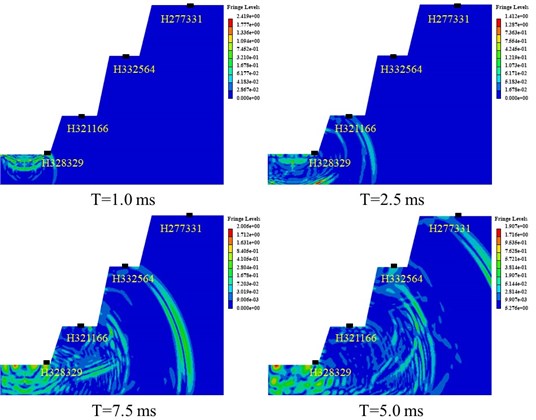
Fig. 13Decay curve of particle displacement
5. Conclusions
In this study, the ground vibration responses of bench excavation using liquid CO2 phase-changing fracturing technology were investigated experimentally and numerically. The main conclusions are drawn as follows:
1) In the bench excavation project, PPV caused by liquid CO2 phase transition and cracking is rapidly attenuated in the vicinity of the blast source within the range of 10.6 m, and the rear vibration velocity decreases slowly with the increase of distance, showing an exponential function attenuation trend in general. When 16.8 kg of liquid CO2 is detonated at one time, the elevation amplification effect occurs at the detonation source distance and the elevations of 20.3 m and 24 m, and the amplification factor is 1.12.
2) The main frequency of particle vibration induced by the liquid CO2 phase transition fracturing method during excavation of stepped rock mass is in the range of 0 to 80 Hz, which is much lower than the particle vibration frequency induced by traditional explosive blasting. The vibration frequency of rock mass in the near field of the blast source is dominated by the radial dominant frequency. With the increase of the blast source distance, the vertical dominant frequency begins to play a dominant role.
3) The particle vibration velocity obtained based on LS-DYNA numerical simulation is about 10 % larger than the field measurement results, which is within the allowable error range for engineering research; in addition, the numerical simulation results show that the attenuation law of particle displacement and the attenuation law of vibration velocity are basically the same Consistent.
4) The application of the new liquid CO2 phase transition fracturing technology in the multi-step rock excavation has achieved ideal vibration and frequency control and provides a reliable reference experience for the construction of similar projects. Meanwhile, the numerical simulation based on the dynamic finite element is useful for the predictions of vibration parameters. The rock-breaking method provides an alternative technical means for the safety prediction of adjacent structures.
References
-
K. Deng and M. Chen, “Blasting excavation and stability control technology for ultra-high steep rock slope of hydropower engineering in China: a review,” European Journal of Remote Sensing, Vol. 54, No. sup2, pp. 92–106, Mar. 2021, https://doi.org/10.1080/22797254.2020.1752811
-
Y. Hu, W. Lu, M. Chen, P. Yan, and J. Yang, “Comparison of blast-induced damage between presplit and smooth blasting of high rock slope,” Rock Mechanics and Rock Engineering, Vol. 47, No. 4, pp. 1307–1320, Jul. 2014, https://doi.org/10.1007/s00603-013-0475-7
-
M. Xiong and Y. Huang, “Novel perspective of seismic performance-based evaluation and design for resilient and sustainable slope engineering,” Engineering Geology, Vol. 262, p. 105356, Nov. 2019, https://doi.org/10.1016/j.enggeo.2019.105356
-
Y. Chen, S. Ma, Y. Yang, N. Meng, and J. Bai, “Application of shallow-hole blasting in improving the stability of gob-side retaining entry in deep mines: a case study,” Energies, Vol. 12, No. 19, p. 3623, Sep. 2019, https://doi.org/10.3390/en12193623
-
Z. Xie, D. Zhang, Z. Song, M. Li, C. Liu, and D. Sun, “Optimization of drilling layouts based on controlled presplitting blasting through strata for gas drainage in coal roadway strips,” Energies, Vol. 10, No. 8, p. 1228, Aug. 2017, https://doi.org/10.3390/en10081228
-
F. Ji, J. Lu, Y. Shi, and C. Zhou, “Mechanical response of surrounding rock of tunnels constructed with the TBM and drill-blasting method,” Natural Hazards, Vol. 66, No. 2, pp. 545–556, Mar. 2013, https://doi.org/10.1007/s11069-012-0500-2
-
J. Yang, X.-G. Yang, J.-W. Zhou, Y. Liu, B.-S. Dong, and H.-B. Li, “Comparative study of the excavation damage and rockburst of the deeply buried Jinping II diversion tunnels using a TBM and the Drilling-Blasting Method,” Advances in Civil Engineering, Vol. 2020, pp. 1–14, Dec. 2020, https://doi.org/10.1155/2020/8876214
-
Q.-Y. Li, G. Chen, D.-Y. Luo, H.-P. Ma, and Y. Liu, “An experimental study of a novel liquid carbon dioxide rock-breaking technology,” International Journal of Rock Mechanics and Mining Sciences, Vol. 128, p. 104244, Apr. 2020, https://doi.org/10.1016/j.ijrmms.2020.104244
-
Q. Li, D. Luo, G. Feng, H. Ma, X.A. Wei, and G. Chen, “Dynamic characteristics of liquid CO2 phase change fracturing, using experimental technique,” Geotechnical and Geological Engineering, Vol. 37, No. 4, pp. 3387–3398, Aug. 2019, https://doi.org/10.1007/s10706-019-00853-w
-
Z. Shang et al., “Experimental investigation of BLEVE in liquid CO2 phase-transition blasting for enhanced coalbed methane recovery,” Fuel, Vol. 292, No. 7, p. 120283, May 2021, https://doi.org/10.1016/j.fuel.2021.120283
-
B. Xia, X. Liu, D. Song, X. He, T. Yang, and L. Wang, “Evaluation of liquid CO2 phase change fracturing effect on coal using fractal theory,” Fuel, Vol. 287, p. 119569, Mar. 2021, https://doi.org/10.1016/j.fuel.2020.119569
-
Y. Zhang, H. Deng, B. Ke, and F. Gao, “Research on the explosion effects and fracturing mechanism of liquid carbon dioxide blasting,” Mining, Metallurgy and Exploration, Vol. 39, No. 2, pp. 521–530, Apr. 2022, https://doi.org/10.1007/s42461-021-00514-8
-
P. Yuan, Y. Xu, and Z. Zheng, “Time-frequency analyses of blasting vibration signals in single-hole blasting model experiments,” Journal of Vibroengineering, Vol. 19, No. 1, pp. 363–375, Feb. 2017, https://doi.org/10.21595/jve.2016.17031
-
X. Tian, Z. Song, and J. Wang, “Study on the propagation law of tunnel blasting vibration in stratum and blasting vibration reduction technology,” Soil Dynamics and Earthquake Engineering, Vol. 126, p. 105813, Nov. 2019, https://doi.org/10.1016/j.soildyn.2019.105813
-
C. Zhang, Z. Leng, G. Zhou, X. Huang, X. Yan, and Q. Xiao, “On the near-field peak particle velocity distribution characteristics of deep-hole bench blasting in hydropower projects,” (in Chinese), Hydropower and New Energy, Vol. 35, No. 7, pp. 22–26, 2021, https://doi.org/10.13622/j.cnki.cn42-1800/tv.1671-3354.2021.07.006
-
N. Jiang, C. Zhou, S. Lu, and Z. Zhang, “Propagation and prediction of blasting vibration on slope in an open pit during underground mining,” Tunnelling and Underground Space Technology, Vol. 70, pp. 409–421, Nov. 2017, https://doi.org/10.1016/j.tust.2017.09.005
-
A. E. Álvarez-Vigil, C. González-Nicieza, F. López Gayarre, and M. I. Álvarez-Fernández, “Predicting blasting propagation velocity and vibration frequency using artificial neural networks,” International Journal of Rock Mechanics and Mining Sciences, Vol. 55, pp. 108–116, Oct. 2012, https://doi.org/10.1016/j.ijrmms.2012.05.002
-
C. Cai, Q. Qian, and Y. Fu, “Application of BAS-Elman neural network in prediction of blasting vibration velocity,” Procedia Computer Science, Vol. 166, pp. 491–495, 2020, https://doi.org/10.1016/j.procs.2020.02.059
-
X. Wang, J. Li, X. Zhao, and Y. Liang, “Propagation characteristics and prediction of blast-induced vibration on closely spaced rock tunnels,” Tunnelling and Underground Space Technology, Vol. 123, p. 104416, May 2022, https://doi.org/10.1016/j.tust.2022.104416
-
M. Tao, H. Zhao, X. Li, and A. Ma, “Comprehensive comparative analysis of liquid CO2 phase change fracturing and explosive rock fracturing,” (in Chinese), Blasting, Vol. 35, No. 2, pp. 41–49, 2018, https://doi.org/10.3963/j.issn.1001-487x.2018.02.008
-
G. Chen, Q. Li, X. Liu, Z. Wu, and J. Ma, “Research on energy distribution characters about liquid co2 phase-transition broken rock vibration signal,” (in Chinese), Blasting, Vol. 35, No. 2, pp. 155–163, 2018, https://doi.org/10.3963/j.issn.1001-487x.2018.02.027
-
X. Cui, B. Ke, S. Yu, P. Li, and M. Zhao, “Energy characteristics of seismic waves on Cardox blasting tube,” Geofluids, Vol. 2021, pp. 1–13, Oct. 2021, https://doi.org/10.1155/2021/9919764
-
H. Sui, T. Su, R. Hu, K. Yang, and Y. Cheng, “Liquid CO2 phase-transition rock fracturing: a novel technology for safe rock excavation,” Applied Sciences, Vol. 12, No. 1, p. 68, Dec. 2021, https://doi.org/10.3390/app12010068
-
F. Gao, L. Tang, K. Zhou, Y. Zhang, and B. Ke, “Mechanism analysis of liquid carbon dioxide phase transition for fracturing rock masses,” Energies, Vol. 11, No. 11, p. 2909, Oct. 2018, https://doi.org/10.3390/en11112909
-
M. Leidig, J. L. Bonner, T. Rath, and D. Murray, “Quantification of ground vibration differences from well-confined single-hole explosions with variable velocity of detonation,” International Journal of Rock Mechanics and Mining Sciences, Vol. 47, No. 1, pp. 42–49, Jan. 2010, https://doi.org/10.1016/j.ijrmms.2009.07.006
-
J. Zhou, W. B. Lu, L. Zhang, M. Chen, and P. Yan, “Attenuation of vibration frequency during propagation of blasting seismic wave,” (in Chinese), Chinese Journal of Rock Mechanics and Engineering, Vol. 33, No. 11, pp. 2171–2178, 2014.
-
M. Tao, X. Li, and D. Li, “Rock failure induced by dynamic unloading under 3D stress state,” Theoretical and Applied Fracture Mechanics, Vol. 65, pp. 47–54, Jun. 2013, https://doi.org/10.1016/j.tafmec.2013.05.007
-
M. Tao, X. Li, and C. Wu, “Characteristics of the unloading process of rocks under high initial stress,” Computers and Geotechnics, Vol. 45, pp. 83–92, Sep. 2012, https://doi.org/10.1016/j.compgeo.2012.05.002
-
D. Levi-Hevroni, E. Kochavi, B. Kofman, S. Gruntman, and O. Sadot, “Experimental and numerical investigation on the dynamic increase factor of tensile strength in concrete,” International Journal of Impact Engineering, Vol. 114, pp. 93–104, Apr. 2018, https://doi.org/10.1016/j.ijimpeng.2017.12.006
-
J.-J. Zhao, Y. Zhang, and P. G. Ranjith, “Numerical modelling of blast-induced fractures in coal masses under high in-situ stresses,” Engineering Fracture Mechanics, Vol. 225, p. 106749, Feb. 2020, https://doi.org/10.1016/j.engfracmech.2019.106749
-
Y. Gou, X. Shi, X. Qiu, J. Zhou, H. Chen, and X. Huo, “Propagation characteristics of blast-induced vibration in parallel jointed rock mass,” International Journal of Geomechanics, Vol. 19, No. 5, p. 04019025, May 2019, https://doi.org/10.1061/(asce)gm.1943-5622.0001393
Cited by
About this article

The authors extend their appreciation to the management and personnel of Zhixian Hong and Xingyu Fan who provided excellent cooperation during the field monitoring for this work.
