Abstract
The topography of a thin double-sided rock slope differs greatly from that of a regularly studied single-sided rock slope, which leads to difficulties in investigating the dynamic response of the thin double-sided rock slope. Through a case study, this paper provides a specific prospect on the dynamic response of the high and thin rock slope under blasting vibration. The high and thin rock slope belonging to Chiwan Mountain was selected as the typical case slope. Field monitoring programs for blasting vibration on the case slope were carried out using vibration monitoring systems. The amplitude, frequency, and energy characteristics of the recorded blasting vibration were then concretely identified and examined. The monitoring results were further used to validate the dynamic finite element model developed to explore the effects of blasting vibration frequency and amplitude on the dynamic response of the slope. The dynamic finite element model of the case slope subjected to blasting vibration was established using the software LS-DYNA. According to the monitoring and numerical results, the dynamic response mechanism of the high and thin rock slope under blasting vibration was discussed. The results indicate that the elevation amplification effect of blasting vibration exists on the southern slope from a certain elevation, and the dominant frequencies generally decay with the distance from the blasting source but remain largely the same within a specific elevation range. The blasting vibration frequencies have considerable influence on both the values and distributions of peak particle velocities on the slope while the blasting vibration amplitudes have an impact only on the values of peak particle velocities. The dynamic response of the case slope under blasting vibration results from the joint effects of blasting seismic wave propagation and structural resonance. The research findings may pave an effective way to clearly understand the dynamic response of similar high and thin rock slopes under blasting vibration.
1. Introduction
High rock slopes are common in urban construction, water conservancy and hydropower engineering, mining engineering, and transportation engineering [1, 2]. The majority of natural high rock slopes are steep with a height of above 50 meters [3]. During blasting excavation of high rock slopes, repeated blasting vibrations probably cause adverse effects on the stability of high rock slopes [4, 5]. Therefore, it is necessary to conduct research on the dynamic response of high rock slopes under blasting vibration.
The research regarding the dynamic response of high rock slopes under blasting vibration mostly focuses on the high rock slopes belonging to thick mountains, or single-sided rock slopes, and many meaningful research results have been concluded. Shu et al. [6, 7] analyzed a large number of measured blasting vibration data on high rock slopes, and they found that the blasting vibration on high rock slopes shows an overall attenuation trend with the increasing horizontal distance and elevation from blasting source, and the elevation amplification phenomenon is only limited to a certain elevation range. Based on theoretical analysis, numerical simulation, and measured data analysis, Chen et al. [8] pointed out that the blasting vibration at the toe of high rock slope steps decays with the increasing elevation under similar slope shapes, and the elevation amplification effect only occurs under specific conditions. Through numerical simulation, Fu et al. [9] concluded that the elevation amplification effect of blasting vibration on high rock slopes is limited to a small local region and the amplification effect is not significant on the inner side of the berm and the middle of the step surface. Wu et al. [10] believed that the particle velocity on the step surface exhibits an exponential decay law as the distance from blasting source increases, and the amplification effect of vibration is only limited to certain horizontal distances and height differences from blasting source. Yang et al. [11], Jiang et al. [12, 13], Song et al. [14], Kahrman et al. [15], Ak et al. [16], Choi and Deb [17, 18], and Zhang et al. [19] also demonstrated that the blasting vibration on high rock slopes mainly decays with the increasing horizontal distance and elevation from blasting source. As a result, the blasting vibration on the high rock slope surface belonging to thick mountains shows an overall attenuation trend with the increasing horizontal distance and elevation from blasting source when the protruding wedge-shaped parts of the slope steps are ignored, and there may be elevation amplification effect of blasting vibration in local regions such as slope tops and regions with sudden slope changes.
For the widely existing high and thin rock slopes, or double-sided rock slopes, there are significant differences in structural morphology between them and thick rock slopes, or single-sided rock slopes [20, 21]. The structure of the high and thin rock slope is similar to a convex structure, while the structure of the high and thick rock slope can be approximated as semi-infinite rock mass. According to relevant research on the vibration response of convex structures such as middle rock sidewall [22, 23], convex landforms [24, 25], and raised steps [26-28], the vibration response characteristics of convex structures are different from those of high and thick rock slopes. The main manifestation is that there is a significant elevation amplification effect of the vibration on convex structures, and this amplification effect is particularly significant in the regions near the free surface of the structure top [29]. The research on the blasting vibration of actual high and thin rock slopes further proves that the elevation amplification effect of vibration on convex structures also exists in high and thin rock slopes [30]. Accordingly, the thick and thin rock slopes are not only different in structure form, but also different in blasting vibration response characteristics. However, there have been few reports on the blasting vibration response of high and thin rock slopes. At present, the blasting design theory and method for high rock slope excavation are mainly aimed at the high and thick rock slopes, while the existence of elevation amplification effect of blasting vibration on high and thin rock slopes is more detrimental to their stability. Therefore, it is urgent to conduct in-depth research on the dynamic response of high and thin rock slope under blasting vibration.
As a typical case of the thin and high double-sided slope, the Chiwan mountain high rock slope was taken as an example to carry out blasting vibration field monitoring and dynamic finite element numerical simulation, and the dynamic response of the case slope under blasting vibration was concretely investigated through monitoring and numerical results. The results help better understand the dynamic response of similar high and thin rock slopes under blasting vibration, and may provide scientific references for blasting design and vibration control of high and thin rock slope excavation.
2. Case slope description
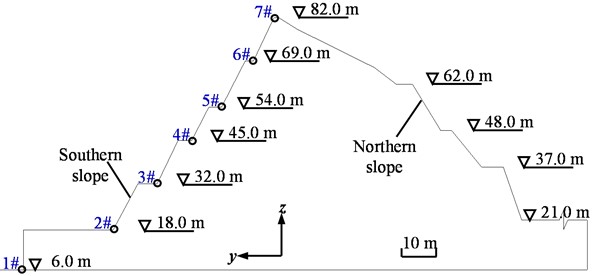
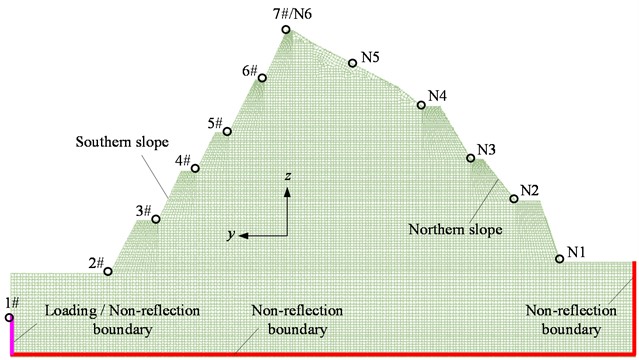
The Chiwan Mountain slope is next to the north of Chiwan parking lot, located in Shenzhen city, Guangdong Province, China, as shown in Fig. 1. The slope shaped by mountain cutting for sea filling is double-faced. It extends about 200.0 m along the southwest-northeast direction and its height is about 60.0 m. The top width and toe width of the slope are 1.5 m and 72.0-150.0 m, respectively, both of which are relatively narrow. Fig. 2 shows the typical cross section of the slope. The southern slope with an average gradient of approximately 61° consists of 5 stacked benches whose widths are 2.0-4.0 m, and the northern slope with varying gradients consists of 2-4 stacked benches.
Fig. 1Top view of case slope belonging to Chiwan Mountain
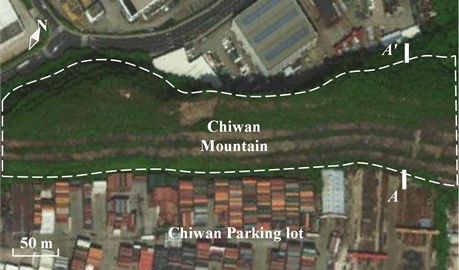
Fig. 2Cross section of case slope (A-A')
The bedrocks in the slope area are composed of blocky coarse-grained granite with different degrees of weathering. The intensively weathered granite is only observed in local areas on the top of the slope, and the moderately and slightly weathered granite outcrop in the other areas of the slope. There are no faults in the studied area, but there are joints with steep dips at the top of the slope. The physical and mechanical parameters of the bedrocks were determined based on laboratory tests and are listed in Table 1.
Table 1Physical and mechanical parameters of granite
Parameter | Intensively weathered | Moderately weathered | Slightly weathered | Unit |
Mass density | 2 250 | 2 500 | 2 610 | kg/m3 |
Young’s modulus | 0.4 | 2.0 | 15.0 | GPa |
Poisson’s ratio | 0.28 | 0.26 | 0.24 | |
Cohesion | 200 | 500 | 2 000 | kPa |
Friction angle | 38.0 | 40.5 | 42.5 | ° |
3. Blasting vibration monitoring
3.1. Blasting practice
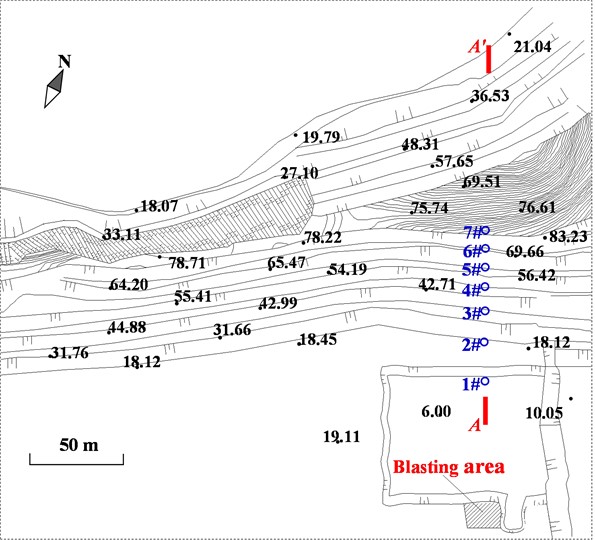
The Chiwan parking lot, an important part of Shenzhen Metro Line 12, is intended for parking metro vehicles. The foundation of the parking lot is designed to be at an elevation of approximately 6.0 m above the global mean sea level, and the original ground surface of the parking lot has a topography that ranges from 17.0 m to 20.0 m in elevation, as shown in Fig. 3. Therefore, large scale excavation works for foundation construction were carried out in the parking lot areas by drilling and blasting.
Fig. 3Location of blasting area and arrangement of monitoring points
Double-hole blasts were widely carried out for the foundation excavation of the parking lot. Blasting parameters and charging structures commonly adopted in the blasting practices were broadly similar. The detailed drilling and blasting parameters are summarized in Table 2, and the typical charging structure is presented in Fig. 4. Non-electric millisecond detonators MS3 and MS9 were used to set up different initiation networks fired in a zigzag sequence. Detonators MS3 were used between the delays including two vertical blastholes. Detonators MS9 were used for downhole delays. The typical initiation network for the blasting area shown in Fig. 3 (BA) is plotted in Fig. 5.
Table 2Drilling and blasting parameters
Blasthole | Charge | |||||
Diameter (mm) | Depth (m) | Spacing (m) | Burden (m) | Diameter (mm) | Stemming length (m) | Weight per blasthole (kg) |
115 | 11.0-13.5 | 4.0 | 3.5 | 90 | 3.5-4.0 | 55-64 |
3.2. Blasting vibration monitoring system
The vibration induced by the blasting practices for foundation construction of the parking lot might have adverse effects on the safety of the case slope, so the blasting vibration monitoring for the slope was conducted. The monitoring systems, composed of triaxial velocity transducers and intelligent monitors Blast-UM as shown in Fig. 6, were used in the blasting vibration monitoring programs. The monitoring range in vibration amplitude and frequency of the systems are 0.001-35.0 cm/s and 5-300 Hz respectively, which cover an overwhelming majority of blasting vibration recordings. The monitoring systems were arranged at the toe of the slope’s benches at different elevations, as shown in Fig. 2 and Fig. 3.
Fig. 4Typical charging structure
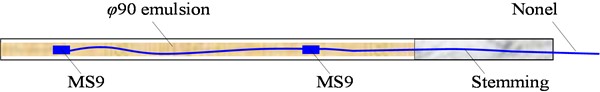
Fig. 5Typical initiation network for BA
Fig. 6Blasting vibration monitoring system. Photo was taken by the authors on the Chiwan Mountain slope (the case slope in the manuscript) when the blasting vibration monitoring was conducted
4. Monitoring result analysis
During the blasting practices, the blasting vibration of the slope was recorded through the monitoring systems several times. The obtained monitoring results show uniform characteristics of the blasting vibration. The typical monitoring results of the blasting vibration induced from the BA were analyzed in this study. The recorded blasting vibration waveforms of 1# monitoring point (as depicted in Fig. 2 and Fig. 3) corresponding to the BA are typically presented in Fig. 7.
4.1. Peak particle velocity
The peak particle velocities (PPVs) of all monitoring points are shown in Fig. 8. The maximum PPVs in longitudinal, transverse, and vertical directions are 1.65 cm/s, 0.70 cm/s, and 0.87 cm/s, respectively. The minimum PPVs in longitudinal, transverse, and vertical directions are 0.23 cm/s, 0.16 cm/s, and 0.20 cm/s, respectively, and all of them occur at 3# monitoring point. Among PPVs in the three directions, the longitudinal PPVs are the largest, and the transverse and vertical PPVs are close. Meanwhile, PPVs in all directions first decrease and then increase with increasing elevation of monitoring points on the southern slope, indicating that the common attenuation law of blasting vibration works for the region within 1# – 3# monitoring point range, while the elevation amplification effect of blasting vibration occur from 3# monitoring point. The remarkable elevation amplification effect of the blasting vibration is observed from 4# monitoring point.
Fig. 7Typical blasting vibration waveforms of 1# monitoring point
Fig. 8PPVs of different monitoring points on the southern slope
4.2. Time-frequency characteristics
The wavelet transform was adopted to get insight into the time-frequency characteristics of the recorded blasting vibration. Based on the principle of wavelet transformation [31, 32], for a given function , where is a signal space with limited energy, its Fourier transform can be written as . When satisfies the following condition:
The continuous wavelet transform (CWT) for any function is as follows:
The continuous wavelet inverse transform is , where a and b are the scaling factor and translation factor, respectively, and is the conjugate function of .
Since the recorded blasting vibration waveforms are discrete data composed of a series of time sampling points, the parameters a and b need to be discretized. All data and parameters need to be divided by a binary grid (for example, , , ) to obtain the binary wavelet transform in the following formula:
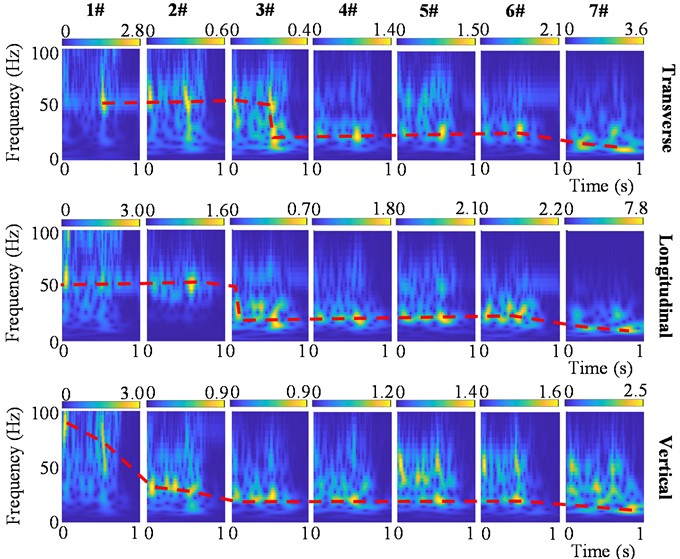
The CWT time-frequency spectra of all monitoring points are shown in Fig. 9. The red dotted lines in Fig. 9 depict the trends in dominant frequencies of the blasting vibration. On the whole, the dominant frequencies tend to decay with the increase in elevation. From 1# to 3# monitoring point, the dominant frequencies are reduced from above 50 Hz to around 35 Hz. From 4# to 7# monitoring point, the dominant frequencies remain largely the same at about 30 Hz. In particular, part of the dominant frequencies of 7# monitoring point is within 20 Hz which occurs at the end of the waveform, and part of the dominant frequencies of 5# to 7# monitoring points in the vertical direction are beyond 50 Hz.
4.3. Energy-frequency characteristics
The wavelet packet transform (WPT) was adopted to get insight into the energy-frequency characteristics of the recorded blasting vibration. Based on the principle of WPT [33]. The WPT reconstruction algorithm can be indicated as the following equation:
where is the coefficient of WPT, and are the low-pass and high-pass filter coefficients, respectively. The filter coefficients and in orthogonal multi-resolution analysis shall satisfy the below equation:
Then, Eq. (4) can be reconstructed as . The wavelet packet coefficients can be calculated by definition as , where and are standard orthogonal bases in the wavelet packet spaces and , respectively. The wavelet packet spaces and are mutually orthogonal, that is, mutually orthogonal and exist. As a result, and thus .
Then, the relationship between decomposition coefficients at level and level are shown as Eq. (6):
where and can be regarded as standard orthogonal bases of , in the frequency domain, respectively. Therefore, the results of and transformation do not change the modular value, that is, one can write:
Fig. 9CWT time-frequency spectra in three directions for different monitoring points
The signal in Hilbert space can be indicated as:
where is the projection of the signal in the wavelet packet space , is the scale parameter (i.e., decomposition level of wavelet packet), is the th wavelet subspace of decomposing wavelet packet to level , and is displacement parameter, and is the signal discretization sampling point.
The proportion of the energy of the frequency band corresponding to in the wavelet packet space accounting for that of the signal is :
where is the frequency band energy corresponding to in the wavelet packet space and is the overall energy of the signal.
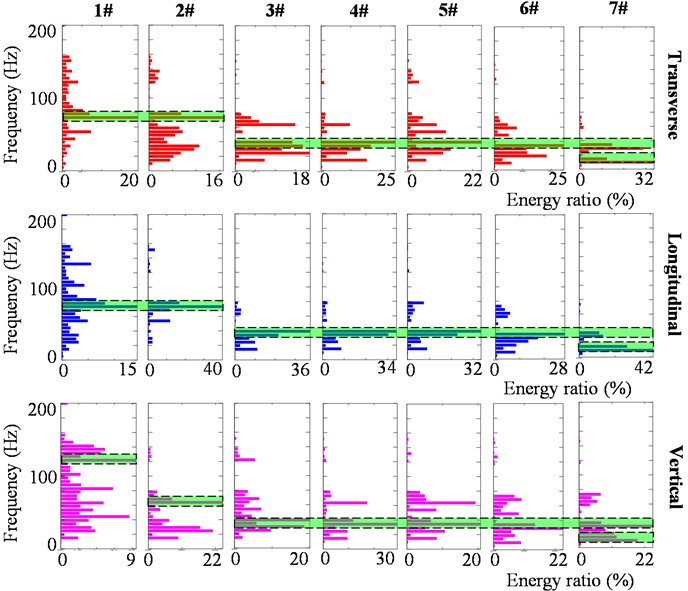
The energy-frequency distributions in three directions for different monitoring points are presented in Fig. 10. The cyan boxes in Fig. 10 depict the trends in dominant frequency bands, in which the blasting vibration energy ratio is overwhelming.
On the whole, the dominant frequency bands tend to decay with the increase in elevation. From 1# to 3# monitoring point, the dominant frequency bands, in which the energy rations are more than 25%, are reduced from above 60-80 Hz to around 35 Hz. From 4# to 7# monitoring point, the dominant frequency bands, in which the energy rations are more than 30 %, remain largely the same within 20-40 Hz. In particular, part of the dominant frequency bands of 7# monitoring point is within 20 Hz, in which the energy rations are above 30 %. The above results are consistent with those presented in Fig. 9, but the difference is that the energy ratios within the dominant frequencies beyond 50 Hz of 5# to 7# monitoring points in the vertical direction are relatively lower, among which energy ratios in single frequency band are mostly less than 10 %.
Fig. 10Energy-frequency distribution in three directions for different monitoring points
5. Numerical model and verification
5.1. Model and parameters
To further reveal the dynamic response characteristics of the thin and high rock slope under blasting vibration, a numerical study was implemented. As shown in Fig. 11, a numerical model including the whole slope was developed in the software LS-DYNA. The model is meshed with hexahedron-shaped brick elements, SOLID 164 elements, and each SOLID 164 element has 8 nodes. Kuhlemeyer and Lysmer [34] suggested the mesh size should be shorter than 1/8 – 1/10 of the wave length to properly reduce any wave distortion. According to this requirement, the element size adopted in the model varies from 0.1 m near the slope surface to 1.0 m inside the slope. There are a total of 15854 SOLID 164 elements and 32362 nodes contained in the model. Non-reflecting boundaries are enforced to the northern face, bottom face, and southern face below 1# monitoring point to eliminate the wave-reflecting effect. The southern face below 1# monitoring point is also the loading boundary that is enforced to the modified longitudinal and vertical velocities of 1# monitoring point (as shown in Fig. 7). Apart from seven monitoring points on the southern slope, the other six monitoring points on the northern slope are added to analyze the dynamic response characteristics of the northern slope.
Fig. 11Numerical model of case slope
The maximum PPV of the recorded blasting vibration is less than 1.7 cm/s, which is far less than the safety control standards for the rock slope [35], and the distance from the blasting source to the toe of the slope exceeds 100 m. Therefore, the blasting vibration of the slope can be approximately regarded as elastic vibration, and the linear elastic materials were adopted in the numerical model. The lithology for the case slope is mainly composed of slightly weathered granite, so the material parameters of rock masses were assigned the parameters of the slightly weathered granite listed in Table 1.
5.2. Model verification
The numerical results of blasting vibration were obtained when the loading boundary is enforced to the longitudinal and vertical velocities of 1# monitoring point. The numerical and monitoring results of blasting vibration for 1# to 7# monitoring points are listed in Table 3. There are small differences mostly within 10 % between the numerical and monitoring results. The deviations between monitoring and numerical results of vertical PPVs at 5# and 7# monitoring points are slightly above 10 %, but the absolute errors are 0.05 cm/s and 0.09 cm/s, which are quite small and can be ignored. The evolution laws of PPVs along with the elevation are kept the same for the numerical and monitoring results, both of which are that PPVs firstly decrease and then increase with increasing elevation. As a result, the numerical model can effectively simulate the blasting vibration response of the case slope to a certain extent.
Table 3Comparison between monitoring and numerical results of blasting vibration
Monitoring point | 1# | 2# | 3# | 4# | 5# | 6# | 7# | |
Horizontal PPV (cm/s) | Monitoring result | 1.19 | 0.29 | 0.23 | 0.38 | 0.53 | 0.82 | 1.65 |
Numerical result | 1.19 | 0.31 | 0.21 | 0.34 | 0.56 | 0.74 | 1.54 | |
Deviation (%) | 0.0 | 6.9 | 8.7 | 10.5 | 5.7 | 9.8 | 6.7 | |
Vertical PPV (cm/s) | Monitoring result | 0.87 | 0.23 | 0.20 | 0.29 | 0.41 | 0.53 | 0.63 |
Numerical result | 0.85 | 0.24 | 0.20 | 0.31 | 0.36 | 0.50 | 0.72 | |
Deviation (%) | 2.3 | 4.3 | 0.0 | 6.9 | 12.2 | 5.7 | 14.3 | |
6. Numerical study on dynamic response of case slope
6.1. Natural frequencies
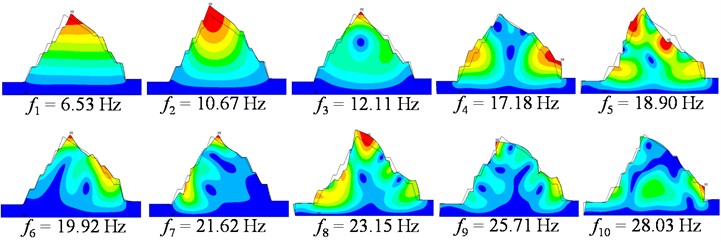
Natural frequencies play an important role in the dynamic performance evaluation of structures [36-38]. Fig. 12 presents the first 10 natural frequencies and corresponding mode shapes of the whole slope, which were calculated through modal analysis in LS-DYNA. Higher modes of the modal parameters are not given here because they make nearly no contribution to the slope motion according to the theory of structural dynamics [39]. The fundamental frequency of the whole slope is 6.53 Hz corresponding to the first mode shape representing the overall horizontal motion. The second to sixth natural frequencies less than 20 Hz are all below the dominant frequencies in Fig. 9 or dominant frequency bands in Fig. 10. The second mode shape of the whole slope is characterized as overall vertical motion, while the third to sixth mode shapes are characterized as local motions of the whole slope. The seventh to tenth natural frequencies are within 20-30 Hz, and their corresponding mode shapes are also characterized as local motions of the whole slope.
Fig. 12First 10 modal parameters of the whole slope
Considering the elevation amplification effect of blasting vibration exits from 4# monitoring point and dominant frequencies for 4# to 7# monitoring points remain largely the same, the first 10 natural frequencies and mode shapes of the slope above 4# monitoring point (the upper slope) were extracted, as presented in Fig. 13. The mode shapes of the upper slope are nearly the same as those of the whole slope, while their natural frequencies are rather different. The fundamental frequency of the upper slope is 13.51 Hz, which is within the dominant frequency band below 20 Hz of 7# monitoring point. The second to sixth natural frequencies are within 20-40 Hz, which fall into the unchanged dominant frequencies of 4# to 7# monitoring points. The seventh to tenth natural frequencies are within 40-60 Hz, which lie in the part of dominant frequencies beyond 50 Hz of 5# to 7# monitoring points. The close correspondence between the natural frequencies and dominant frequency characteristics of the upper slope indicates that the natural frequencies play a key role in the dynamic response of the slope.
Fig. 13First 10 modal parameters of the slope above monitoring point 4#
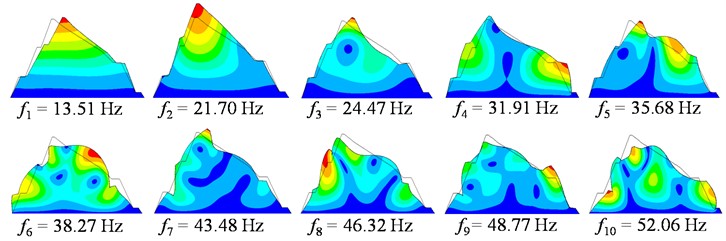
Fig. 14PPV distribution under vibration with different frequency characteristics
a) 0-20 Hz
b) 20-40 Hz
c) 40-60 Hz
d) 60-100 Hz
e) 100-150 Hz
6.2. Effects of vibration frequency on dynamic response of slope
To investigate the relationship between blasting vibration frequency characteristics and natural frequencies of the slope, five numerical cases corresponding to five loading conditions were carried out. Each loading condition corresponds to a set of modified blasting vibration waveforms with a specific frequency band, and the five different frequency bands are 0-20 Hz, 20-40 Hz, 40-60 Hz, 60-100 Hz, and 100-150 Hz, respectively, which are selected based on the frequency distribution characteristics and cover the dominating frequency components of the blasting vibration on the case slope. The modified blasting vibration waveform can be obtained as:
where is the original blasting vibration waveform of the 1# monitoring point, and can be got through bandpass filtering ranging from low frequency to high frequency of .
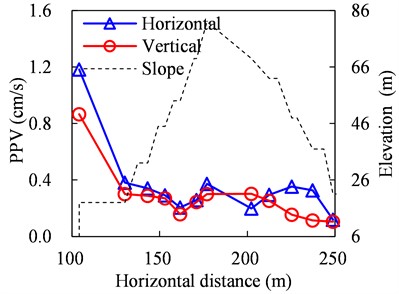
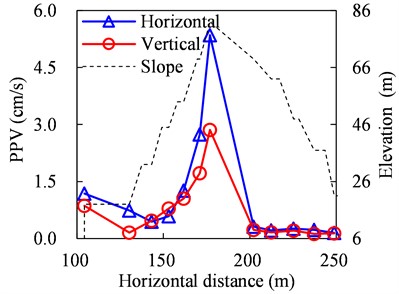
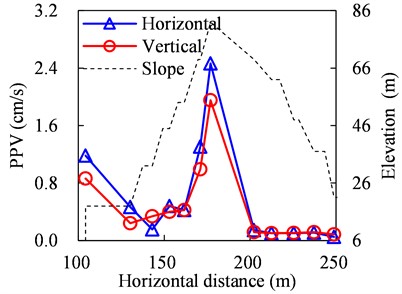
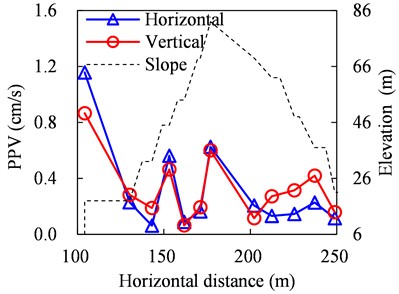
PPV distributions of the slope under five different vibration loading conditions are presented in Fig. 14.
As presented in Fig. 14(a), PPVs decline in a fluctuation way with the increase of horizontal distance from the blasting source when the frequency range of the loading vibration is within 0-20 Hz, and PPVs of monitoring points are less than 0.4 cm/s except those of 1# monitoring point.
When the frequency ranges of the loading vibration are within 20-40 Hz and 40-60 Hz, PPVs decline firstly and then increase on the southern slope with the increase of horizontal distance from the blasting source, while PPVs on the northern slope fluctuate and are less than 0.25 cm/s, as presented in Fig. 14(b) and Fig. 14(c). The elevation amplification effect exits from 4# monitoring point for both the two conditions shown in Fig. 14(b) and Fig. 14(c), which matches the monitoring results, and the elevation amplification effect for the case of 20-40 Hz is more apparent.
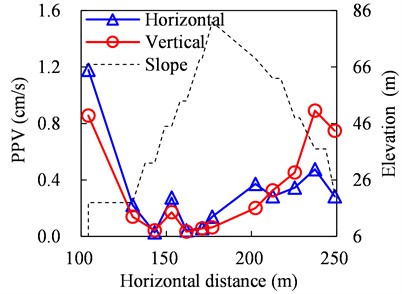
For the case of 60-100 Hz presented in Fig. 14(d), PPVs also decline in a fluctuation way as in the case in Fig. 14(a), while the PPVs for the 4# and 7# monitoring points are beyond 0.4 cm/s, which are larger than the PPVs of their adjacent monitoring points.
For the last case of 100-150 Hz presented in Fig. 14(e), PPVs decline in a fluctuation way on the southern slope while increase on the northern slope with the increase of horizontal distance from the blasting source, and the maximum PPV on the northern slope exceeds 0.8 cm/s.
6.3. Effects of vibration amplitude on dynamic response of slope
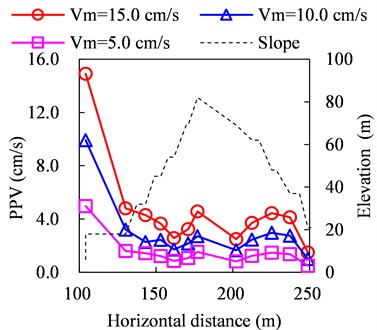
The effects of vibration amplitude on the dynamics response of the slope were also investigated, and three numerical cases corresponding to each specific loading condition within a certain frequency range were conducted. The three cases are = 5.0 cm/s, 10.0 cm/s, and 15.0 cm/s. For blasting vibration with the frequency range within 0-20 Hz, Fig. 15 gives the typical PPV distributions of the slope under vibration with different amplitudes.
Fig. 15PPV distribution under vibration with different amplitudes (0-20 Hz)
a) Horizontal
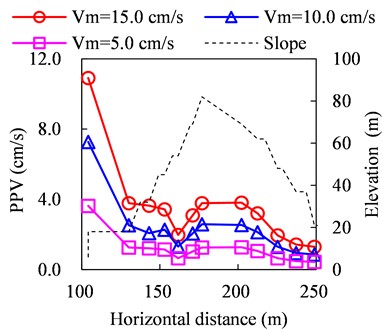
b) Vertical
The applied vibration amplitudes have significant importance on the values of PPVs but no effects on the distribution of PPVs, and the values of PPVs are approximately proportional to the applied vibration amplitudes. For example, the horizontal PPVs at 2# monitoring point under 5.0 cm/s, 10.0 cm/s, and 15.0 cm/s are about 1.5 cm/s, 3.0 cm/s, and 4.5 cm/s, indicating that the PPV is approximately proportional to the applied vibration amplitude. As for blasting vibration with other frequency ranges, the effects of vibration amplitude are kept the same.
7. Discussions
As regards the blasting practices close to the case slope, blasting seismic waves propagate from the near to the distant. The blasting seismic waves propagate from the toe to the top of the southern slope, while propagating from the top to the toe of the northern slope. Due to energy dissipation and dispersion effects during the seismic wave propagation [40], both the amplitude and dominant frequencies of blasting vibration are gradually attenuated from the near to the distant, which accounts for the PPV decay from 1# to 3# monitoring point and the overall dominant frequency decay from 1# to 7# monitoring point. However, it’s difficult to directly use the theory of seismic wave propagation to explain the elevation amplification effect from 4# monitoring point, the unchanged dominant frequencies for 4# to 7# monitoring points, and numerical results about the effects of applied vibration frequency on dynamic response characteristics of the slope.
From the perspective of structural dynamics taking account into the effects of natural frequencies of the slope, the elevation amplification effect, the unchanged dominant frequencies, and the effects of applied vibration frequency can be reasonably explained. The dominant frequencies of the 1# monitoring point are beyond 50 Hz, which are larger than the primary natural frequencies of the whole slope, so the blasting seismic waves do not cause resonance of the whole slope. When the blasting seismic waves spread to the areas between 3# and 4# monitoring points, the dominant frequencies decay to 20-40 Hz that fall within the primary natural frequencies of the upper slope, and thus resonance of the upper slope within 20-40 Hz are excited, which leads to the elevation amplification effect from 4# monitoring point and unchanged dominant frequencies for 4# to 7# monitoring points.
To sum up, the dynamic response of the case slope under blasting vibration results from the joint effects of blasting seismic wave propagation and structural resonance. The blasting seismic wave propagation leads to amplitude and frequency attenuation and structural resonance causes the amplification effect while the dominant frequencies of spreading seismic waves are adjacent to the natural frequencies of the slope after the amplitude and frequency attenuation. It’s important to note that the dynamic response of the slope under blasting vibration is a complex problem concerning wave propagation and structural dynamics, and so on. More discussions and studies about the dynamic response of the slope under blasting vibration are needed.
8. Conclusions
Based on the field monitoring results and numerical results of blasting vibration on the high and thin case slope, the main conclusions were drawn as follows:
1) The blasting vibration on the case slope first decreases and then increases with increasing elevation, and the elevation amplification effect of blasting vibration exits on the southern slope from a certain elevation. The dominant frequencies generally decay with the distance from the blasting source but remain largely the same within a specific elevation range, and the unchanged dominant frequencies of 20-40 Hz fall within the primary natural frequencies of the upper slope.
2) The loading vibration frequencies have significant importance on both the values and distributions of PPVs on the slope while the loading vibration amplitudes just have an impact on the values of PPVs.
3) The dynamic response of the case slope under blasting vibration results from the joint effects of blasting seismic wave propagation and structural resonance. The blasting seismic wave propagation leads to amplitude and frequency attenuation and the structural resonance causes the amplification effect while the dominant frequencies of spreading seismic waves are adjacent to the natural frequencies of the slope.
The dynamic response of high and thin rock slope under blasting vibration is very complicated, and the work presented in this paper is just a preliminary study. The adopted numerical model is an idealized model that cannot completely represent all the characteristics of the real case slope. Therefore, more detailed models such as three-dimensional models accounting for discontinuities may be established in further study.
References
-
P. Sun, W. Qin, M. Chen, and W. Lu, “Influence of blasting in deep excavations on anchored pile supporting structures and its mechanism,” (in Chinese), Journal of Vibration and Shock, Vol. 40, pp. 144–150, 2021, https://doi.org/10.13465/j.cnki.jvs.2021.22.020
-
P. Yan, Y. Zou, J. Zhou, W. Lu, Y. Zhang, and L. Liu, “Assessment of seismic impact on residences during blasting excavation of a large-scale rock slope in China,” Environmental Earth Sciences, Vol. 75, No. 11, pp. 1–15, Jun. 2016, https://doi.org/10.1007/s12665-016-5747-6
-
R. Huang, “Main characteristics of high rock slopes in southwestern China and their dynamic evolution,” (in Chinese), Advances in Earth Science, Vol. 20, pp. 292–297, 2005, https://doi.org/10.3321/j.issn:1001-8166.200503.005
-
Z. Leng, Y. Fan, Q. Gao, and Y. Hu, “Evaluation and optimization of blasting approaches to reducing oversize boulders and toes in open-pit mine,” International Journal of Mining Science and Technology, Vol. 30, No. 3, pp. 373–380, May 2020, https://doi.org/10.1016/j.ijmst.2020.03.010
-
P. Sun, W. Lu, J. Zhou, X. Huang, M. Chen, and Q. Li, “Comparison of dominant frequency attenuation of blasting vibration for different charge structures,” Journal of Rock Mechanics and Geotechnical Engineering, Vol. 14, No. 2, pp. 448–459, Apr. 2022, https://doi.org/10.1016/j.jrmge.2021.07.002
-
D. Shu, X. Li, X. Zhan, L. Nong, and Q. Jiang, “Observation and analysis of blasting vibration on the right bank’s high slope of Longtan hydropower project,” (in Chinese), Blasting, Vol. 19, pp. 65–67, 2002, https://doi.org/10.3963/j.issn.1001-487x.2002.04.026
-
D. Shu, S. Lai, C. Zhu, and W. Lu, “Analysis of explosive vibration effect in rock high slope blasting,” (in Chinese), Blasting, Vol. 17, pp. 245–248, 2000.
-
M. Chen, W. Lu, P. Li, M. Liu, C. Zhou, and G. Zhao, “Elevation amplification effect of blasting vibration velocity in rock slope,” (in Chinese), Chinese Journal of Rock Mechanics and Engineering, Vol. 30, pp. 2189–2195, 2011.
-
B. Fu, Y. Hu, W. Lu, M. Chen, and P. Yan, “Local amplification effect of blasting vibration in high rock slope,” (in Chinese), Blasting, Vol. 31, pp. 1–7, 2014, https://doi.org/10.3963/j.issn.1001-487x.2014.02.001
-
X. Wu, Y. Zhang, and Q. Guo, “Amplification and attenuation effect of blasting vibration on step topography,” (in Chinese), Explosion and Shock Waves, Vol. 37, pp. 1017–100, 2017, https://doi.org/10.11883/1001-1455(2017)06-1017-06
-
F. Yang, H. Li, Y. Liu, X. Xiang, Y. Hao, and L. Niu, “Monitoring of blasting vibration and numerical simulation of slope in Taishan nuclear power station,” (in Chinese), Rock and Soil Mechanics, Vol. 32, pp. 628–633, 2011, https://doi.org/10.16285/j.rsm.2011.s2.043
-
N. Jiang, C. Zhou, S. Lu, and Z. Zhang, “Propagation and prediction of blasting vibration on slope in an open pit during underground mining,” Tunnelling and Underground Space Technology, Vol. 70, pp. 409–421, Nov. 2017, https://doi.org/10.1016/j.tust.2017.09.005
-
N. Jiang, C. Zhou, W. Ping, X. Xu, and S. Lu, “Altitude effect of blasting vibration velocity in rock slopes,” (in Chinese), Journal of Central South University (Science and Technology), Vol. 45, pp. 237–243, 2014.
-
G.-M. Song, X.-Z. Shi, Z.-G. Zhou, S.-R. Chen, and Q.-H. Xiao, “Monitoring and assessing method for blasting vibration on open-pit slope in Hainan iron mine,” Journal of Central South University of Technology, Vol. 7, No. 2, pp. 72–74, Jun. 2000, https://doi.org/10.1007/s11771-000-0035-7
-
A. Kahriman, “Analysis of parameters of ground vibration produced from bench blasting at a limestone quarry,” Soil Dynamics and Earthquake Engineering, Vol. 24, No. 11, pp. 887–892, Dec. 2004, https://doi.org/10.1016/j.soildyn.2004.06.018
-
H. Ak, M. Iphar, M. Yavuz, and A. Konuk, “Evaluation of ground vibration effect of blasting operations in a magnesite mine,” Soil Dynamics and Earthquake Engineering, Vol. 29, No. 4, pp. 669–676, Apr. 2009, https://doi.org/10.1016/j.soildyn.2008.07.003
-
B.-H. Choi, C.-H. Ryu, D. Deb, Y.-B. Jung, and J.-H. Jeong, “Case study of establishing a safe blasting criterion for the pit slopes of an open-pit coal mine,” International Journal of Rock Mechanics and Mining Sciences, Vol. 57, pp. 1–10, Jan. 2013, https://doi.org/10.1016/j.ijrmms.2012.07.014
-
D. Deb, K. N. R. Kaushik, B. H. Choi, C. H. Ryu, Y. B. Jung, and C. Sunwoo, “Stability assessment of a pit slope under blast loading: a case study of Pasir coal mine,” Geotechnical and Geological Engineering, Vol. 29, No. 4, pp. 419–429, Jul. 2011, https://doi.org/10.1007/s10706-010-9387-4
-
S. Zhang et al., “Dynamic response characteristics of a rock slope under blasting excavation,” Bulletin of Engineering Geology and the Environment, Vol. 80, No. 11, pp. 8453–8464, Nov. 2021, https://doi.org/10.1007/s10064-021-02442-9
-
Y. Li, P. Sun, J. Luo, M. Chen, F. Li, and P. Nie, “Research on blasting vibration control during rock excavation of Chiwan metro parking lot, Shenzhen,” (in Chinese), Blasting, Vol. 37, pp. 63–67, 2020, https://doi.org/10.3963/j.issn.1001-487x.2020.03.010
-
Q. Wu, J. Zhang, X. Cao, and Y. Chen, “Test and study of lamination effect caused by blasting of cutting slope in layered rock masses,” (in Chinese), China Railway Science, Vol. 25, pp. 50–54, 2004, https://doi.org/10.3321/j.issn:1001-4632.2004.03.011
-
L. Zhang, W. Lu, J. Zhou, Y. Hu, M. Chen, and P. Yan, “Dynamic response and local failure mechanism of division pier under blasting impact load,” (in Chinese), Rock and Soil Mechanics, Vol. 35, pp. 520–527, 2014, https://doi.org/10.16285/j.rsm.2014.s2.063
-
Y. Hu, W. Lu, L. Zhang, and P. Yan, “Dynamic response and control of middle rock sidewall under impact of blast loading,” Journal of Vibration and Control, Vol. 25, No. 9, pp. 1572–1584, May 2019, https://doi.org/10.1177/1077546319829566
-
H. Tang, H. B. Li, P. C. Jiang, X. Y. Xiao, and J. R. Li, “Experimental study on effect of topography on propagation of blasting waves,” (in Chinese), Chinese Journal of Rock Mechanics and Engineering, Vol. 26, pp. 1817–1823, 2007, https://doi.org/10.3321/j.issn:1000-6915.2007.09.012
-
H. Tang and J. Li, “Numerical simulation of influence of protruding topography on blasting vibration wave propagation,” (in Chinese), Rock and Soil Mechanics, Vol. 31, pp. 1289–1294, 2010, https://doi.org/10.3969/j.issn.1000-7598.2010.04.049
-
J. W. Dally and D. Lewis, “A photoelastic analysis of propagation of Rayleigh waves past a step change in elevation,” Bulletin of the Seismological Society of America, Vol. 58, No. 2, pp. 539–563, Apr. 1968, https://doi.org/10.1785/bssa0580020539
-
S. Sklavounos and F. Rigas, “Computer simulation of shock waves transmission in obstructed terrains,” Journal of Loss Prevention in the Process Industries, Vol. 17, No. 6, pp. 407–417, Nov. 2004, https://doi.org/10.1016/j.jlp.2004.07.005
-
M. Fuyuki and M. Nakano, “Finite difference analysis of Rayleigh wave transmission past an upward step change,” Bulletin of the Seismological Society of America, Vol. 74, No. 3, pp. 893–911, Jun. 1984, https://doi.org/10.1785/bssa0740030893
-
D.-W. Zhong and L. Wu, “Model test and numerical simulation for dynamic characteristics of rock slope under blasting loads,” (in Chinese), Proceedings of the 10th Asia-Pacific Conference, Vol. 29, pp. 2964–2971, May 2011, https://doi.org/10.1142/9789814324052_0081
-
P. Sun, W. Lu, Z. Lei, M. Chen, R. Li, and F. Li, “Blasting vibration response and control of high rock slopes of thin mountain,” (in Chinese), Chinese Journal of Geotechnical Engineering, Vol. 43, pp. 877–885, 2021, https://doi.org/10.11779/cjge202105011
-
S. Zhang, W. Gao, L. Yan, J. Liu, and L. Liu, “The characteristics of blasting vibration frequency bands in jointed rock mass slope,” Environmental Earth Sciences, Vol. 79, No. 23, pp. 1–17, Dec. 2020, https://doi.org/10.1007/s12665-020-09267-x
-
D. Huang, S. Cui, and X. Li, “Wavelet packet analysis of blasting vibration signal of mountain tunnel,” Soil Dynamics and Earthquake Engineering, Vol. 117, pp. 72–80, Feb. 2019, https://doi.org/10.1016/j.soildyn.2018.11.025
-
G. Chen, Q.-Y. Li, D.-Q. Li, Z.-Y. Wu, and Y. Liu, “Main frequency band of blast vibration signal based on wavelet packet transform,” Applied Mathematical Modelling, Vol. 74, pp. 569–585, Oct. 2019, https://doi.org/10.1016/j.apm.2019.05.005
-
R. L. Kuhlemeyer and J. Lysmer, “Finite element method accuracy for wave propagation problems,” Journal of the Soil Mechanics and Foundations Division, Vol. 99, No. 5, pp. 421–427, May 1973, https://doi.org/10.1061/jsfeaq.0001885
-
T. N. S. C. China, “Safety regulations for blasting,” GB 6722-2014 Beijing, 2015.
-
Y.-L. Lin and G.-L. Yang, “Dynamic behavior of railway embankment slope subjected to seismic excitation,” Natural Hazards, Vol. 69, No. 1, pp. 219–235, Oct. 2013, https://doi.org/10.1007/s11069-013-0701-3
-
D. Song, A. Che, R. Zhu, and X. Ge, “Natural frequency characteristics of rock masses containing a complex geological structure and their effects on the dynamic stability of slopes,” Rock Mechanics and Rock Engineering, Vol. 52, No. 11, pp. 4457–4473, Nov. 2019, https://doi.org/10.1007/s00603-019-01885-7
-
D. J. Miller, D. D. Vachon, and M. C. Aalsma, “Negative affect and emotion dysregulation,” Criminal Justice and Behavior, Vol. 39, No. 10, pp. 1316–1327, Oct. 2012, https://doi.org/10.1177/0093854812448784
-
A. K. Chopra, Dynamics of Structures: Theory and Applications to Earthquake Engineering. New Jersey: Prentice Hall, 2012.
-
Z. X. Zhang, Rock Fracture and Blasting: Theory and Applications. Oxford: Butterworth-Heinemann, 2016.
Cited by
About this article

This work was supported by the Major Project of China Academy of Railway Sciences Corporation Limited (No. 2021YJ066 and No. 2022YJ087), the Youth Talent Lift Project of Beijing Association for Science and Technology (No. BYESS2022219), and the Open Fund of Changjiang River Scientific Research Institute (No. CKWV20221012/KY).
The datasets generated during and/or analyzed during the current study are available from the corresponding author on reasonable request.
Conceptualization, Pengchang Sun; Data Curation, Pengchang Sun and Ruize Li; Formal Analysis, Pengchang Sun and Ruize Li; Funding Acquisition, Pengchang Sun; Investigation, Pengchang Sun; Methodology; Pengchang Sun and Ruize Li; Project Administration, Ruize Li; Software, Pengchang Sun; Validation, Pengchang Sun and Ruize Li; Visualization, Pengchang Sun; Writing, Pengchang Sun and Ruize Li.
The authors declare that they have no conflict of interest.
