Abstract
The excavation of large-span triple tunnels using drilling and blasting method inevitably causes complicated load transfer effects and induces potentially damaging ground vibrations. In this study, the structural responses (including the surrounding rock pressure, normal-contact pressure between the primary and secondary linings, internal forces in the secondary lining) and the seismic responses (including peak particle velocity and corner frequency), are systematically recorded. It is found that the first-excavated left tunnel is influenced heavily by the excavation of the last-excavated middle tunnel, whereas it is hardly affected by the excavation of the second-excavated right tunnel. The load carried by the primary lining is approximately three times as that carried by the secondary lining. The middle tunnel was in the least desirable state due to the formation of the large Protodyakonov’s equilibrium arch (PEA). Based on timely feedback of the comprehensive monitoring system, a series of vibration-reducing techniques were applied and effectively guaranteed safety during blasting construction. By referring to Chinese codes, the minimum safety factor of the secondary lining is 1.3; the maximum PPV (0.15 cm/s) is lower than the allowable value; and the corner frequency (40-140 Hz) will not cause resonant vibration of the Great Wall.
Highlights
- The structural responses and the seismic responses of triple tunnels have been systematically recorded.
- The safety of the middle tunnel was the most unfavorable.
- The maximum peak particle velocity (0.15 cm/s) was lower than the allowable values.
- The corner frequency (40–140 Hz) would not cause resonant vibration in the Great Wall.
1. Introduction
Closely spaced twin tunnels haven been widely adopted in Underground railways and road networks. Significant interactions during twin tunnel construction have been extensively investigated via on-site monitoring [1-5], laboratory model test [6, 7], numerical simulation [8, 9], and analytical analysis [10, 11]. Most of these studies primarily focused on the interactions of twin tunnels using the mechanized method. However, for mountain multiple tunnel excavations, the drilling and blasting method is most commonly used. When compared with the mechanized method, the main advantage of this method is its outstanding flexibility. It can be used for the excavation of noncircular tunnels and the enlargement of complex interchanges in various ground conditions.
When drilling and blasting method is applied in the construction of multiple tunnels or similar underground projects, in comparison with mechanized multiple tunnels, the load transfer characteristic is more complicated, and the stress waves resulting from the neighboring blasting construction inevitably lead to adverse interactions with existing tunnels. Ng conducted a series of three dimensional coupled finite element analyses to investigate the multiple interactions between twin hypothetical noncircular tunnels constructed using drilling and blasting method [12]. Nan Jiang analyzed the blast-induced effective stresses in the adjacent tunnel lining and proposed a feasible safety criterion according to maximum tensile strength theory [13]. Xinghua Li studied the unfavorable mechanical responses of operational subway induced by blasting construction of an adjacent tunnel and introduced a series of vibration-reducing measures [14]. The tunneling projects discussed above are mainly associated with small-span tunnels, whereas the structural responses of large-span multiple tunnels have been rarely reported.
Apart from the complicated mechanical interactions of multiple blast-excavated tunnels, the ground vibration induced by blasting construction also negatively impact the surface buildings. Hakan Ak conducted ground vibration measurement and optimized blasting parameters to prevent potential damages to nearby structures [15]. Nateghi Reza predicted the blast-induced ground vibration and established the relationship between peak particle velocity (PPV) and scaled distance [16]. Compared with conventional single tunnel blast construction, the potential risk of surface buildings caused by the blast-excavated tunnel group significantly increases; thus, comprehensive safety assessments of the seismic response are highly required.
This study reports a field case of large-span triple tunnels excavated using the drilling and blasting method. The structural responses, such as surrounding rock pressure, normal-contact pressure between the primary lining and secondary linings, and the internal forces in the secondary lining, were monitored. The key microseismic parameters, including corner frequency and PPV, were also observed at the mountain surface. The safety state of the triple tunnel system and surface buildings was evaluated by referring to the corresponding safety codes. Moreover, a series of optimization methods were proposed accordingly to minimize the undesirable blasting impacts on the support structure. It may provide a piratical reference for the future design and construction of similar underground blasting projects.
2. On-site monitoring project
2.1. Project view
The Badaling Great Wall Station, the key project of the new Badaling tunnel, is the deepest high-speed underground railway station in the world. The triple tunnels were excavated below the Badaling Great Wall scenic area; these tunnels serve as the platform of the station. The new Badaling tunnel was excavated below the Great Wall at DK67 + 025 and DK67 + 370. Therefore, the excavation of triple tunnels would inevitably cause a negative impact on the historical wall.
Fig. 1 depicts the typical engineering geology of the field project. The triple tunnels were excavated in the Jundushan Mountain area with severely developed gullies and significant land undulation. The overburden depth (from the tunnel crown to the ground surface) varies between 70 and 102 m. The triple tunnels pass through three major faults (F1, F2, and F3) and a large jointed zone. The F2 fault (most unfavorable fault) intersects the tunnel body at an angle of 35° from DK68 + 200 to DK68 + 300, and the strike and dip are 236° and 80°, respectively. F2 fault is a compression-torsion fracture, and the fault zone mainly includes crushed weak rock with relatively developed groundwater. The large jointed zone intersects the tunnel body from DK67 + 900 to DK68 + 000, and the strike and dip are 335° and 86°, respectively. The joints in the large jointed zone are considerably developed with a line density of 8-10 per meter, and most of them are closed joints, there is no filling in each joint. Generally, the surrounding rock mass primarily includes strongly weathered monzonitic granite with abundant joints. According to the Chinese basic quality (BQ) system, the surrounding rock is classified as grade III and V [17].
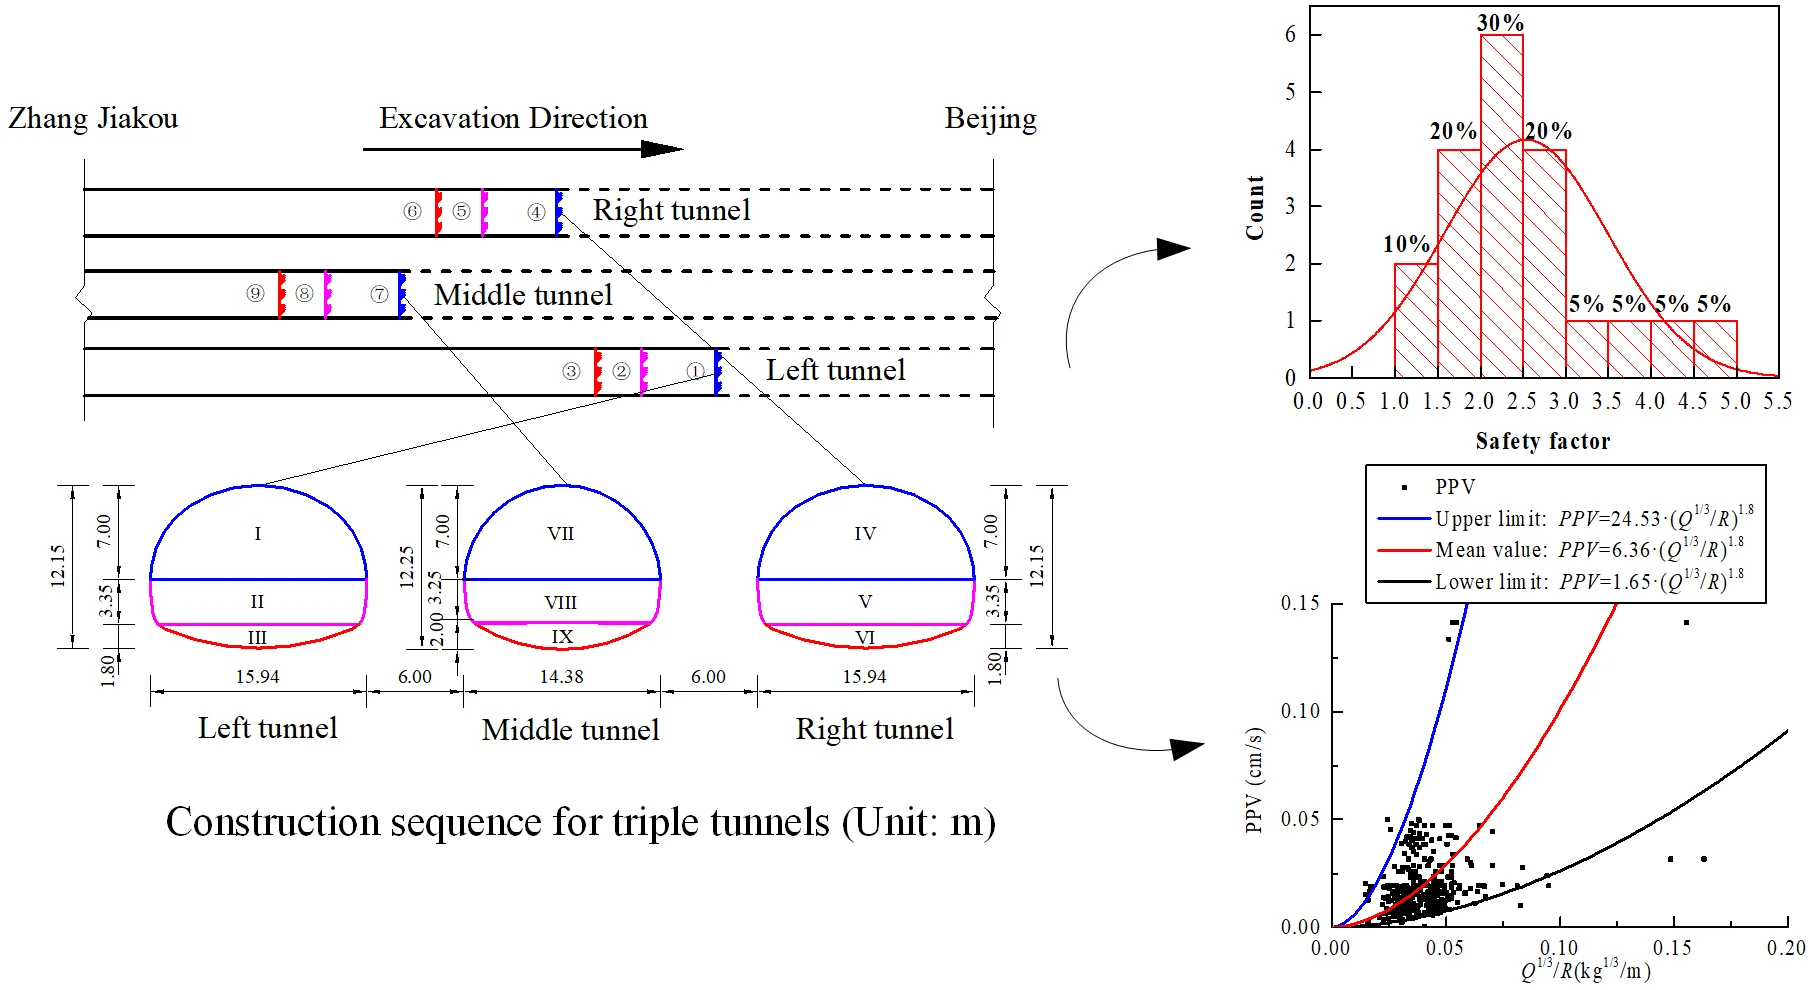
As shown in Fig. 2, the triple tunnel system comprises three independent parallel tunnels in close vicinity which are exactly symmetrical about the center line of the middle tunnel. The left and right tunnels, with a span of 15.94 m and a height of 12.15 m, are two arrival-departure-track tunnels. The middle tunnel, with a span of 14.38 m and a height of 12.24 m, is a standard double-track single-tube tunnel. For the trains parked at this station, they will stop in the left and right tunnels for passengers to transfer, while for other trains, they will pass directly through the middle tunnel. The rock pillar width is only 6 m or 0.38 D (D is the excavation span of both left and right tunnels). The primary lining comprises 300-mm-thick C30 shotcrete, steel beam with 4213-mm2 cross-sectional area, and 4.0-m-long system bolts. The secondary lining is reinforced cast-in-place concrete with a thickness of 400 mm and a 28-day compressive strength of 35 MPa. The 12-mm-thick composite waterproofing membrane is sandwiched between the secondary and primary linings.
Fig. 1Geological profile of triple tunnels
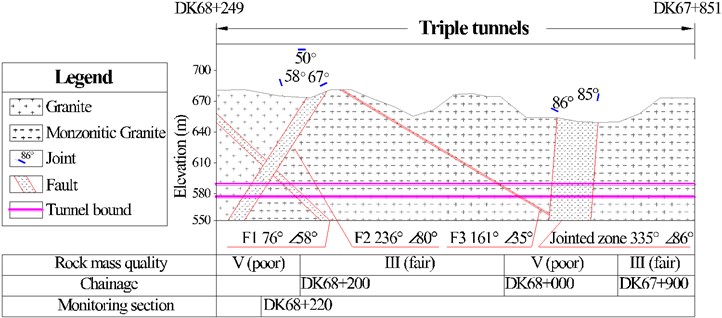
Fig. 2Triple tunnels system (Unit: m)
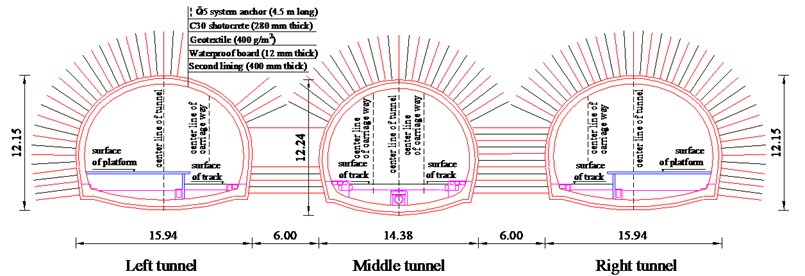
Fig. 3Construction sequence for triple tunnels (Unit: m)
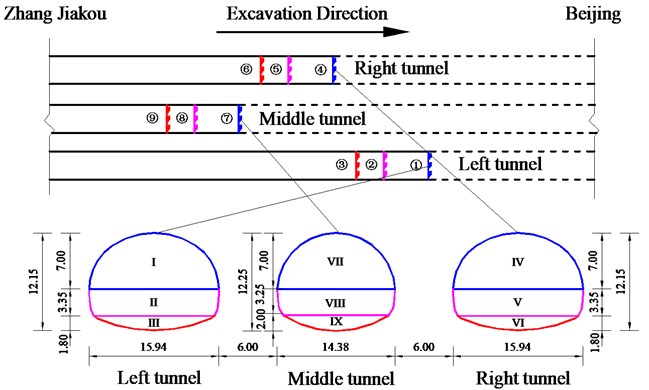
As shown in Fig. 3, the left tunnel was first excavated, followed by the right and middle tunnels. Each tunnel was divided into three parts: the top heading, bench, and invert. Thus, each section comprised nine construction stages in total.
The typical drilling and blasting method were adopted during construction. The standard excavation cycle was 2 m. The blasting holes of 42-mm diameter and 0.7-1.9-m depth (depending on the location of a hole) were drilled. Each explosive charge was set within 40-120 kg, mainly depending on rock mass quality and the excavation area. To effectively limit tunnel overbreak, smooth blasting technique was applied.
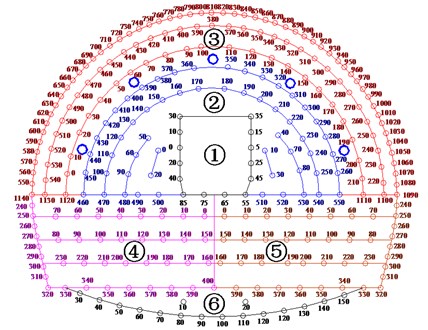
2.2. Monitoring layout
Real-time monitoring, a reliable and effective method for tunnel construction, has been widely applied because it directly reflects the stress path and deformation pattern of the tunnel in its field state. In this project, the surrounding rock pressure, normal-contact pressure between the primary lining and secondary lining, internal forces in the secondary lining, PPV, and corner frequency were systematically monitored. Section DK68 + 220 was selected as the experimental monitoring section because it was excavated at the earlier period of the triple tunnels and its complicated geological conditions. Fig. 4 shows the installation scheme for each tunnel. Note microseismic monitoring was performed at the ground surface. Table 1 lists the frequency of mechanical monitoring according to the Chinese codes [18].
Fig. 4Layout of monitoring points for each tunnel
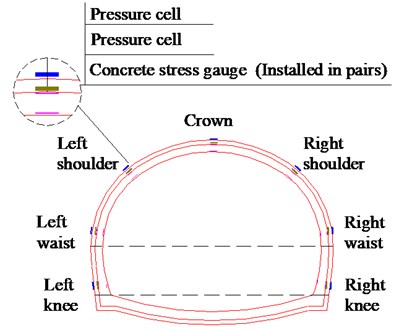
Table 1Monitoring scheme of the triple tunnels
Time after excavation | 1-15 d | 16 d–1 month | A month later |
Measurement frequency | Once or twice a day | Once a day | Once or twice a week |
3. Monitoring results
3.1. Surrounding rock pressure
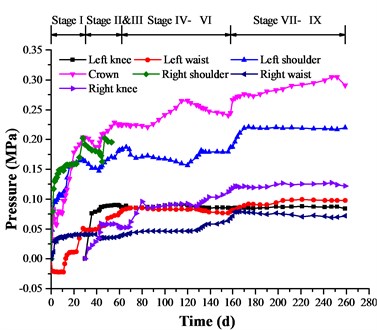
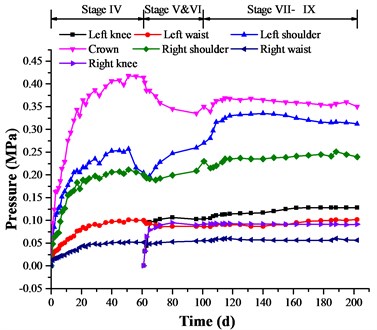
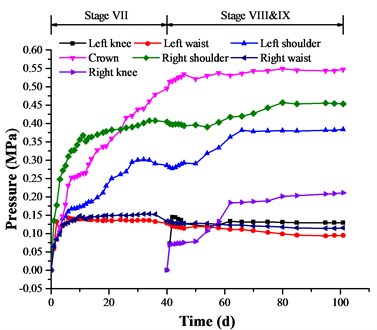
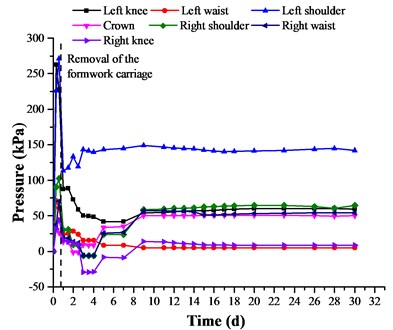
Development of the surrounding rock pressure at DK68 + 220 is shown in Fig. 5, and the final steady state of the surrounding rock pressure is shown in Fig. 6. Note the pressure cell at the right shoulder of the left tunnel was damaged accidentally. Based on the measured data, the following results were obtained.
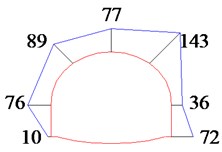
The pressure profile of each tunnel is asymmetrical about the centerline. Similar asymmetrical patterns of the surrounding rock pressure in multiple tunnels were also obtained and analyzed via laboratory model tests [19] and theoretical analysis [20]. For each tunnel, the maximum surrounding rock pressure was observed at the crown, whereas the minimum rock pressure was observed at the waist. The rock pressures at the crown and shoulder were mainly between 0.25 and 0.55 MPa, which were nearly three times the magnitude of those at the waist and knee. This rock pressure pattern is consistent with Protodyakonov’s equilibrium arch theory [20].
Fig. 5Development of the surrounding rock pressure at DK68 + 220
a) Left tunnel
b) Right tunnel
c) Middle tunnel
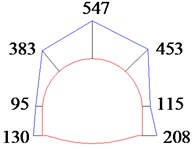
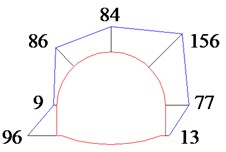
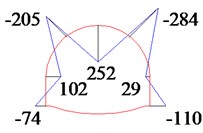
Fig. 6Distribution of the surrounding rock pressure at DK68 + 220 (Unit: kPa)
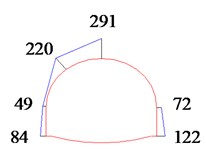
a) Left tunnel
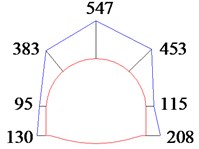
b) Middle tunnel
c) Right tunnel
As expected, the surrounding rock pressure was considerably affected by the pillar width and excavation sequence. For the left and right tunnels, the rock pressure measured at the sides facing the middle tunnel was greater than that at the sides facing outward from the middle tunnel at the same horizontal level. For the left tunnel, a minor impact on the rock pressure was observed when the lagging right tunnel was excavated (Stages IV-VI), whereas the rock pressure was considerably affected by the excavation of the last-excavated middle tunnel (Stages VII-IX), with the increase in the rock pressure on the inner sides accounting for at least 10 % of the stable pressure. Generally believed, the narrower the rock pillar is, the more intense interaction between the multiple tunnels would be [6]. Thus, this phenomenon is illustrated by the much larger width of the rock pillar between the left and right tunnels (1.65 D) compared with that between the left and middle tunnels (0.38 D).
Moreover, the surrounding rock pressure at each monitoring point in the middle tunnel is generally larger than that at the corresponding monitoring points in the left and right tunnels. For example, the pressure measured at the crown in the middle tunnel was 547 kPa, which was much greater than that of the left tunnel (291 kPa) and the right tunnel (351 kPa). The middle tunnel was excavated in rock mass that was heavily disturbed due to the previous excavation of the left and right tunnels, and the rock mass was more severely deteriorated in the class V ground. Therefore, a large Protodyakonov’s equilibrium arch (PEA) was easily formed across the three tunnels; Pengfei Li [20] predicted similar behavior through theoretical analysis.
In the middle tunnel, the surrounding rock pressures at the right side (near the second-excavated left tunnel) are generally larger than those at the left side (near the first-excavated right tunnel). For example, the pressures were 453 and 115 kPa at the right shoulder and right waist, respectively, which were larger than the pressures at the left shoulder (383 kPa) and left waist (95 kPa). This difference is attributed to the closed loop of the primary lining that was already formed in the left tunnel. Thus, the stability of the rock pillar between the left and middle tunnels was guaranteed. Conversely, the construction of the invert in the right tunnel was not yet completed; thus, the redistribution of stress in the rock pillar between the right and middle tunnels was still under progress. This observation suggests that the construction of the invert must be quickly completed to enhance the integrity of the primary lining; this will effectively minimize the load on subsequently excavated tunnels.
3.2. Normal-contact pressure between primary and secondary linings
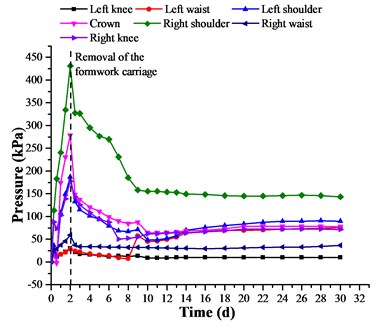
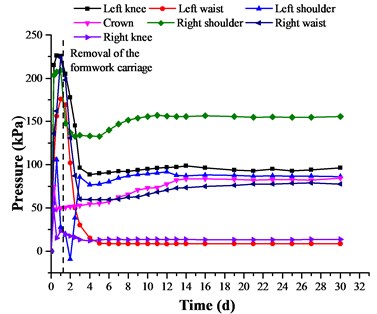
The measured data of normal-contact pressure between the primary and secondary linings at Section DK68 + 220 are plotted in Fig. 7. The distribution of the pressure after equilibrium is plotted in Fig. 8.
The time-pressure curve shows a significant difference between the normal-contact pressure between primary and secondary lings and the surrounding rock pressure. The normal-contact pressure between the primary and secondary linings drastically increased in the initial period until formwork carriage was removed. This increasing trend could be explained by that the strength and stiffness of concrete increased rapidly in the early days and the formwork carriage provided a certain supporting force. The secondary lining was in the three-dimensional stress state due to the presence of the formwork carriage, and although the contact pressure was considerably large, the structure still remained safe. When the formwork carriage was removed, the stress state of secondary lining changed from the three dimensions to two dimensions, and the secondary lining was in the most unfavorable state. With the release of the supporting force of the formwork carriage, the contact pressure then immediately decreased and slowly reached stable values after seven days. Therefore, it was necessary to slow down the removal of the formwork carriage to ensure that the secondary lining gained enough strength and the supporting force acted on the second lining was reduced gradually. The concrete curing should be conducted properly.
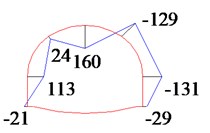
For each tunnel, the maximum pressure (143, 156, and 142 kPa for the left, right, and middle tunnels, respectively) was observed at the shoulder, whereas the minimum pressure (10, 9, and 5 kPa for the left, right, and middle tunnels, respectively) was observed at either the waist or the knee. All the monitored pressures were smaller than 160 kPa, which was substantially smaller than the surrounding rock pressure.
In addition, the mean of the pressure in the left, right and middle tunnels were 71.9, 74.4, and 55.0 kPa, respectively; the corresponding standard deviations were 41.9, 50.7, and 45.3 kPa, respectively. This indicated that for the secondary linings of triple tunnels, the loads transferred from the primary lining are generally similar in magnitude, and the large PEA no longer existed.
The ratio of the average normal-contact pressure acting on the secondary lining to the average surrounding rock pressure acting on the primary lining is directly related to the safety of the supporting system [21], which can be expressed as:
According to monitoring results, the ratio was calculated to be 0.33. Thus, it can be concluded that the primary lining could bear most of the load transfer from surrounding rock, whereas the secondary lining is the safety reservation.
Fig. 7Development of the normal-contact pressure between primary and secondary linings at DK68 + 220
a) Left tunnel
b) Right tunnel
c) Middle tunnel
Fig. 8Distribution of the normal-contact pressure between primary and secondary linings at DK68 + 220 (Unit: kPa)
a) Left tunnel
b) Middle tunnel
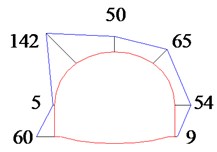
c) Right tunnel
3.3. Internal forces in molded concrete
The internal forces induced in the secondary lining, including the axial force and the bending moment, can be calculated using the following equations [19]:
where and denote the monitored stress on the inner and outer sides of the secondary lining, respectively. and denote the cross-section area and bending modulus of the molded concrete, which are 0.4 m2 and 0.027 m3, respectively. Fig. 9 presents the dynamic evolution of the axial force; Figs. 10 and 11 demonstrate the final distribution of the axial force and bending moment.
Fig. 9Development of the axial force in molded concrete at DK68 + 220
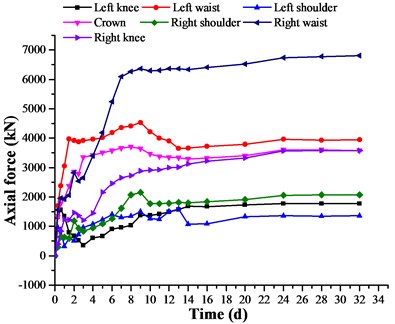
a) Left tunnel
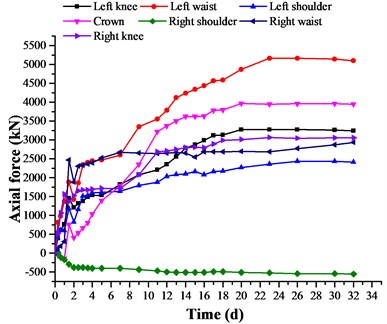
b) Right tunnel
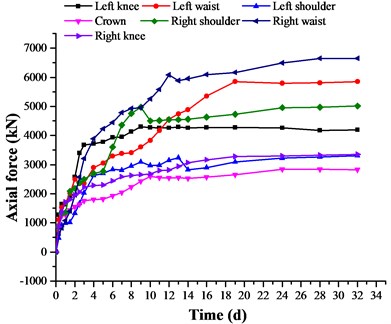
c) Middle tunnel
The axial force in the molded concrete increased sharply and immediately, and the axial force reached nearly 80 % of the final stable values two weeks after the construction of the secondary lining. The axial force then slightly increased and gradually reached a steady state. The molded concrete primarily bear compressive axial forces, except for the axial force measured at the right shoulder of the right tunnel. The axial force at the side wall was larger than those at the tunnel vault. The maximum axial force of each tunnel was observed at the waist (6807, 6649. and 5101 kN for the left, middle, and right tunnels, respectively). The negative monitoring value (−557 kN) observed at the right shoulder indicates the concrete bore tensile force, which is strictly avoided because of the concrete’s considerably smaller tensile capacity compared with the compressive capacity. Thus, some auxiliary measures should be adopted, and careful monitoring should be conducted in the operation period.
The distribution of the bending moment induced in molded concrete exhibits an obvious asymmetrical pattern. For each tunnel, the bending moment reached a maximum positive value at the crown and a minimum negative value at the shoulders. These findings indicate that the internal force induced by the load transferred from the primary lining is complex and the tunnel vault is at the most vulnerable position; therefore, careful monitoring must be conducted in the future.
Fig. 10Distribution of the axial force in molded concrete at DK68+220 (Unit: kN)
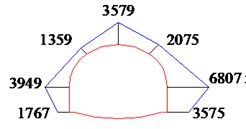
a) Left tunnel
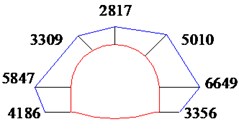
b) Middle tunnel
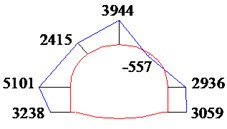
c) Right tunnel
Fig. 11Distribution of the bending moment in molded concrete at DK68 + 220 (Unit: kN·m)
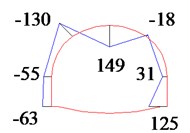
a) Left tunnel
b) Middle tunnel
c) Right tunnel
3.4. Peak particle velocity and corner frequency
Microseismic monitoring technique is widely applied as a tunnel blast monitoring method, and the monitoring sensors are mainly installed at the ground surface to record the blast signals. The critical blast parameters obtained by field monitoring includes corner frequency and PPV [22].
Herein, the peak true resultant particle velocity is used to represent PPV [23]. The empirical formula proposed by Sadovskii is most commonly used for the assessment and control of blasting. The PPV is determined by the distance from the ground surface to the blast point (), explosive charge (), and specific site conditions ( and ) as follows:
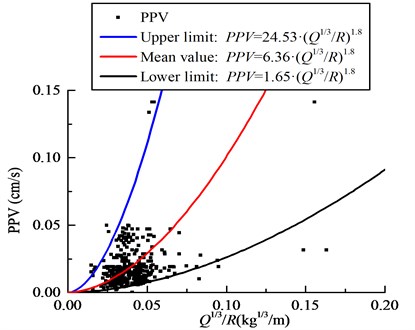
Based on the 447 sets of measured PPV data, the fitting curves between PPV and were obtained by applying the Sadovskii formula and regression analysis method are shown in Fig. 12. The fitting equations of the lower bound, mean value, and upper bound, are also shown. The PPV induced by blast construction can be predicted using the mean value equation.
It should be noted that too lager PPV may have an unfavorable influence on surface structures, thus the maximum charge should be strictly controlled. According to Eq. (4), the maximum charge can be determined by on-site monitoring of the PPV, as the distance from the ground surface to the blast point () and specific site conditions ( and ) were easily obtained.
Based on the 52 sets of blast signals, the distribution of the corner frequency is listed in Table 2. The measured frequency data are within 40-140 Hz, of which 80.8 % of the datasets are within 60-120 Hz.
Fig. 12Fitting curve between PPV and Q1/3/R
To avoid resonance of surface buildings, the corner frequency should be controlled within a specific range. And this specific range should be determined after obtaining the natural frequency of surface buildings.
Table 2Distribution of the corner frequency
Corner frequency (Hz) | 40-60 | 60-80 | 80-100 | 100-120 | 120-140 |
Count | 9 | 18 | 11 | 13 | 1 |
Percent (%) | 17.3 | 34.6 | 21.2 | 25.0 | 1.9 |
4. Safety assessment and vibration reduction techniques
4.1. Assessment of tunnel lining
Referring to the Chinese code [24], the structural safety of a rectangular section of concrete can be revealed by a safety factor (), which can be calculated using the following formulas [25].
When :
When :
where represents the eccentricity; represents the thickness of molded concrete; represents the buckling coefficient, which is equal to one for tunnel engineering; represents the acentric factor. Herein, represents the ultimate compressive strength of the molded concrete, which is equal to 26 MPa; represents the width of the member, which is equal to 1 m; and represents the axial force of the member; represents the ultimate tensile strength of concrete, which is equal to 2.4 MPa.
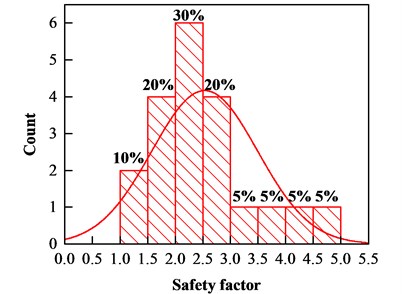
Based on above formulas, the safety factors of the secondary lining at 20 monitoring points can be calculated, as shown in Fig. 13 (the monitoring point at the right shoulder of the right tunnel is not included in the calculation). All the factors at each monitoring point are larger than 1.3. Generally believed, structural safety can be effectively ensured in accordance with the reinforcement effect, which is ignored in the structural analyses described above [25]. Even though, all the safety factors are still greater than 1.3; therefore, it can be concluded that the secondary lining was constructed safely and successfully.
Fig. 13Safety factors of the secondary lining
4.2. Assessment of blast construction
Considering the safety of the Great Wall and some villages adjacent to the triple tunnels, the PPV and corner frequency measured at the ground surface should be considered and strictly controlled simultaneously.
Table 3 shows the Chinese codes mandated to prevent significant vibration damage to historical and sensitive buildings [26]. Based on the monitoring data presented above, the maximum PPV measured from the ground surface is 0.15 cm/s, and the corner frequency mainly ranges from 60 to 120 Hz. According to the Chinese criterion, the monitoring data of PPV are clearly lower than the limitations.
Table 3Safety velocity standard of blast vibration for typical buildings mandated by GB6722-2011 (cm/s)
Building type | Vibration frequency | ||
< 10 Hz | 10-50 Hz | 50-100 Hz | |
Historical buildings | 0.1-0.2 | 0.2-0.3 | 0.3-0.5 |
Brick houses, and rock block buildings | 2.0-2.5 | 2.3-2.8 | 2.7-3.0 |
Moreover, to avoid any violent swaying motions to the historical wall, the resonance phenomenon should be strictly prevented. Referring to the Chinese standard (GB/T50452-2008), the first three orders of the natural frequency of the historical wall can be calculated as 7.4, 22.1, and 36.9 Hz, which are clearly smaller than the measured corner frequency. Overall, the monitoring PPV and corner frequency indicated that the blast engineering has minor negative impacts to the Great Wall and other buildings.
4.3. Vibration-reducing techniques
The blast construction is considered safe according to the above assessments; however, the support structure may face potential risks due to the inherent uncertainties of the surrounding rock mass. Thus, based on real-time monitoring and similar engineering experiences, a series of vibration reduction techniques were proposed and applied in subsequent excavations.
To minimize the negative interactions among triple tunnels caused by blast vibration, the construction sequence was optimized according to pre-design and relative researches [27]. As mentioned in Section 2, the left tunnel was excavated first, followed by the right and middle tunnels. For a transverse section, the secondary lining of each tunnel was not constructed until all the primary linings of the three tunnels were completed to avoid any unfavorable influence caused by blasting construction on the secondary lining.
To avoid any adverse impacts on the historic wall and adjacent buildings, the maximum explosive charge of each blasting operation was strictly controlled according to PPV and corner frequency measured at the ground surface. In addition, the excavation cycle length was also decreased to 0.8 m accordingly in the weak rock mass.
Monitoring results indicate that the physical properties of the surrounding rock mass of the lagging middle tunnel had already been deteriorated due to the excavation of the leading left and right tunnels. To reduce the vibration strength and achieve a better blasting effect for the middle tunnel, the high-precision electronic detonator was used to achieve the millisecond blasting effect. The interval between two adjacent detonations was 5-8 ms. In addition, the original blasting construction of the middle tunnel was simply divided into 2 stages (Fig. 14), to reduce blasting impacts, the blasting sequence was redesigned (Fig. 15).
Summarily, to reduce the vibration impacts, the construction sequence and the secondary lining construction timing should be properly optimized based on engineering experience and pre-design; the maximum explosive charge and the excavation cycle length should be determined based on blasting monitoring and geological conditions; the excavation of the middle tunnel should be paid with more attention and the blasting sequence of middle tunnel should be redesigned.
Fig. 14original blasting sequence diagram of the middle tunnel
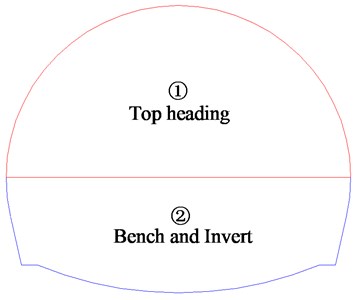
Fig. 15Redesigned blasting sequence diagram of the middle tunnel using the high-precision electronic detonator
5. Conclusions
This paper analyzes the structural responses and seismic responses of large-span triple tunnels, wherein tunnels were excavated using drilling and blasting method. Based on the monitoring results, the following key conclusions are drawn:
1) The mechanical disturbance for the first-excavated left tunnel caused by the last-excavated middle tunnel is much more severe compared with that caused by the second-excavated right tunnel.
2) The safety of the middle tunnel was the most unfavorable due to the formation of the large Protodyakonov’s equilibrium arch (PEA).
3) The ratio of the load carried by the secondary lining to the load carried by the primary lining is averagely 0.33. The primary lining was more vulnerable to damage and the strength of the surrounding rock mass should be enhanced to ensure the stability of the primary lining.
4) The excavation sequence was optimized, and some vibration-reducing techniques were employed accordingly. These engineering measures effectively facilitate the stability of the tunnel construction.
5) According to the Chinese codes, all the safety factors are higher than 1.3, the maximum PPV (0.15 cm/s) is lower than the allowable values, and the corner frequency (40-140 Hz) would not cause a resonant vibration in the Great Wall. Thus, it could be concluded that the safety of large-span triple tunnels was safeguarded.
References
-
Li X., Yuan D. Response of a double-decked metro tunnel to shield driving of twin closely under-crossing tunnels. Tunnelling and Underground Space Technology, Vol. 28, 2012, p. 18-30.
-
Fang Q., Zhang D., Li Q., Wong L. N. Y. Effects of twin tunnels construction beneath existing shield-driven twin tunnels. Tunnelling and Underground Space Technology, Vol. 45, 2015, p. 128-137.
-
Fang Q., Tai Q., Zhang D., Wong L. N. Y. Ground surface settlements due to construction of closely-spaced twin tunnels with different geometric arrangements. Tunnelling and Underground Space Technology, Vol. 51, 2016, p. 144-151.
-
Gue C. Y., Wilcock M. J., Alhaddad M. M., Elshafie M. Z. E. B., Soga K., Mair R. J. Tunnelling close beneath an existing tunnel in clay – perpendicular undercrossing. Géotechnique, Vol. 67, Issue 9, 2017, p. 795-807.
-
Chen R., Lin X., Kang X., Zhong Z., Liu Y., Zhang P., et al. Deformation and stress characteristics of existing twin tunnels induced by close-distance EPBS under-crossing. Tunnelling and Underground Space Technology, Vol. 82, 2018, p. 468-481.
-
Hunt D. V. L. Predicting the Ground Movements above Twin Tunnels constructed in London Clay. Ph.D. Thesis, University of Birmingham, 2005.
-
Chapman D. N., Ahn S. K., Hunt D. V. Investigating ground movements caused by the construction of multiple tunnels in soft ground using laboratory model tests. Canadian Geotechnical Journal, Vol. 44, 2007, p. 631-643.
-
Zhang Z., Huang M. Geotechnical influence on existing subway tunnels induced by multiline tunneling in Shanghai soft soil. Computers and Geotechnics, Vol. 56, 2014, p. 121-132.
-
Do N., Dias D., Oreste P. 3D numerical investigation of mechanized twin tunnels in soft ground – Influence of lagging distance between two tunnel faces. Engineering Structures, Vol. 109, 2016, p. 117-125.
-
Suwansawat S., Einstein H. H. Describing settlement troughs over twin tunnels using a superposition technique. Journal of Geotechnical and Geoenvironmental Engineering, Vol. 133, 2007, p. 445-468.
-
Liang R., Xia T., Hong Y., Yu F. Effects of above-crossing tunnelling on the existing shield tunnels. Tunnelling and Underground Space Technology, Vol. 58, 2016, p. 159-176.
-
Ng C. W., Lee K. M., Tang D. K. Three-dimensional numerical investigations of new Austrian tunnelling method (NATM) twin tunnel interactions. Canadian Geotechnical Journal, Vol. 41, 2004, p. 523-539.
-
Jiang N., Zhou C. Blasting vibration safety criterion for a tunnel liner structure. Tunnelling and Underground Space Technology, Vol. 32, 2012, p. 52-57.
-
Li X., Long Y., Ji C., Zhong M., Zhao H. Study on the vibration effect on operation subway induced by blasting of an adjacent cross tunnel and the reducing vibration techniques. Journal of Virbroengineering, Vol. 15, 2013, p. 1454-1462.
-
Ak H., Iphar M., Yavuz M., Konuk A. Evaluation of ground vibration effect of blasting operations in a magnesite mine. Soil Dynamics and Earthquake Engineering, Vol. 29, 2009, p. 669-676.
-
Nateghi R. Prediction of ground vibration level induced by blasting at different rock units. International Journal of Rock Mechanics and Mining Sciences, Vol. 48, 2011, p. 899-908.
-
Zhang D., Fang Q., Hou Y., Li P., Yuen Wong L. N. Protection of buildings against damages as a result of adjacent large-span tunneling in shallowly buried soft ground. Journal of Geotechnical and Geoenvironmental Engineering, Vol. 139, 2013, p. 903-913.
-
Luo Y., Chen J., Chen Y., Diao P., Qiao X. Longitudinal deformation profile of a tunnel in weak rock mass by using the back analysis method. Tunnelling and Underground Space Technology, Vol. 71, 2018, p. 478-493.
-
He J. Study on the Mechanical Behaviour of Asymmetric Closely Adjacent Tunnels Construction Process. Ph.D. Thesis, Beijing Jiaotong University, 2018, (in Chinese).
-
Li P., Wang F., Fan L., Wang H., Ma G. Analytical scrutiny of loosening pressure on deep twin-tunnels in rock formations. Tunnelling and Underground Space Technology, Vol. 83, 2019, p. 373-380.
-
Gao Y., Xu F., Zhang Q., He P., Qin Z. Geotechnical monitoring and analyses on the stability and health of a large cross-section railway tunnel constructed in a seismic area. Measurement, Vol. 122, 2018, p. 620-629.
-
Li A., Fang Q., Zhang D., Luo J., Hong X. Blast vibration of a large-span high-speed railway tunnel based on microseismic monitoring. Smart Structures and Systems, Vol. 21, 2018, p. 561-569.
-
Sharif A. K. Dynamic Performance Investigation of Base-Isolated Structures. Ph.D. Thesis, Imperial College London, 2000.
-
TB10003−2016(2016) Code for Design on Tunnel of Railway. China Communications Press, Beijing, 2016.
-
Zhang D., Fang Q., Li P., Wong L. N. Y. Structural responses of secondary lining of high-speed railway tunnel excavated in loess ground. Advances in Structural Engineering, Vol. 16, 2016, p. 1371-1379.
-
Lu W., Luo Y., Chen M., Shu D. An introduction to Chinese safety regulations for blasting vibration. Environmental Earth Sciences, Vol. 67, 2012, p. 1951-1959.
-
Zheng Y. Study on the Influence Degree of Adjacent Construction of Three Parallel Shield Tunnels. Ph.D. Thesis, Southwest Jiaotong University, 2007, (in Chinese).
Cited by
About this article

The authors gratefully acknowledge the financial support by National Natural Science of China under Grant 51738002, China Railway Corporation Research and Development Program of Science and Technology under Grant 2014004-C, National key R&D Program of China under Grant 2017YFC0805401 and Fundamental Research Funds for the Central Universities under Grant No. C17JB00030.
Ran Li is the main accomplisher of this research and the author of innovations. Dingli Zhang is the chief of the project, and he is also the supervisor of the research paper. Qian Fang is the vice chief of this project and one of the accomplishers of the innovations. Ao Li is the person in charge of monitoring scheme. Xuefei Hong is one of the monitoring technicians. Xuebo Ma is one of the monitoring technicians.
