Abstract
In this work, the safety performance and loading behavior of a large-scale facility were studied using experimental observations, numerical simulations and theoretical calculations. Furthermore, the effects of concentration, pressure relief and volume on the shock wave loadings were investigated. In particular, based on the dimensional theoretical analysis, a model for the analysis of overpressure peak and impulse for such facilities was proposed. The results showed that if concentration was larger than 10.5 %, the peak overpressure and the maximum overpressure rate were decreased; if the ignition mode was chemical, the propagation speed of flame was increased. In addition, it was found that the overpressure was the largest if the concentration was 9.5 %, and with the increase of the distance from the ignition source, the overpressure peak decreased first and then increased. The present study and results can therefore provide the loading information to enhance the antiexplosion performance of such facilities, which is very promising for the future safety evaluations and fault diagnosis of buildings, and constructions in various fields, especially, for nuclear power stations.
Highlights
- The effects of concentration, pressure relief and volume on the shock wave loadings were investigated.
- A model for the analysis of overpressure peak and impulse for such facilities was proposed.
- If concentration was larger than 10.5%, the peak overpressure and the maximum overpressure rate were decreased.
- The present study and results can therefore provide the loading information to enhance the antiexplosion performance of such facilities.
1. Introduction
China is carrying out large-scale urbanization construction. In order to improve the construction and operation safety of municipal pipelines, large-scale public facilities were built in newly-built urban. To achieve the comprehensive utilization of underground space, the municipal pipelines such as electric power, communication, and water supply are built together, as shown in Fig. 1. The total length of large-scale public facilities which has been built and is being built in China reaches more than 4000 kilometers.
The combustible matter has certain leakage risk in the processes of production, processing, transportation, storage and use, as shown in Fig. 2. For the leaked matter, a mixed matter can be formed with air under the air convection. When the explosion limit is reached, a large area of combustion explosion can occur if a fire source or a certain amount of heat which can meet the requirement of the minimum ignition energy of matter. If there is a closed space or partial restraint to form a turbulence acceleration condition, the combustion will turn into a detonation and causing a more serious hazard. On November 22, 2013, a pipe leak and explosion occurred in Qingdao, Shandong, China, which caused 63 deaths and 136 injuries, as shown in Fig. 3. What is more, on August 1, 2014, an explosion caused by leak occurred in a few streets in the Qianzhen District of Kaohsiung City, Taiwan, which caused 32 deaths and 321 injuries, as shown in Fig. 4. The pipe in a facility also has the risk of leakage and explosion, so the explosion risk in the facility needs to be evaluated, and the safety of the structure and other pipelines of facility also needs to be analyzed under blast load. Therefore, it is of great significance to study the characteristics of blast load in a facility.
Fig. 1An facility under construction in Beijing
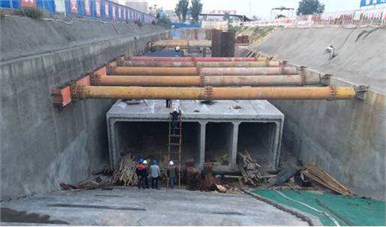
Fig. 2Pipe in a facility in Beijing
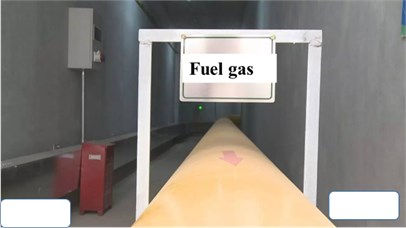
Fig. 3An explosion occurred in a pipeline in Qingdao
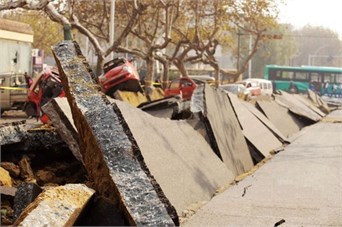
Fig. 4An explosion occurred in a pipeline in Kaohsiung

Bjerketvedt [1] has defined explosions as a process in which the combustion of premixed matters (fuel + air/ oxidant) results in a dramatic increase in pressure, which can occur within equipment or the interior of a pipe, within open or confined spaces such as buildings and offshore platforms. At present, the research on explosion is mainly studied from model test and numerical simulation. Lewis [2] has proposed the conditions for laminar burning waves produced the deflagration. The experimental and theoretical study on the flame propagation of premixed matters in a small cylindrical vessel with an aspect ratio of 3:1 was carried out by Fairweather [3]. He analyzed the law of flame propagation under barrier-free and barrier, and concluded that the explosion overpressure is mainly formed by turbulent combustion caused by barrier. In the above container, Chow [4] has studied the effects of pressure relief vent, failure pressure of pressure relief plate, ignition position, material type, and container placement direction on combustion rate and overpressure. Tomlin [5] has carried out natural explosion tests with different pressure relief vent and congestion in the explosion chamber, and the research results show that the size of pressure relief plate, the failure pressure and the internal congestion have great influence on the explosion pressure. The explosion tests of methane-hydrogen mixtures with different volume ratios in 3 m × 3 m × 18 m space have been carried out by Lowesmith [6, 7]. It is found that the flame propagation velocity increases rapidly after entering the congested space. Salzano [8] studied the effects of concentration and initial pressure on peak overpressure, overpressure rise rate and combustion rate by hydrogen-methane air explosion test in a 5 L vessel. Kundu [9] has pointed out that explosion studies were mostly carried out in small-scale equipment, while full-scale tests could lead to stronger explosions. Chyży [10] has presented a simplified basic equation for explosion in buildings, and the equation consists of two explosion equations in pressure rising and falling stages. Ugarte [11] has proposed a method to calculate the pressure in explosion chamber based on the solution of the basic control equation, which comprehensively considers the influence of the shape and size of the chamber, the concentration of materials and the ignition position. Razus’s [12]comparison between explosion empirical and semi-empirical calculation method shows that there is a great difference between the different methods. Cooper’s [13] experiment was carried out by using an approximate cube with a low explosion venting pressure and the physical mechanism of generating a large overpressure peak was studied. Hansen [14, 15] has proposed an equivalent cloud method for the study of explosion risk and impact, which can reduce the number of large-scale explosion simulations by estimating the equivalent cloud size to classify the disasters in different scenes. Fang [16] has considered many factors such as the change of cross-sectional area, roughness of the wall, and obstacles in the tunnel and modified the decay equation put forward by Smith.
In the present work, based on a completed explosion model, we investigated the blast loading characteristics of a typical facility in order to achieve the shock wave propagation law and distributions of the explosion. Furthermore, we analyzed the effects of materials concentration, pressure relief vent and volume on the shock wave load. By the dimensional theoretical analysis, we have established a formula for calculating the overpressure peak and impulse for such facilities. The present research and the results can therefore provide the loading information for the safety assessment and further improve the anti-explosion safety performance of the facilities.
2. Tests of explosion and verification of numerical analysis method
2.1. Test apparatus and results
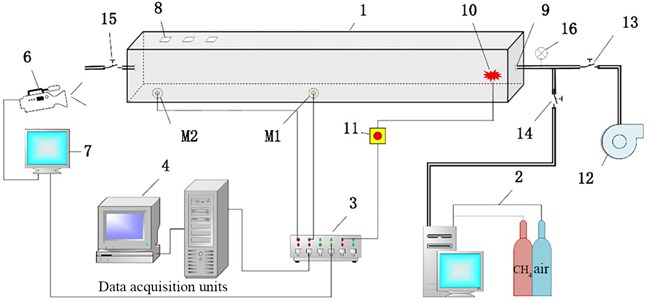
The methane-air mixed explosion experimental system of the tunnel model is shown in Figs. 5 and 6. This system is mainly composed of a 6 m long explosion pipeline with a cross section area of 0.11 m×0.11 m, air distribution system, ignition device, synchronous control system, high-speed camera and data acquisition system. The configuration for the high speed camera is: a shooting frequency of 200 frames per second. During the experiment, appropriate amount of methane-air premixed materials was supplied into the pipeline and one end was ignited under the control of the control system. The produced high-temperature and high-pressure materials expands toward the other end. In the same time, the measurement system records the overpressure output data at the measuring point.
Fig. 5The test system of horizontal square pipeline: 1 – horizontal square pipeline; 2 – air distribution system; 3 – synthronous controller; 4 – data acquisition units; M1 and M2-pressure sensors which are measuring point 1 and measuring point 2; 6 – high-speed camera; 7 – image displayer; 8 – opening area; 9 – inlet/outlet; 10 – ignition device; 11 – control switch; 12 – vacuum unit; 13, 14, 15 – switching valve; 16 – vacuum meter
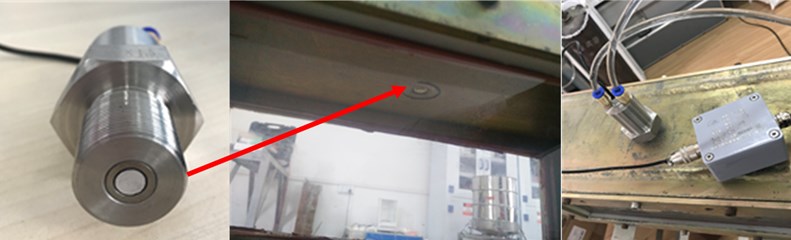
The pressure sensor applies the high-frequency water-cooled pressure transmitter (Fig. 7). The model of the pressure sensor is CYG1409F (0-1MPa) JAS13C1Q and the frequency response is 100 kHz. The power supply voltage equivalent resistances by the integrated circuit technology, which forms a new Huygens bridge. uses ±15VDC power. This sensor is diffused into four the bridge loses balance after the pressure sensor is stressed, and one signal (0-5 V) proportional to pressure is out.
Fig. 6Experimental system of methane-air mixed explosion
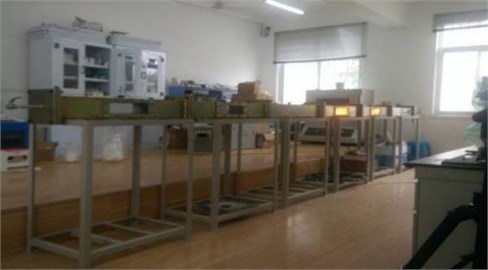
Fig. 7The sensor used for the high-frequency water-cooled pressure transmitter
This study is to discuss the methane-air mixed explosion pressure characteristics under different concentrations. Since the explosion concentration of methane ranges between 5 %-15 %, the methane concentration is determined 6.5 %, 7.5 %, 8.5 %, 9.5 %, 10.5 %, 11.5 %, 12.5 %, and 13.5 % in this experiment, respectively.
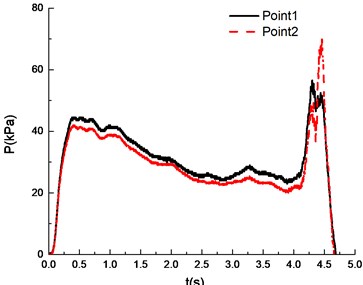
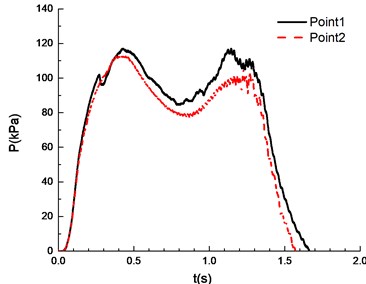
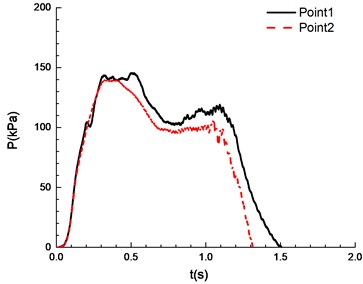
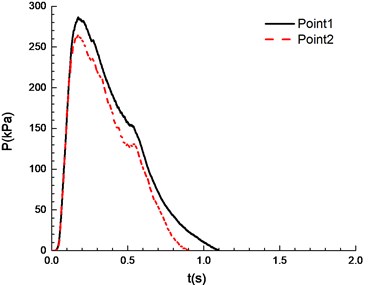
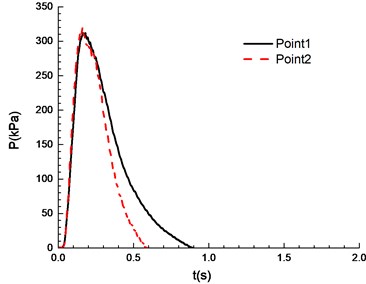
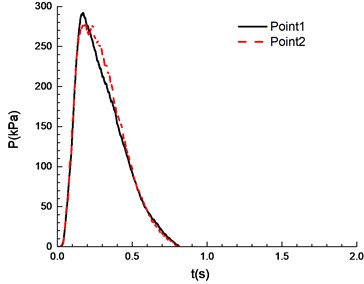
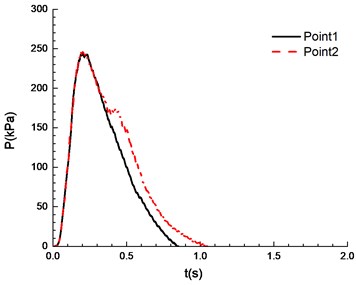
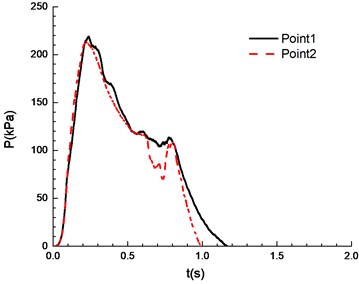
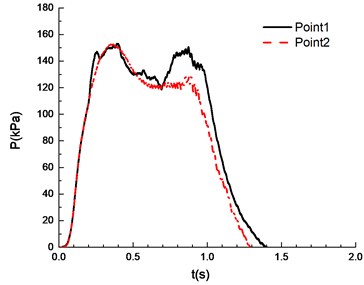
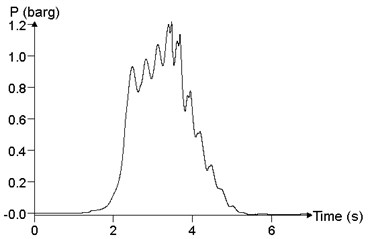
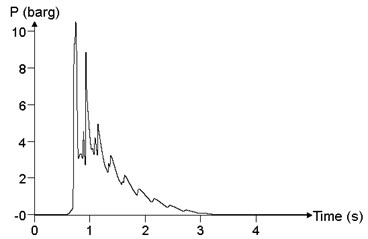
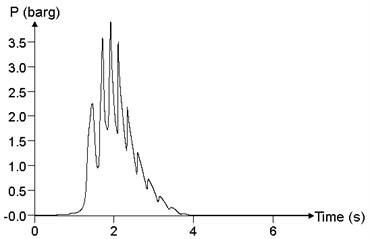
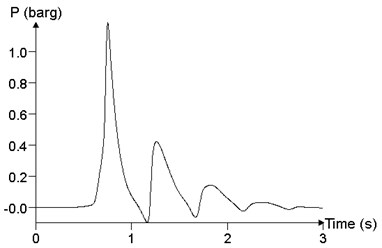
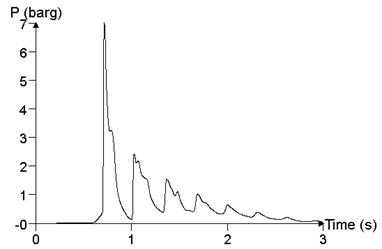
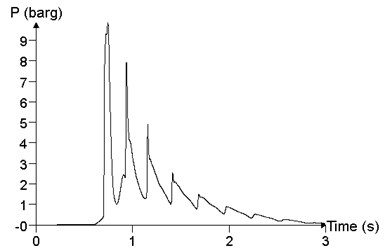
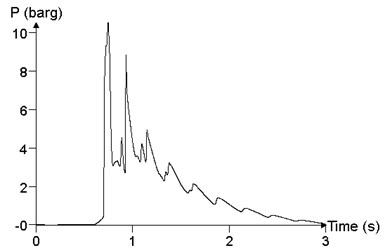
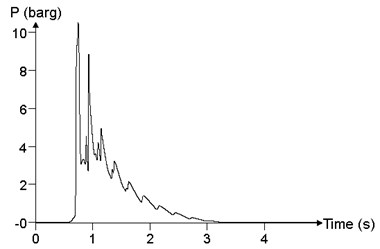
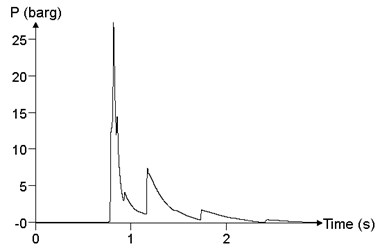
The ignition is at one end of the pipeline. Experimental results are shown in Fig. 8, in which the black solid line reflects overpressure data at measuring point 1 (middle point of the pipeline) and the red dotted line reflects overpressure data at measuring point 2 (end point of the pipeline). The ignition energy is 5 J.
Table 1Comparison of peak overpressure
Pressure / kPa | Concentration | ||||||||
6.5 % | 7.5 % | 8.5 % | 9.5 % | 10.5 % | 11.5 % | 12.5 % | 13.5 % | 14.5 % | |
Point 1 | 56.5 | 117 | 246.5 | 286.5 | 312 | 292 | 244.5 | 219 | 153 |
Point 2 | 70 | 145.5 | 230.5 | 264.5 | 319 | 280 | 247 | 214 | 152.5 |
Fig. 8Overpressure time curves with the methane concentration
a)6.5 %
b)7.5 %
c)8.5 %
d)9.5 %
e)10.5 %
f)11.5 %
g)12.5 %
h)13.5 %
i)14.5 %
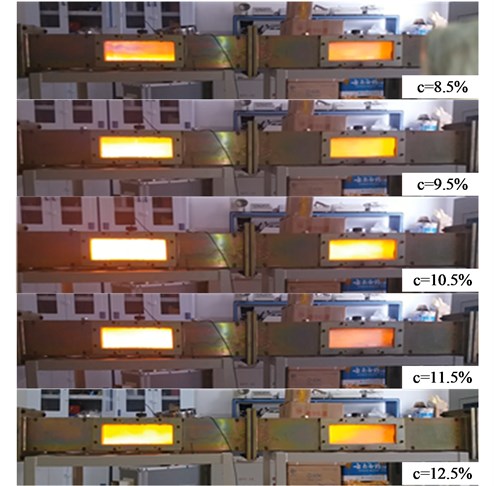
It can be seen from Fig. 8 that experimental results at point 1 and point 2 are different under a certain concentration. Specifically, experimental results at point 1 are higher than those at point 2. This is caused by the certain pressure relief as a result of the poor sealing of experimental apparatus. In the experiment, the explosion phenomenon was the most obvious when methane concentration reached 10.5 %, manifested by the maximum peak overpressure (Table 1) and the brightest flame from the glass window (Fig. 9). When methane concentration reached 9.5 % and 11.5 %, the explosion phenomena were very similar. For that methane concentration, the pressure rise rates were the same, and the peak of the overpressure was very close. There was a loud explosion sound and orange flame from the glass window. However, the explosion sound was weaker than that when methane concentration reached 9.5 %, and the flame was weaker. The explosion sound and flame were further weakened when methane concentration reached 8.5 %. Here it is noted that the audio data are more convincing to show the extent of sound. Nevertheless, for our explosion test of mixed materials, it is difficult to extract the audio signals from the high speed camera.
Fig. 9 shows the integral curve of overpressure versus time. One can see that the impulse increases with time. Until the overpressure drops to zero, the impulse curve tends to be flat.
Fig. 9Curves of impulse versus time
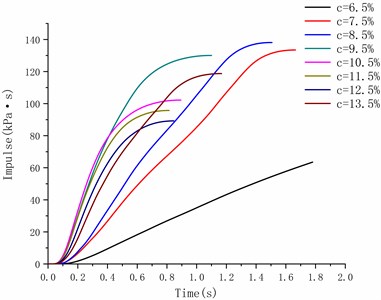
Fig. 10Flame propagation process (electrode ignition) to show the bright orange flame
2.2. Validation of numerical analysis model
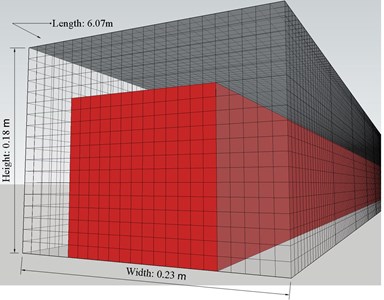
FLACS is a three-dimensional computational fluid dynamics software for calculating leakage and explosion (Gexcon 2018). For the FLACS software, the standard - turbulence model (Xu et. al 2016)is used to describe the flame development, combustion and explosion behavior, and further to investigate changes in local reactions with various physical parameters such as concentration, temperature, pressure, and turbulence. In this paper, the shock wave characteristics of explosion in a facility are studied using the Flacs. The size of the model was set up based on the dimension of the experimental pipe. The inner diameter of the pipe was 11 cm×11 cm, the length was 6 m, and the thickness of the pipe wall was 1 cm in the model, as shown in Fig. 11. The simulation space was 6.07 m×0.23 m×0.18 m (-axis, -axis, -axis), and the grid was divided into cubes with a side length of 1 cm, as shown in Fig. 12. Two pressure measuring points were set at 3 m (measuring point 1), and 0.25 m (measuring point 2), respectively. We assume that the interior of the model was filled with the methane-air mixture and the ignition position was at the center of the model where 5.85 m.
Fig. 11Dimensions of the used pipeline model
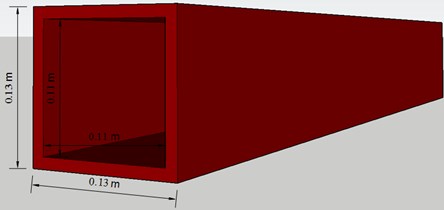
Fig. 12Simulations for the space model
The main parameter settings are as follows: The -axis positive direction is upward, the gravity acceleration direction is the -axis negative direction, the temperature is 20 ℃, the atmospheric pressure is 1.01 MPa, the air composition is oxygen and nitrogen, and the volume fractions of the oxygen and the nitrogen are 20.95 percent and 79.05 percent respectively. Except that ZL0 (-axis lower boundary) is the EULER boundary, the other five boundaries are assumed to be the PLANE_WAVE boundary adapted to the explosion scene, CFLC and CFLV are 5 and 0.5, respectively, DTPLOT is 0.01 s, assuming that there is a radiant heat transition. For most explosion simulations, EULER boundary, which is zero-pressure, can be used. The CFLC is the time step restriction of speed of sound, and the CFLV is the time step restriction of flow velocity. In the explosion simulations, a default value of 5 for CFLC, and 0.5 for CFLV is kept. The DTPLOT is the time interval (in seconds) for the field output.
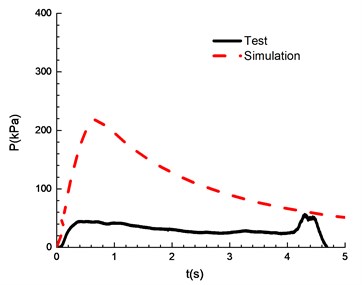
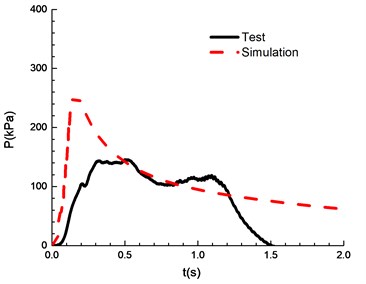
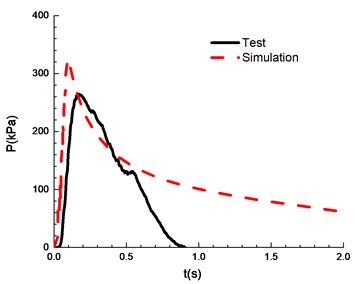
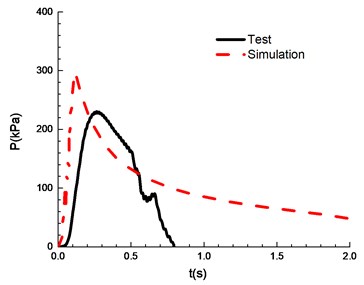
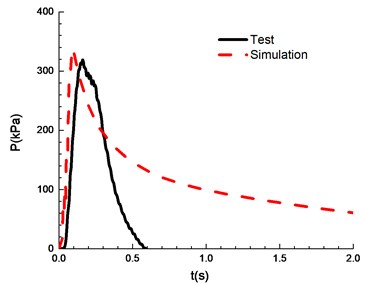
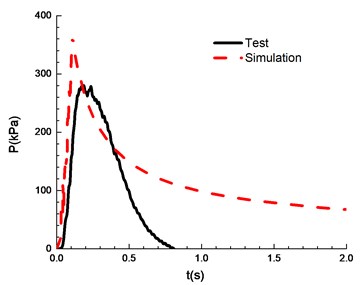
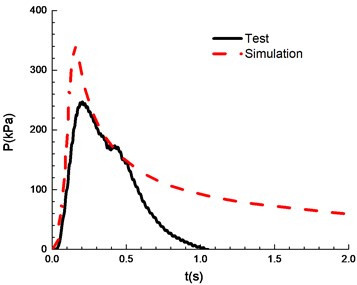
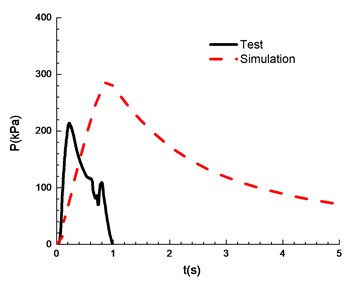
Fig. 13Comparison of test and simulation results (overpressure)
a)6.5 %
b)7.5 %
c)8.5 %
d)9.5 %
e)10.5 %
f)11.5 %
g)12.5 %
h)13.5 %
The compassion of test and simulation is shown in Fig. 13. When the ignition energy is 5 J and the concentration of mixed materials is 6.5 % and 7.5 %, the peak of overpressure calculated by numerical simulation differs greatly from the experimental results. In the numerical simulations of FLACS, the hindrance of the conduit wall on the pressure wave is ignored, which can lead to a high overpressure peak than that for the experimental results. When the concentration of mixed materials reaches 10.5 %, methane is fully combusted and the error between experimental and simulation is the least. When the concentration is between 8.5 % and 13.5 %, the error between numerical simulations and the experimental observations can meet the research needs. Table 2 shows a comparison of overpressure calculated by numerical simulations and experimental results under different concentrations.
Table 2Comparison of test and simulation results
Condition | Concentration | |||||||
6.5 % | 7.5 % | 8.5 % | 9.5 % | 10.5 % | 11.5 % | 12.5 % | 13.5 % | |
Chemical ignition | 56.5 | 117 | 246.5 | 286.5 | 312 | 292 | 244.5 | 219 |
Simulation | 218 | 255.1 | 297.3 | 325.6 | 338.4 | 367 | 341.6 | 289.9 |
3. Analysis of the characteristics of loadings
3.1. Numerical analysis model
In order to study the characteristics of explosion load in a facility, the typical section of a facility in a city is chosen as the research object, as shown in Fig. 14. The facility access line has a feed water (DN600), reclaimed water (DN300), electricity (10 KV), communications, heating (DN300), natural materials (DN300), and a sewer conduit (DN600) with a four-compartment rectangular cross section. The simplified facility model is a rectangular with a size of 2 m×3 m ×200 m, regardless of the role between the materials and the adjacent chamber, as shown in Fig. 15. To make the model more accurate, the opening facilities, such as a personnel entrance and exit, access hole, air vent and the like, which are connected with the external environment, is arranged at two ends of the facility. The facility is composed of the conventional facilities, such as two pipes, a pipe frame, and a personnel climbing ladder. The measuring points of the explosion model are transversely arranged. One measuring point is arranged every 5 m at 1.5 m until the end (M1-M20). Within (5, 100 m), 24 measuring points (M21-M24) are arranged at the end part at intervals of 1 m. The coordinate values from measuring point 1 to measuring point 24 are shown in Table 3. Additionally, measuring points at positions such as personnel entrance and exit (M25), air vent (M26-M28). And the measuring point position is shown in Fig. 16.
Fig. 14Schematic diagram of tank (mm)
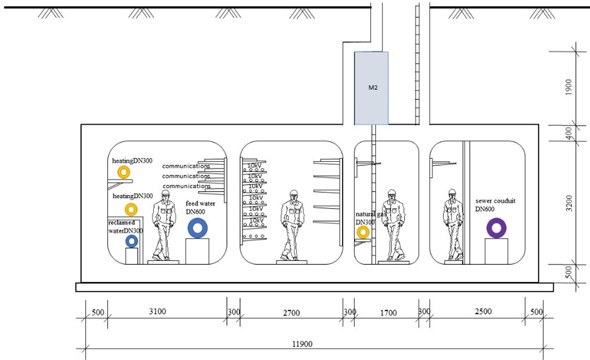
Fig. 15Simulation analysis model of a facility
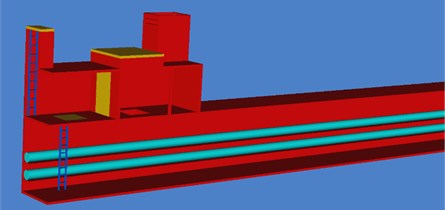
Fig. 16Measuring point placement within the facility model
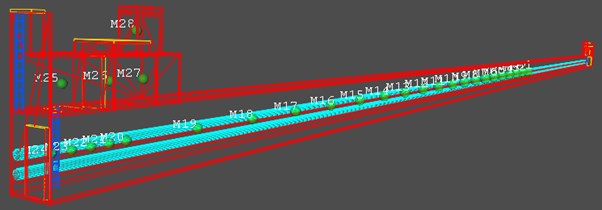
Table 3X coordinate values of measuring points 1 to 24
M1 | M2 | M3 | M4 | M5 | M6 | M7 | M8 | M9 | M10 | M11 | M12 |
100 m | 95 m | 90 m | 85 m | 80 m | 75 m | 70 m | 65 m | 60 m | 55 m | 50 m | 45 m |
M13 | M14 | M15 | M16 | M17 | M18 | M19 | M20 | M21 | M22 | M23 | M24 |
40 m | 35 m | 30 m | 25 m | 20 m | 15 m | 10 m | 5 m | 4 m | 3 m | 2 m | 1 m |
3.2. Effects of various parameters
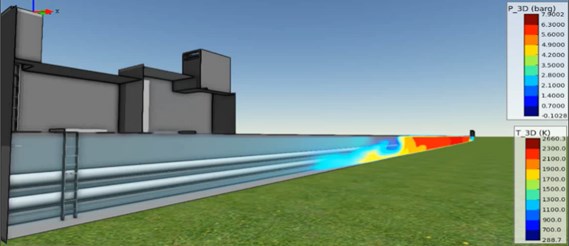
It can be seen from the experimental results that the main parameters influencing the explosion load in the facility are mixed concentration, mixed volume and ignition position. By changing the mixed concentration, the mixed volume and the ignition position, the law of its influence on explosion load in a facility is studied. A typical explosion within facility occurs as shown in Fig. 17 for the propagation of the blast wave.
Fig. 17The propagation process of blast waves in a facility
3.2.1. Influence of mixed concentrations
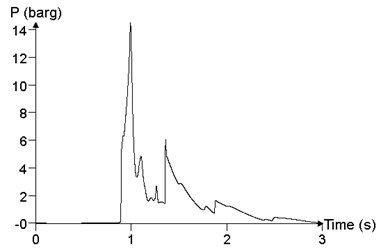
To study the influence of mixed concentration on explosion load in a facility, the propagation and distribution of explosion wave in the facility were analyzed, with mixed concentration of 6.5 %, 9.5 % and 12.5 %, respectively. We assume that the mixed materials is filled with the facility, and the ignition position is in the middle position. Because of the limitation of the content of the text, it is impossible to give the pressure time history curve of all points. In this paper, the maximum of the pressure peak point in the calculation results and point 24 are selected to study the influence of the mixed concentration on the explosion load, which is shown in Fig. 18. When the concentration of mixed materials is 6.5 %, the peak of overpressure at point 24 is 120.1 kPa. When the concentration of the mixed materials is 9.5 %, the peak of the overpressure at point 24 is 1050.3 kPa. When the concentration of mixed materials is 12.5 %, the peak of the overpressure at point 24 is 388.8 kPa. With the increase of mixed concentration, the peak of overpressure increases first and then decreases. When the concentration of the mixed materials is 9.5 %, the combustion reaction of the methane-air mixed materials is the most adequate, which is in accordance with the experimental results.
Fig. 18Relationship between pressure time history curve and mixed concentration c (point 24)
a)6.5 %
b)9.5 %
c)12.5 %
3.2.2. Influence of mixed volume
In order to study the influence of mixed volume on blast load in a facility, the propagation and distribution of explosion wave in the facility is analyzed, with mixed volume (volume of mixed materials was expressed by ) of (2×10×3) m3, (2×50×3) m3, (2×100×3) m3 and (2× 200×3) m3, respectively. The concentration of the mixed materials was 9.5%, and the ignition position was at the medial position of the facility. Fig. 19 shows the comparison of the different materials cloud volumes, which is the maximum value of the overpressure peak in the calculation results, that is, the result of the point 24. When the volume of materials cloud is (2×10×3) m3, the peak of overpressure at point 24 is 118.4 kPa. When the volume of materials cloud is (2×50×3) m3, the peak of overpressure at point 24 is 698.2 kPa. When the volume of materials cloud is (2×100×3) m3, the peak of overpressure at point 24 is 977.0 kPa. When the volume of materials cloud is (2×200×3) m3, the peak of overpressure at point 24 is 1050.3 kPa. With the increase of the volume of the cloud, the peak of overpressure increases gradually.
3.2.3. Influence of ignition position
In order to study the influence of ignition position on the explosion load in a facility, the propagation and distribution of explosion waves in a facility at ignition position () of 100 m, 150 m and 200 m in a facility are analyzed. When the concentration of the mixed materials was 9.5 %, the volume of the mixed materials was filled inside the facility.
Fig. 19The relationship of pressure time history curve with the volume V (point 24)
a)2×10×3 m3, 118.4 kPa
b)2×50×3 m3, 698.2 kPa
c)2×100×3 m3, 977.0 kPa
d)2×200×3 m3, 1050.3 kPa
Fig. 20The relationship between the pressure time history curve and the ignition position Ig (point 24)
a) 100 m
b)150 m
c)200 m
Fig. 20 shows the comparison of the different ignition positions, which is the result of the maximum value of the overpressure peak in the calculation result, that is, the point 24. When the ignition position is at the center of cloud (100 m), the peak of overpressure at point 24 is 1050.3 kPa. When the ignition position is 3/4 of the cloud (150 m), the peak of the overpressure at point 24 is 2627.4 kPa. When the ignition position is at one end of the cloud ( 200 m), the peak of the overpressure at point 24 is 1426.98 kPa. As the ignition position moves toward end within the cloud, the overpressure peak increases first and then decreases.
Table 4Comparison of the peak of overpressure
Volume of the cloud / m3 | 2×10×3 | 2×50×3 | 2×100×3 | 2×200×3 |
Overpressure peak /kPa | 118.4 | 698.2 | 977.0 | 1050.3 |
3.3. Calculation formula for the blast loadings
3.3.1. Parameter determination for dimensional analysis
The combustion explosion is a very complex process. The similarity principle is widely applied in both theoretical research and experimental technology. In addition, the principle of dimensional analysis can provide us with a reasonable and gradual method [17].
According to the theory of explosion, if the influence of the viscosity of the medium, heat conduction and ignition energy on the result is ignored, the factors influencing overpressure peak are known as follows:
1) Methane-air mixed materials: concentration , volume ;
2) Air medium: initial pressure ;
3) Distance from ignition source ;
4) The area of the pressure relief opening ;
Thus, can be considered as a passive quantitation by the dimensional basic law, and , , , and are both the active quantitation, i.e., , , , , (Li 2000).
According to the dimensional analysis theory (Shao 2010), the formula for calculating the peak value of the overpressure can be obtained as follows:
In this paper, the initial pressure 100 kPa is a simplified formula form. And then, the parameters are directly substituted into the calculation, and the specific values are not given, but the relevant parameters are represented by symbols. In order to determine the specific calculation formulas of concentration , mixed materials volume and pressure relief vent , this paper takes the typical facility of the previous explosion analysis as the calculation background. By changing the concentration , mixed volume , pressure relief vent to establish a calculation formula of blast load in the typical facility.
3.3.2. Pressure relief vent
To consider the influence of the pressure relief vent, different parameters of the pressure relief vent are selected in this paper. As shown in Table 5, the explosion concentration is set to be 9.5 %, and the volume of the mixed materials is calculated according to the internal space filled with the facility ( 2 m×3 m×200 m = 1200 m3).
As can be seen from the Eq. (1), under the condition that the distance from the ignition source and the concentration of the mixed materials are constant, the blast peak of overpressure related to the pressure relief vent and the distance from the ignition source, that is:
Table 5Parameter for calculation of pressure relief vent Sv
Parameter | Value | ||||
/ m2 | 1 m×1 m = 1 m2 | 1.5 m×1.5 m = 2.25 m2 | 2 m×2 m = 4 m2 | 2 m×3 m = 6 m2 | 2 m×4 m = 8 m2 |
/ % | 9.5 % | ||||
/ m3 | 1200 m3 | ||||
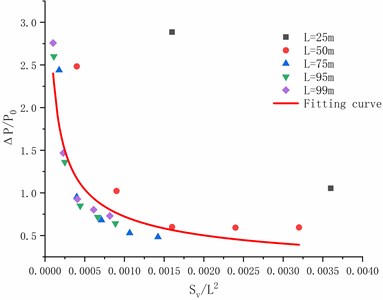
By using the results of numerical analysis, the results of 25 m, 50m, 75 m, 95 m and 99 m are calculated by fitting formula. According to the Eq. (2), we can obtain a fitting formula which is as follows:
The fitting curve is shown in Fig. 21.
Fig. 21The fitting curve of ΔP/P0 and Sv/L2
3.3.3. Volume of mixed materials
To consider the influence of mixed volume, different mixed volumes were chosen as parameters in this paper. As shown in Table 6, explosion concentration was set to be 9.5 % and the pressure relief vent 4 m2.
Table 6Parameters for calculating mixed volume
Parameter | Value | |||
/ m2 | 2 m×2 m = 4 m2 | |||
/ % | 9.5% | |||
/ m3 | 2 m×3 m×10 m = 60 m3 | 2 m×3 m×50 m = 300 m3 | 2 m×3 m×100 m = 600 m3 | 2 m×3 m×200 m = 1200 m3 |
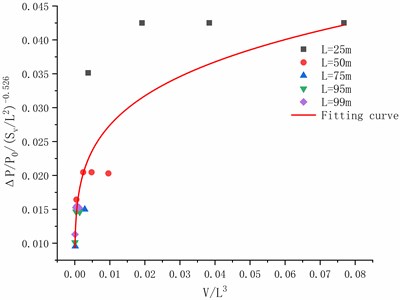
The results of points at 25 m, 50 m, 75 m, 95 m and 99 m are calculated by formula fitting, as shown in Fig. 22. It can be seen from the Eq. (3) that in the case of the mixed concentration 9.5 % and the pressure relief vent 4 m2, the peak of overpressure is related to mixed volume and the distance , that is:
According to the Eq. (4), the peak of the overpressure is fitted as shown in Fig. 23, and the fitting formula can be obtained as follows:
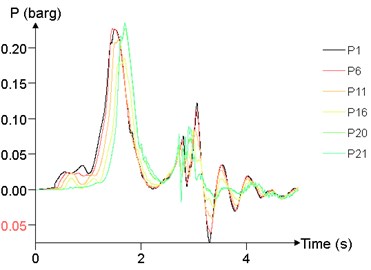
Fig. 22Overpressure time curves of several measuring points
a) 60 m3
b)300 m3
c)600 m3
d) 1200 m3
Fig. 23The fitting curve of ΔP/P0Sv/L2-0.526and V/L3
3.3.4. Concentrations
In order to take into account, the influence of the concentration of mixed materials, different concentrations of the mixed materials were selected as parameters. The concentration of methane was in the range of 6.5 % to 12.5 %. As shown in Table 7, the pressure relief vent 4 m2, and the volume of the mixed materials was calculated filled with the facility (1200 m3).
Table 7Parameters for calculating volume of mixed materials
Parameter | Value | |||||
/ m2 | 2 m×2 m = 4 m2 | |||||
/ % | 7.5 % | 8.5 % | 9.5 % | 10.5 % | 11.5 % | 12.5 % |
/ m3 | 1200 m3 | |||||
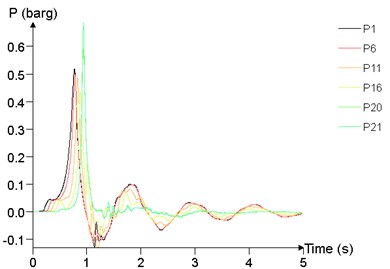
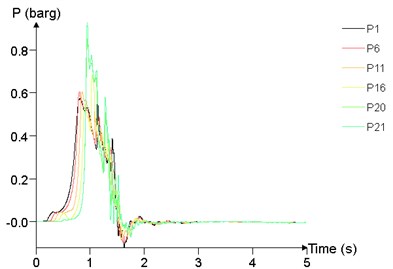
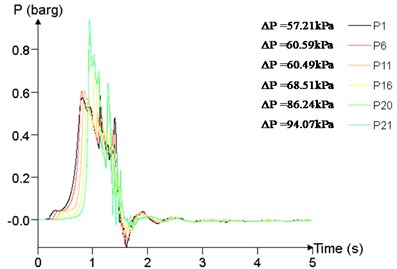
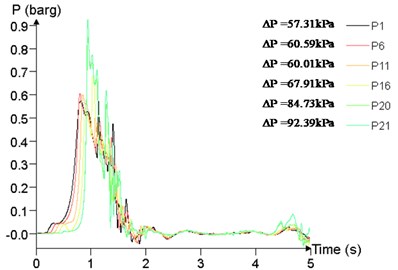
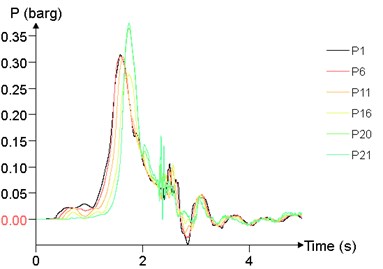
Fig. 24 shows the time history curve of the overpressure at 1 m (P1), 25 m (P6), 50 m (P11), 75 m (P16), 95 m (P20), 99 m (P21) at different concentrations. The peak of overpressure of P20 and P21 is significantly greater than that of other points, while the overpressure curve of P1, P6, P11, P16 are not significantly different.
Fig. 24Overpressure time curves of several points
a)7.5 %
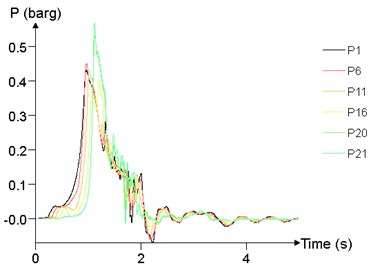
b)8.5 %
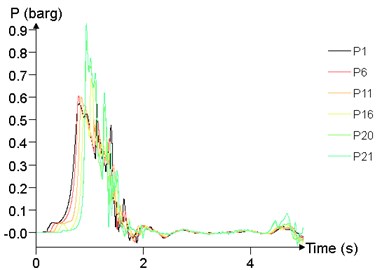
c)9.5 %
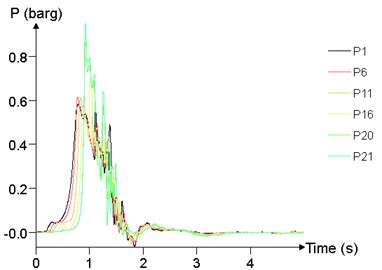
d)10.5 %
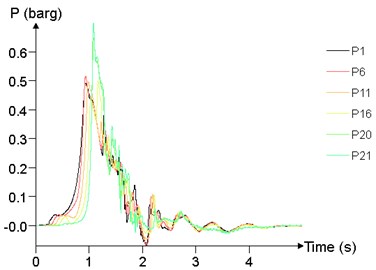
e)11.5 %
f)12.5 %
The relationship between peak of overpressure and concentration is given in Fig. 25. With the concentration between 7.5 % and 12.5 %, the peak of overpressure at each position tends to increase first and then decrease, and reaches the maximum at about 10 %.
Fig. 25The fitting curve of ΔP/P0Sv/L2-0.526/VL30.2115 and c
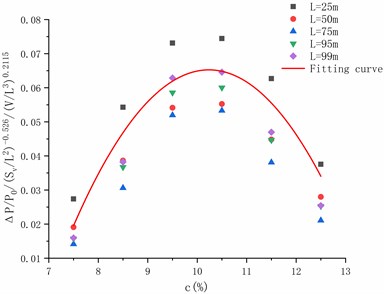
As seen from the Eq. (5), under the condition that , , are constant, the peak overpressure is only related to the concentration , that is:
And fitting the data of Fig. 23 according to the Eq. (6) to obtain a curve shown in the figure, wherein the fitting formula is as follows:
It can be seen from this formula that the peak of overpressure reaches the maximum value at 10.5 %, which is 1.07 times higher than the explosive equivalent concentration of 9.5 % methane.
Finally, it is noted that for Figs. 21 and 23, power curve fitting is used, whereas for Fig. 25, polynomial is used.
4. Conclusions
In this paper, by the means of experimental research, numerical analysis and theoretical calculation, the characteristics of natural blast load in the facility are studied, and the main research results are as follows:
1) The experimental research shows that when the concentration of methane is 10.5 %, the explosion test phenomenon is obvious, the peak of overpressure and the overpressure rise rate are the largest. When the methane concentration is greater than or less than 10.5 %, the peak overpressure and the maximum overpressure rise rate are reduced, and the time for reaching the maximum pressure is longer. When the ignition mode is chemical ignition, the propagation speed of flame is accelerated after explosion, and the peak of overpressure result is about 70 % higher than that of electrode ignition on average. In addition, the pressure relief vent can effectively reduce overpressure and impulse.
2) Based on the numerical calculation of natural explosion in a typical facility, it is found that the overpressure is the largest when concentration 9.5 %. With the increase of the volume of the mixed materials, the peak of overpressure is larger. With the increase of the distance from the ignition source, the peak of overpressure tends to decrease first and then increase. As the ignition position moves from the midpoint to the end of the cloud, the peak of overpressure increases first and then decreases.
3) Based on the numerical simulation results of the model, a formula for calculating the peak of overpressure of explosion in a typical facility is given. And the formula is related to the concentration , the volume , the initial pressure of mixed materials, and the distance from the ignition source, the pressure relief vent and the speed of the sound wave in the air, which provides a theoretical basis for the safety analysis of the facility. It is possible to theoretically improve the disaster prevention and disaster resistance capability of facility.
References
-
Bjerketvedt D., Bakke J. R., Wingerden K. V. Gas explosion handbook. Journal of Hazardous Materials, Vol. 52, Issue 1, 1997, p. 143-150.
-
Lewis B., Von Elbe G. Combustion, Flames and Explosions of Gases. Cambridge University Press, London, 1938.
-
Fairweather M., Hargrave G. K., Ibrahim S., Walker D. G. Studies of premixed flame propagation in explosion tubes. Combust, Vol. 116, Issue 4, 1999, p. 504-518.
-
Chow S. K., Cleaver R. P., Fairweather M., Walker D. G. An experimental study of vented explosions in a 3:1 aspect ratio cylindrical vessel. Process Surfaces Environments, Vol. 78, Issue 6, 2000, p. 425-433.
-
Tomlin G., Johnson D. M., Cronin P., Phylaktou H. N., Andrews G. E. The effect of vent size and congestion in large-scale vented natural gas/air explosions. Journal of Loss Prevent Proceedings, Vol. 35, Issue 4, 2015, p. 169-181.
-
Lowesmith B. J., Hankinson G., Johnson D. M. Vapour cloud explosions in a long congested region involving methane/hydrogen mixtures. Journal of Loss Prevent Proceedings, Vol. 89, Issue 4, 2015, p. 234-247.
-
Lowesmith B. J., Mumby C., Hankinson G., Puttock J. S. Vented confined explosions involving methane/hydrogen mixtures. International Journal of Hydrogen Energy, Vol. 36, Issue 3, 2011, p. 2337-2343.
-
Salzano E., Cammarota F., Benedetto A. D., Sarli V. D. Explosion behavior of hydrogen-methane/air mixtures. Journal of Loss Prevent Proceedings, Vol. 25, Issue 3, 2012, p. 443-447.
-
Kundu S., Zanganeh J., Moghtaderi B. A review on understanding explosions from methane–air mixture. Journal of Loss Prevent Proceedings, Vol. 40, Issue 2, 2016, p. 507-523.
-
Chyży T., Mackiewicz M. Simplified function of indoor gas explosion in residential buildings. Fire Safety Journal, Vol. 87, Issue 23, 2017, p. 1-9.
-
Ugarte O. J., Akkerman V. Y., Rangwala A. S. A computational platform for gas explosion venting. Process Surfaces Environments, Vol. 99, Issue 5, 201, p. 167-174.
-
Razus D. M., Krause U. Comparison of empirical and semi-empirical calculation methods for venting of gas explosions. Fire Safety Journal, Vol. 36, Issue 1, 2011, p. 1-23.
-
Cooper M. G., Fairweather M., Tite J. P. On the mechanisms of pressure generation in vented explosions. Combustion Flame, Vol. 65, Issue 1, 1986, p. 1-14.
-
Hansen O. R., Gavelli F., Davis S. G., Middha P. Equivalent cloud methods used for explosion risk and consequence studies. Journal of Loss Prevent Proceedings, Vol. 26, Issue 3, 2013, p. 511-527.
-
Hansen O. R., Hinze P., Engel D., Davis S. Using computational fluid dynamics (CFD) for blast wave predictions. Journal of Loss Prevent Proceedings, Vol. 23, Issues 6, 2010, p. 885-906.
-
Fang Y., Zou L. Q., Zhou J., Yaoz G., Lei S., Yang W. B. Field tests on the attenuation characteristics of the blast air waves in a long road tunnel: a case study. Shock Vibration, Vol. 10, Issue 4, 2019, p. 9693524.
-
Wei Xu H. H. J. Discussion on the teaching scheme of dimensional theory and dimensional analysis method. Physic and Engineering, Vol. 29, Issue 3, 2019, p. 25-28, (in Chinese).
About this article

