Abstract
Circular tunnels are widely used in infrastructure. Under the action of earthquakes, the destruction of circular tunnels will result in a large number of economic losses and casualties. Therefore, the study on shock absorption of tunnels is important. However, the research has not been sufficient on the effect of the damping layer on seismic response of a circular tunnel in sand. In this paper, the influence of the damping layer on the seismic response characteristics of circular tunnels in sand is studied by large-scale shaking table test. The actual El-centro wave is loaded to the model system in three directions during the tests. The input peak seismic acceleration values are 0.05 g, 0.1 g and 0.2 g. Then the effects of two different damping materials on the dynamic response characteristics of circular tunnels are analysed quantitatively. The test results show that the damping layer reduces the seismic response of the circular tunnel. The response accelerations of the tunnel bottom and crown without damping layer are greater than that with the damping layer, which indicates that damping layer absorbs the energy caused by the seismic motion. When the sponge rubber is used, the circular tunnel dynamic response is more attenuated than that with foam board. In conclusion, the shock absorbing layer can effectively reduce the seismic response of tunnel. As a result, the damage of the tunnel decreases under the earthquake. This study has clarified the isolation mechanism of the shock absorbing materials. It is recommended to use sponge rubber material as the shock absorbing layer.
Highlights
- The influence of different damping layers on the seismic response characteristics of circular tunnels is studied by large-scale shaking table test.
- The shock absorbing effect is compared with two types of isolation layers.
- The reason is analysed for different damping effect and the damping mechanism of isolation materials revealed.
1. Introduction
To date, tunnel structure has been widely used in public infrastructure. Seismologists have not been able to predict the occurrence of earthquakes accurately [1, 2]. When an earthquake occurs tunnel structure may be damaged. The failure of tunnel structure caused by earthquake would inevitably lead to the paralysis of infrastructure, which results in a large number of economic losses and casualties [3-6]. Therefore, it is extremely important work to improve the seismic performance of tunnels.
The existing analysis of seismic response of circular tunnel mainly focuses on analytical and numerical methods. Bobet [7] presented the closed-form solutions for the tunnel lining under the static and seismic loadings. The drainage conditions between soil and tunnel lining interface do not affect the liner stress with the static loading. During the seismic loading, the deformation of liner is affected by the relative flexibility between the soil and the tunnel lining. According to Hasheminejad and Kazemirad [8], the analytical solution of the hoop stress was developed for eccentric tunnel lining under seismic excitements. The results showed that hoop stress increases with liner wall eccentricity. Park et al. [9] derived new analytical solution of tunnel lining without slip between soil and liner. The soil-liner deformation ratio is related to the compressibility and flexibility ratios without slip interface. In the view of numerical solutions, Patil et al. [10] analysed the effects of depth and shape of tunnel on the seismic response of tunnel in soft soils by finite element method. The influence of relative rigidity between soil and tunnel on the stress of tunnel lining is significant under earthquake loading according to Zlatanović et al. [11]. Ma et al. [12] studied the buried depth effect on the dynamic response of underground structure under seismic events. There is a depth that the deformation of underground structure is the maximum. The analytical and numerical solutions have not been verified. Hence, it is necessary to conduct model tests to reflect the seismic response characteristics of tunnels. Centrifuge test and shaking table test are two main model tests to study the dynamic response of underground structures. Shaking table test can input large amplitude seismic acceleration in three directions. Meanwhile, it is easy to install model materials and monitoring instruments. Based on the change of dominant frequency, Wang et al. [13] analysed the damage state of tunnel lining under earthquake loading. Kawamata et al. [14] pointed out that tunnel strain is determined by the ground deformation according to the strain time history of tunnel and ground displacement time history. Wang et al. [15] studied the effect of above ground structure on the tunnel dynamic response under seismic excitements. It was found that surface structure reduces the tunnel acceleration response. However, these studies don’t consider the effect of isolation layer on the dynamic response of tunnels.
Centrifuge tests can restore the actual site conditions. A series of centrifuge tests are conducted to study the effect of shock absorption layer on the dynamic response of tunnels under earthquake excitations. Chen and Shen [16] showed that the frequency of seismic wave affects the tunnel dynamic response. The damping effect of isolation layer reduces with increasing frequency. The isolation mechanism of shock absorption layer is that it absorbs the soil deformation under seismic loading. Further, Chen et al. [17] studied the transverse section dimension effect on the tunnel dynamic response. It showed that the bending moment responses increases with the rise of transverse section dimension. Shaking table test can reproduce a variety of ground motions and simulate the whole process of earthquake. It can be used to study the effect of earthquake on the structure. However, there is little research on the effect of different damping materials on the dynamic response of circular tunnels in sand using large-scale shaking table tests. Through large-scale model tests, the influence of different shock absorbing materials on the dynamic response of tunnels can be obtained, which could provide important reference for seismic design of circular tunnels.
The main purpose of this paper is to study the seismic response of tunnel with different shock absorbing materials. Moreover, the shock absorbing effect is compared with two types of isolation layers. Finally, the reason is analysed for different damping effect and the damping mechanism of isolation materials revealed.
2. Shaking table test
2.1. Shake table system
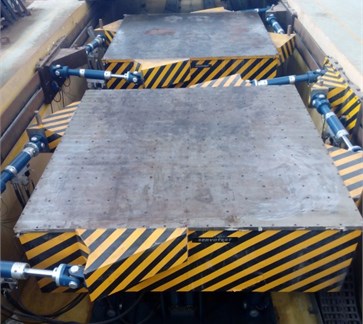
The test system is mainly composed of four parts: two six-degree-of-freedom (DOF) shaking tables, adjusting system of movable table, digital control system and hydraulic power source. The shaking table is 4 meters in both length and breadth. The two shaking tables are built on the same straight line. They can be used independently or in combination. Both shaking tables have the characteristics of three-dimensional six-degree-of-freedom, large stroke and wide bandwidth. Main technical parameters of shaking table are listed in Table 1. Fig. 1 shows the two shaking tables used in the test.
2.2. Model box
A larger model box is designed to reflect the seismic response of circular tunnel in sandy soil realistically. The length (), width () and height () of the model box are 9.3 m, 3.7 m and 2.5 m, respectively. Fig. 2 shows the model box used in the test. The wall of the model box is 6 mm thick steel plate while the bottom is 5 mm thick steel plate. The top of model box is opening without steel plate. Moreover, angle steel is arranged on the outside wall and inner bottom of the model; channel steel is arranged on the inside wall of the model box. Both angle steel and channel steel contribute to increasing the stiffness of the model box. Two horizontal braces are evenly arranged along the length direction at the top of the model box, which improves the overall stability of the model box. In addition, four lifting lugs are installed at the connection position between transverse brace and the box wall for loading and unloading of the model box. The total weight of the model box is 3.8 tons. The model box is fixed on the shaking table by high-strength bolts, which provides guarantee for the late work.
Table 1Technical index of the shaking table
Technical index | Shaking table |
Length (m)×breadth (m) | 4×4 |
Number of DOF | 6 |
Maximum specimen quality (ton) | 30 |
Maximum displacement in direction (mm) | 250 |
Maximum displacement in direction (mm) | 250 |
Maximum displacement in direction (mm) | 250 |
Maximum acceleration in direction (g) | ±0.8 |
Maximum acceleration in direction (g) | ±0.8 |
Maximum acceleration in direction (g) | ±1.6 |
Maximum velocity in direction (mm/s) | ±1000 |
Maximum velocity in direction (mm/s) | ±1000 |
Maximum velocity in direction (mm/s) | ±1000 |
Maximum overturning moment (ton·m) | 30 |
Operating frequency range (Hz) | 0.1-50 |
Fig. 1Shaking tables
To reduce the influence of boundary effect, foam board with thickness of 10 cm is attached to the model box wall [18, 19]. At the same time, a layer of coarse aggregate with a diameter of 3 cm is placed at the bottom of the model box, which increases the friction and prevents the soil slippage from the bottom of the model box.
2.3. Model tunnel and soils
Taking length, mass density and elastic modulus of tunnel as basic dimensions, the similarity ratios of physical quantities are deduced by dimensional analysis [20, 21]. The scaling factor of strain equals one because stain is a dimensionless quality. Table 2 lists the similarity ratios of tunnel structural parameters. The prototype of the tunnel is 7.2 m diameter and 0.48 m thickness. The diameter and thickness of the model tunnel are 0.9 m and 0.06 m respectively according to the scaling factor of length.
Fig. 2Model box: a) outside of model box, b) inside of model box
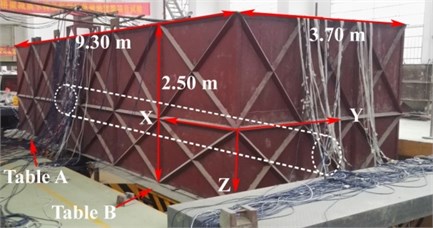
a)
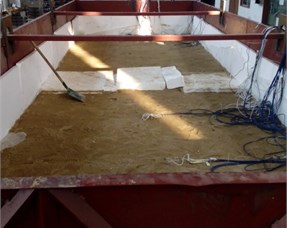
b)
Table 2Scaling factors for model tunnel
Quantity | Model/prototype | Values |
Length | 1/8 | |
Density | 4/5 | |
Elastic modules | 1/10 | |
Acceleration | 1 | |
Stress | 1/10 | |
Strain | 1 | |
Time | 0.354 | |
Frequency | 2.828 |
The sand used in the experiment is taken from the Xiangjiang River in Hunan Province, China. Fig. 3 shows the grain size distribution curve of the tested sand. The sand belongs to the scope of SP on the basis of the Unified Soil Classification System. The water content of sand is 4.8 %. The predefined relative density of sand is 64 %. To remain the uniform of sand in the model box, the sand is compacted by hammer layer by layer, and the height of each layer is 10 cm. After each layer is compacted, three samples from different locations are taken to measure the dry densities, which is used to check the sand compactness. Table 3 shows the basic physical and mechanical parameters of sand.
Fig. 3Grain size distribution of sand
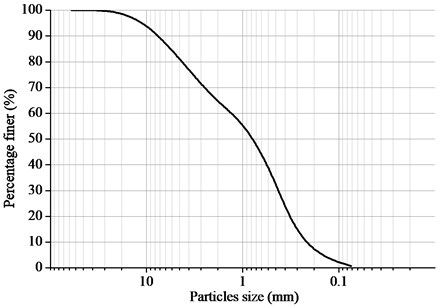
Table 3Physical and mechanical parameters of sand
Dry density (kg/m3) | Cohesion (kPa) | Internal friction angle (°) | Poisson’s ratio |
1570 | 1.5 | 28.6 | 0.243 |
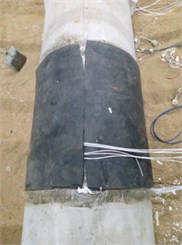
Based on the scaling law, the model tunnel is made of micro-concrete. The length of a single model tunnel lining is 1 m, and nine identical model tunnel linings are made. A steel mesh is buried into the model tunnel to simulate the prototype tunnel. The diameter of the steel mesh is 6 mm with spacing of 10 mm. Table 4 shows the mechanical parameters of the model tunnel. In order to study the influence of different shock absorbing layers on the seismic response of tunnel, foam board and sponge rubber are wrapped in tunnel lining respectively. The thickness of foam board and sponge rubber is 5 cm. Fig. 4 and Fig. 5 show tunnel linings wrapped with two kinds of shock absorbing materials respectively. The stiffness of shock absorbing materials is measured by uniaxial compression tests, and the damping ratio is attained by cyclic compression tests. Table 5 is the mechanical parameters of two kinds of shock absorbing materials. Foam board and sponge rubber fall into the category of low density porous materials. These materials are easy to deform because the stiffness of the materials are small. The foam board is squeezed when it is subject to seismic loading. As to sponge rubber, the void is extruded when the material is under the dynamic loading. When seismic wave propagates to damping materials from the soil, the velocity of propagation slows down because of the low impedance of both materials. The frequency of the seismic wave remains constant at the material interface. Hence, the wavelength of seismic wave decreases in both materials. Therefore, seismic wave energy dissipates.
Fig. 4Foam board around the tunnel
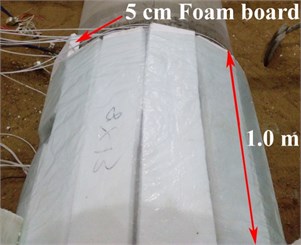
Fig. 5Sponge rubber around the tunnel
The steps of how to install the model station are as follow: Firstly, at the base of the soil container, a layer of 2-3 cm diameter aggregate is placed to increase the frictional resistance between the model sand and the floor to reduce potential slippage. Secondly, the sand is poured into the model box with a large hopper. The compactness of the sand is preliminarily controlled by the height of the hopper and the size of the opening at the bottom of the hopper. When the sand is buried to a height of 30 cm, nine model tunnels are installed in the middle of the soil container along the direction. Then the sand is placed to the height of 191 cm.
Table 4Mechanical parameters of tunnel lining
Density (kg/m3) | Elastic modulus (GPa) | Poisson’s ratio | Yield strength (MPa) |
1900 | 3 | 0.23 | 6 |
Table 5Mechanical parameters of shock absorbing materials
Material type | Density (kg/m3) | Young’s modulus (kPa) | Poisson’s ratio | Damping (%) |
Foam | 12 | 16 | 0.29 | 14 |
Sponge rubber | 10 | 12 | 0.25 | 30 |
2.4. Measuring instruments and layout
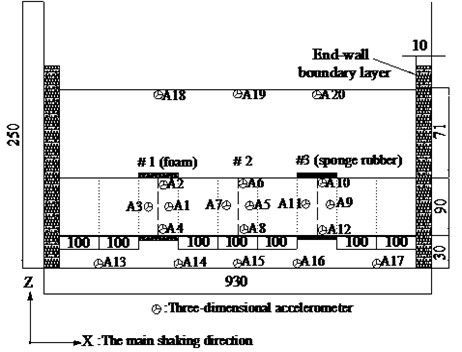
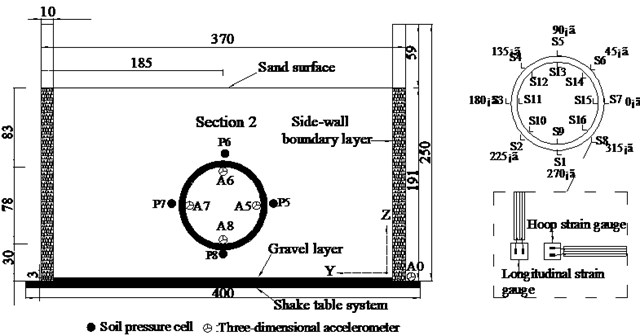
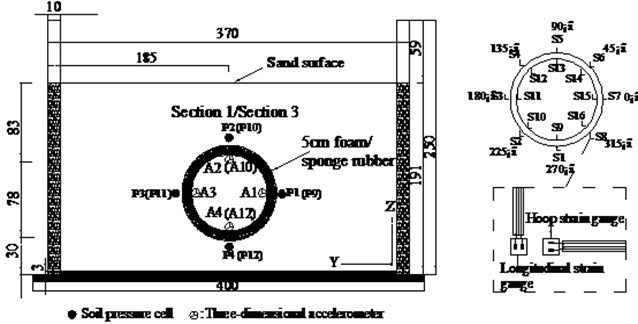
Fig. 6(a) displays the layout of the tunnel model. The length of the tunnel model is 9.0 m. The depth of the tunnel is 0.71 m, and the tunnel model is 0.3 m away from the bottom of the box. There are three monitoring sections from left to right of the tunnel model, which are named section 1, section 2 and section 3 respectively. Tunnel lining of section 1 is wrapped by foam board, while tunnel lining of section 3 is wrapped by sponge rubber. There is no shock absorbing material around the tunnel lining of Section 2. Five accelerometers (A13-A17) are arranged along the longitudinal direction () of the model box to obtain the basic frequency of the model box. To verify the effect of the boundary effect, three accelerometers (A18-A20) are placed on the soil surface for the free field test.
Fig. 6Sensors arrangement (Unit: cm): a) schematic arrangement of monitoring sections, b) transverse section 2 arrangement of sensors, c) transverse section 1 and 3 arrangement of sensors
a)
b)
c)
The transverse section of Section 2 is shown in Fig. 6(b). It shows the locations of all monitoring instruments, which includes four accelerometers (A5-A8), four earth pressure gauges (P5-P8) and thirty-two strain gauges (S1-S16). The accelerometers are wrapped with fresh-keeping films to reduce the influence of external environment. After the connection of conductor and accelerometer is sealed, they are adhered to the inner surface of tunnel lining. The accelerometer is used to measure the acceleration response of the tunnel lining in three directions. The inner and outer surfaces of tunnel liner are polished with sandpaper to paste the strain gauges. Then the wire and strain gauge are firmly attached to the tunnel lining with epoxy resin. The earth pressure gauge is used to record the dynamic earth pressure value of tunnel lining. Similarly, the earth pressure gauges are wrapped with plastic films and pasted on the outer surface of the liner. The circumferential strain and longitudinal strain of tunnel lining are measured by strain gauges. The accelerometer A0 is installed on the shaking table to record the actual input seismic motion. Before the tests, the monitoring instruments are debugged and then adjusted to zero.
Fig. 6(c) displays the transverse section of Sections 1 and 3. The number and position of monitoring instruments are the same as that of Section 2.
2.5. Test program
Before the tests, the natural frequencies of the model box and the model box with sand are obtained by sweeping frequency with white noise. The peak acceleration of white noise is 0.03 g. The longitudinal direction () is the main direction of excitation. Hence, the fundamental frequency of the model box is mainly considered along the longitudinal direction (). The predominant frequency of the model box is 35.31 Hz in the direction; the predominant frequency of the model box with sand is 3.82 Hz. It is clear that the predominant frequency of the model box is much larger than that of the free field of model, which suggests that there is no resonance between the model box and the sand site. The stiffness of model box in direction is much greater than that of sand site in direction.
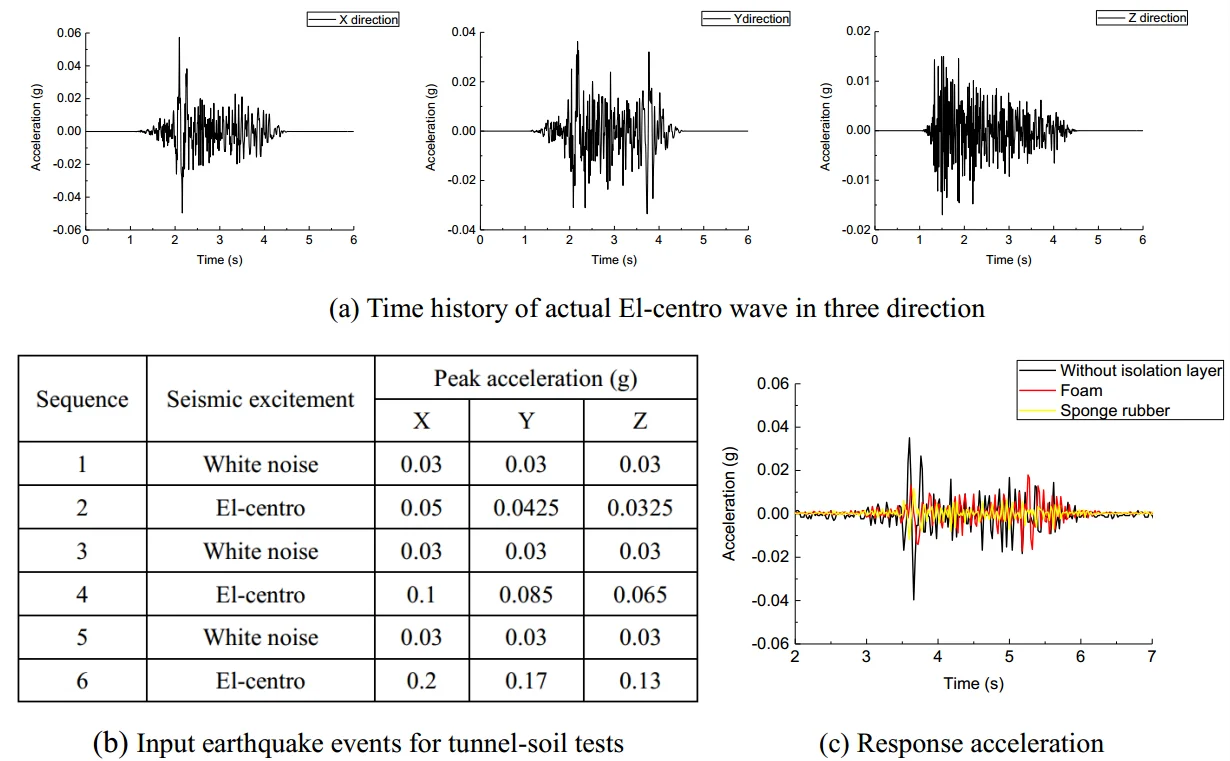
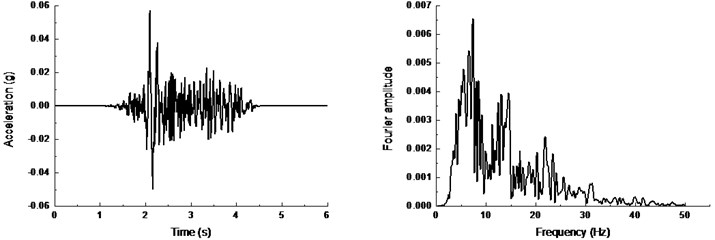
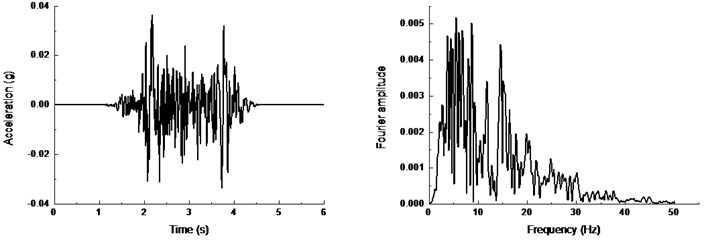
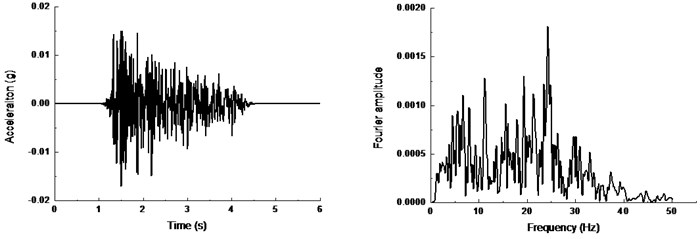
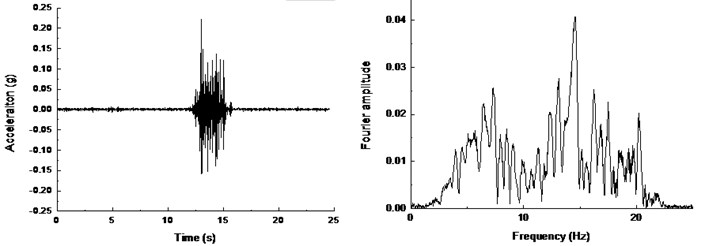
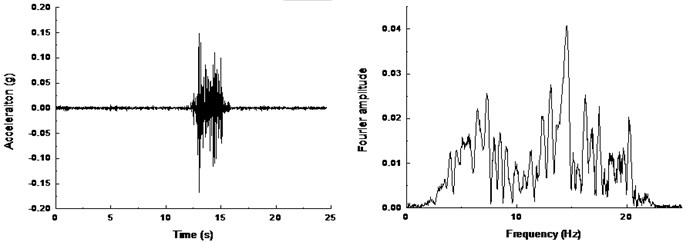
The input ground motion has a great influence on the seismic response of tunnel. In the paper, the actual recorded seismic wave is used as the input ground motion, which reflects the seismic response of the tunnel authentically. El-centro wave is selected as input ground motion for three-dimensional loading. Fig. 7 shows the acceleration time history and Fourier amplitude of the of El-centro motions in three directions. The input peak acceleration increases gradually to reduce the cumulative damage of test materials caused by multiple vibrations. Table 6 and Table 7 show the loading sequence and magnitude of input seismic excitements in the free-field and tunnel-soil tests.
Table 6The sequence of input earthquake events for free field tests
Sequence | Seismic excitement | Peak acceleration (g) | ||
1 | White noise | 0.03 | 0.03 | 0.03 |
2 | El-centro | 0.1 | 0.085 | 0.065 |
Table 7The sequence of input earthquake events for tunnel-soil tests
Sequence | Seismic excitement | Peak acceleration (g) | ||
1 | White noise | 0.03 | 0.03 | 0.03 |
2 | El-centro | 0.05 | 0.0425 | 0.0325 |
3 | White noise | 0.03 | 0.03 | 0.03 |
4 | El-centro | 0.1 | 0.085 | 0.065 |
5 | White noise | 0.03 | 0.03 | 0.03 |
6 | El-centro | 0.2 | 0.17 | 0.13 |
Fig. 7Time history and frequency content of actual El-centro wave: a) in x direction, b) in y direction, c) in z direction
a)
b)
c)
3. Results and discussions
Data obtained from the experiments will be analysed as follows. The test results of the tunnel bottom and crown are fully studied to reflect the dynamic response characteristics of tunnels and shock absorption effect of different isolation materials.
3.1. Experiment verification
Fig. 8 shows the acceleration response of soil surface under input peak acceleration of 0.1 g in free field test. The acceleration time histories curve and the Fourier amplitudes are almost similar for the positions with different distances away from the boundary. It suggests that the boundary effect can be neglected in the tests, which provides assurance for relevant test results.
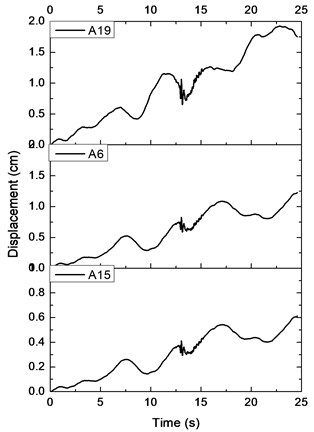
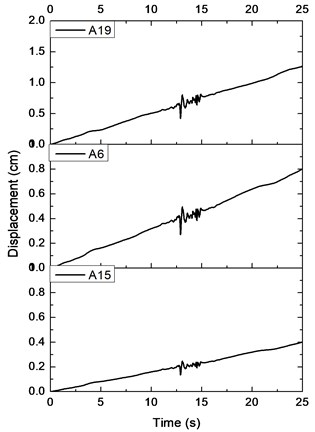
Fig. 9 plots the displacement time histories of soils at the bottom (A15), a depth of 71 cm (A6) and the soil surface (A19) in the free field test under the input seismic acceleration of 0.1 g. It suggests that the displacement of the soils increases from the base to the ground surface. The result is consistent with reports of many other researchers [22-24].
Fig. 8Time history and frequency content of soil surface: a) A18, b) A19, c) A20
a)

b)
c)
3.2. Isolation layer effects on acceleration response
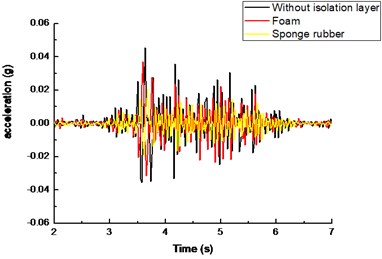
Fig. 10 shows the acceleration time history curve of circular tunnel under the input seismic acceleration of 0.05 g. From Fig. 10(a), it can be seen that the acceleration response of tunnel bottom with different isolation materials is consistent with the tunnel without isolation layer. In other words, the beginning and ending response points are basically the same. The acceleration response of the tunnel structure is determined by the response of the surrounding soil under the earthquake events. There is the same stratum condition for model tunnel with and without shock absorbing layer. As a result, the acceleration response is consistent.
Decreases can be also observed in the peak acceleration of tunnel bottom with shock absorbing materials. The peak acceleration is the smallest when sponge rubber is used as shock absorbing material, which means that sponge rubber plays a very good role in shock absorption.
It is believed that the deformation of the surrounding soils determines the seismic response of the tunnel. The ground condition around the tunnel is the same with or without shock absorption layer. Therefore, the difference between deformation or relative displacement of foundation should be little. Hence, the seismic reduction mechanism of isolation materials is absorbing the deformation from the surrounding soils. As a result, the acceleration decreases.
Fig. 9Displacement time history along the soil depth: a) in x direction, b) in y direction
a)
b)
Fig. 10Acceleration time history with different isolation layers: a) tunnel bottom, b) tunnel crown
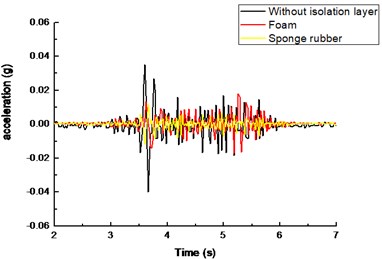
a)
b)
Compared with Fig. 10(a) and 10(b), it can be seen that the peak acceleration of tunnel crown is greater than that of tunnel bottom with or without the shock absorption layer. The paces of acceleration time histories are similar for tunnel crown and bottom. Meanwhile, the response time of the peak acceleration is basically the same for the two different locations. The shock absorption effect of isolation materials at the tunnel crown is similar to that at the tunnel bottom according to Fig. 10(b).
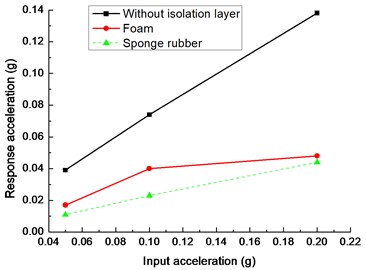
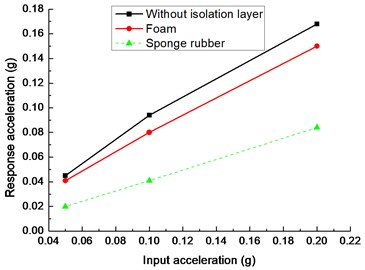
Fig. 11 shows the peak acceleration in direction of the tunnel bottom and crown with the different absorbing materials under the El-centro excitation. It can be seen that the maximum accelerations with the isolation layer are lower than the values without isolation layer under different excitation levels. It means that the isolation layer reduces the peak acceleration response of tunnel. Moreover, the peak accelerations with the sponge rubber as the isolation layer are lower than the values with foam isolation layer, which suggests that sponge rubber absorbs more energy than foam under the El-centro excitation.
From Fig. 11(a), both foam and sponge rubber decrease the peak acceleration of tunnel bottom effectively compared to the values without isolation layer under the input earthquake acceleration of 0.05 g. With the increase of excitation, the foam increases the shock absorption effects. When the input earthquake acceleration increases from 0.05 g to 0.2 g, the ratio of peak acceleration of tunnel bottom with foam to that without the isolation layer decreases from 43.58 % to 34.78 %. However, the ratio of peak acceleration of tunnel bottom with sponge rubber to that without the isolation layer is close to 30 % with the increase of input acceleration.
Fig. 11Peak acceleration of tunnel with different isolation layers: a) tunnel bottom, b) tunnel crown
a)
b)
In Fig. 11(b), sponge rubber decreases the peak acceleration of tunnel crown significantly while the foam has limited effect on the reduction of peak acceleration under different excitation levels. When the input earthquake acceleration is 0.05 g, 91.11 % is the ratio of peak acceleration of tunnel crown with foam to that without the isolation layer; 44.44 % is the ratio of peak acceleration of tunnel crown with sponge rubber to that without the isolation layer.
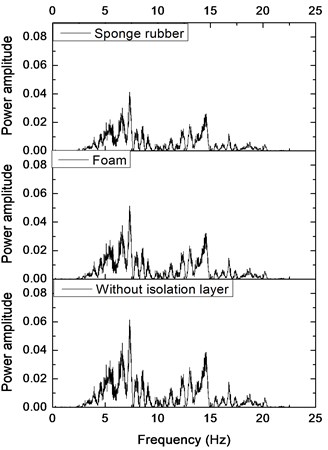
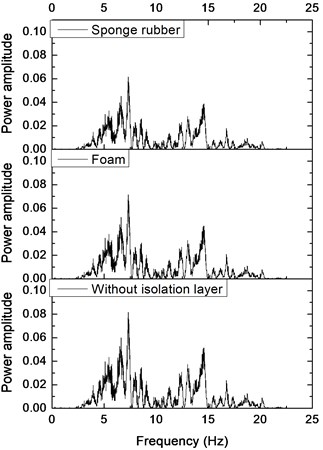
Fig. 12 shows power spectrum density of the tunnel bottom and crown with the different absorbing materials under the El-centro excitation of 0.1 g. It can be seen that the power spectrum amplitude of the tunnel is the largest without the damping materials. The area enclosed by the curve and abscissa is also the largest. It suggests that the tunnel without shock absorbing materials is subject to the highest seismic energy. Besides, the power spectrum amplitude of tunnel with sponge rubber is smaller than that with foam, which indicates that the damping effects of sponge rubber is better than that of foam.
Fig. 12Power spectrum density of tunnel with different isolation layers: a) tunnel bottom, b) tunnel crown
a)
b)
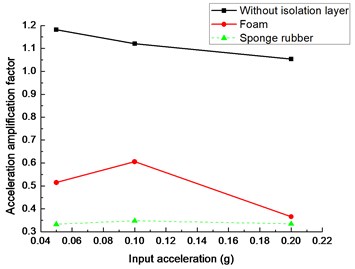
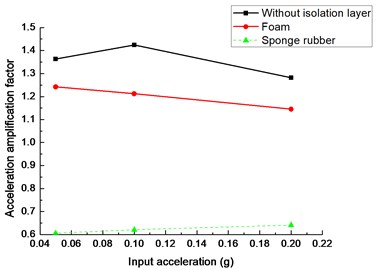
The ratio of peak acceleration of tunnel to the input acceleration is acceleration amplification factor, which reflects the acceleration response of tunnel under different earthquake excitations levels. Fig. 13(a) shows the amplification factor of tunnel bottom with different isolation layer under three input accelerations (i.e. 0.05 g, 0.1 g and 0.2 g). It is observed that all of the amplification factors with the isolation layer are less than 1.0 while the amplification factors without isolation layer are more than 1.0. It suggests that the isolation layer decreases the acceleration response obviously. Compared with the foam and sponge rubber materials, it shows that amplification factor with the sponge rubber is lower than the corresponding value with the foam under the same input acceleration, which indicates that sponge rubber is better than the foam to reduce the acceleration response.
The isolation layer also decreases the amplification factors of tunnel crown compared to the results without isolation layer in Fig. 13(b). However, the amplification factors of tunnel crown with foam are larger than 1.0. It implies that the foam has limited effect to reduce the peak acceleration of the tunnel crown. The amplification factors of tunnel crown with sponge rubber are less than 0.7 under different input acceleration levels, which means the sponge rubber decreases the acceleration response significantly.
Fig. 13Acceleration amplification factor of tunnel with different isolation layers: a) tunnel bottom, b) tunnel crown
a)
b)
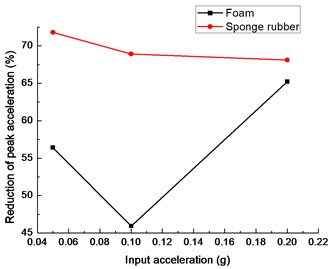
To quantify the reduction of peak acceleration with isolation layer, reduction percentage of peak acceleration is defined as follows:
where is the reduction percentage of peak acceleration. and are the peak acceleration of tunnel with and without the isolation layer respectively.
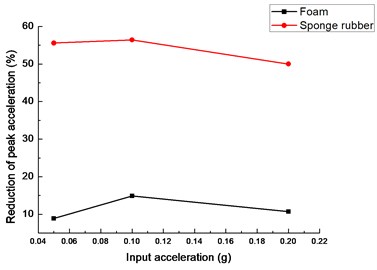
Fig. 14 indicates that reduction of peak acceleration of tunnel bottom and crown with sponge rubber is larger than the reduction with foam, which suggests that the sponge rubber is better than foam in shock absorption of tunnel.
In Fig. 14(a), the maximum acceleration reductions of tunnel bottom with sponge rubber are more than 65 % under different input acceleration levels compared to the maximum acceleration response of tunnel bottom without isolation material. With the increase of input acceleration, the reduction of peak acceleration decreases firstly and then increases for the foam. The minimum reduction of peak acceleration is 45.94 % with the input acceleration of 0.1 g.
From Fig. 14(b), the reduction percentages of response acceleration of tunnel crown are more than 50 % with the sponge rubber under different input peak acceleration. It indicates the sponge rubber has significant effect in tunnel shock absorption. However, the acceleration reduction of tunnel crown is less than 20 % with the foam under input acceleration from 0.05 g to 0.2 g. Thus, there is limited effect with foam to reduce the acceleration response under seismic excitations.
Fig. 14Peak acceleration reduction of tunnel with different isolation layers: a) tunnel bottom, b) tunnel crown
a)
b)
3.3. Isolation layer effects on strain
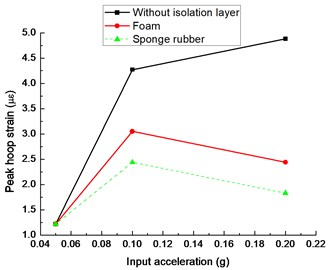
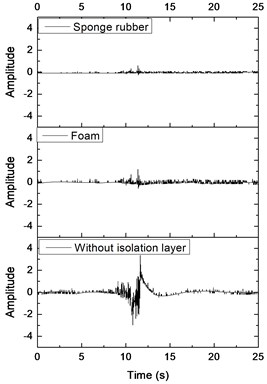
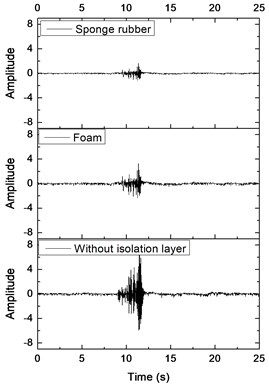
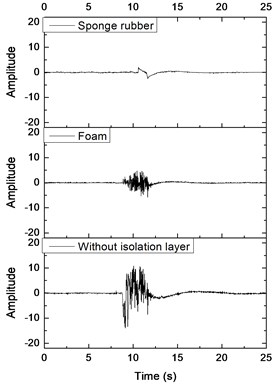
Fig. 15 shows the hoop strain time history of tunnel under the El-centro excitation of 0.1 g. It shows that the time of peak hoop strain is basically the same, which suggests that the test is reliable. Deformation behaviors of tunnel lining are analysed by the maximum strain amplitude recorded by the stain gauges. Fig. 16(a) shows the maximum hoop strain of tunnel bottom with different isolation materials under three seismic excitations. As the input acceleration is 0.05 g, the peak hoop strains with different shock absorption materials are small. The maximum strain is less than 5 με. There is little effect of isolation layer on the hoop strain response. With the increase of input acceleration, the effect of shock absorption layer begins to appear. When the input seismic acceleration is 0.2 g, the peak hoop strain of tunnel bottom with sponge rubber is the smallest. Meanwhile, the maximum hoop strain of tunnel bottom with foam is less than that of tunnel without isolation layer.
Fig. 15Strain time history of tunnel with different isolation layers: a) tunnel bottom, b) left side wall of tunnel, c) tunnel crown
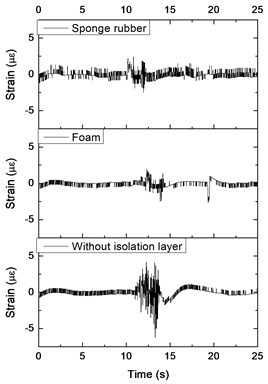
a)
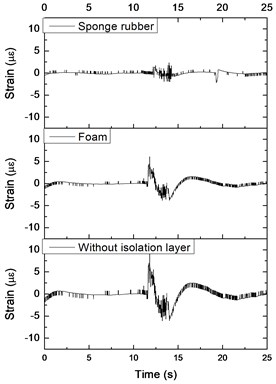
b)
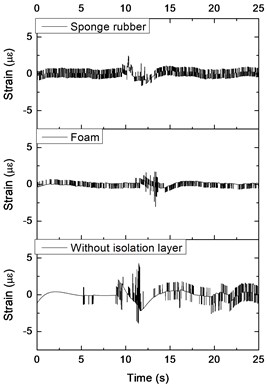
c)
Fig. 16(b) shows the maximum hoop strain of left side wall (S11) with different shock absorbing materials under three seismic excitations. Peak hoop strains with different shock absorption materials are small as the input motion is 0.05 g. The values of hoop strains increase with the advance of input seismic acceleration. Moreover, with the increase of input seismic acceleration, the effect of shock absorption layer becomes prominent. When the input motion is 0.1 g, the peak value of hoop strain of the left side wall (S11) with sponge rubber is only 26.30 % of that without the isolation material. The damping effect of the foam is weaker than the sponge rubber, and the hoop strain peak of the left side wall (S11) is 63.15 % of that without the shock absorbing layer. However, the effect of shock absorption layer is weakened with the further increase of seismic acceleration.
From Fig. 16(c), the values of peak hoop strains of tunnel crown are the same for different shock absorption materials as the input motion is 0.05 g. It implies that there is no damping effect when the input acceleration is small. With the increase of input acceleration, the hoop strains of tunnel crown with isolation material are smaller than those without isolation layer. Thus, the damping effect of isolation layers becomes obvious. In addition, the maximum hoop strain of tunnel crown with sponge rubber is the minimum. As the input seismic excitement is 0.2 g, the peak strain of tunnel crown with sponge rubber is 37.49 % of that without isolation material, and the maximum strain with foam is 49.98 % of that without isolation layer.
Fig. 16Peak hoop strain of tunnel with different isolation layers: a) tunnel bottom, b) left side wall of tunnel, c) tunnel crown
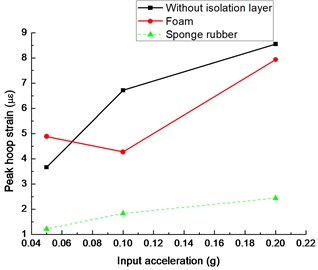
a)
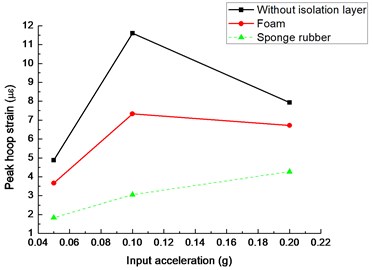
b)
c)
According to Fig. 16, it can be concluded that the circumferential strain of the tunnel is smaller than that of tunnel without a shock absorption layer, which shows that the existence of the shock absorption layer has positive effect on dynamic strain response. Comparing with two different damping materials, the damping effect of sponge rubber is better than that of foam.
Table 8 shows the maximum hoop strain reduction of tunnel with foam and sponge rubber under different earthquake excitations. The reduction percentage of hoop strain is defined as follows:
where is the reduction percentage of peak strain. and are the peak strain of tunnel with and without the isolation layer respectively.
Table 8Reduction of the maximum hoop strain with different shock absorbing materials
Location | Isolation material | Reduction percentage (%) |
Tunnel bottom | Foam | 7.13 |
Sponge rubber | 71.43 | |
Left side wall | Foam | 36.84 |
Sponge rubber | 73.69 | |
Tunnel crown | Foam | 50.01 |
Sponge rubber | 62.50 |
According to Table 8, the maximum hoop strain of tunnel reduces with the shock absorbing materials. At tunnel bottom, the reduction of peak strain with foam is less than 10 %. However, the reduction is larger than 70 % with the sponge rubber. For different location of tunnel, the reduction varies with the same isolation layer. At tunnel crown, the reductions of hoop strain are larger than 50 % for both foam and sponge rubber. Meanwhile, the reduction with foam is less than that with sponge rubber.
3.4. Isolation layer effects on soil pressure
The earth pressure boxes are installed horizontally at the bottom and crown of the tunnel. The vertical dynamic soil pressures are measured. At the left side wall of the tunnel, the earth pressure boxes are placed vertically, which measures lateral earth pressure. Fig. 17 plots data measured by the soil pressure gauges under the El-centro excitation of 0.1 g. The data measured by the soil pressure gauges need to be converted to acquire the soil pressure.
Fig. 17Data measured by the soil pressure gauges: a) tunnel bottom, b) left side wall of tunnel, c) tunnel crown
a)
b)
c)
Fig. 18(a) describes the relation between dynamic soil pressure and input seismic acceleration with different isolation materials. According to Fig. 18(a), the dynamic earth pressures are small with and without the shock absorbing material as the seismic acceleration is 0.05 g in direction. The shock absorbing effect of the foam and sponge rubber gradually appears with the increase of the seismic acceleration. When the seismic acceleration increases to 0.1g, the earth pressure value at the tunnel bottom with sponge rubber is only 14.32 % of that without isolation materials. However, the peak earth pressure of tunnel bottom with foam is 89.07 % of that without shock absorbing layer. The damping effect of the foam increases with further increase of input acceleration.
In Fig. 18(b), dynamic soil pressures of the tunnel left side wall with damping materials are less than that without damping material when the input seismic acceleration is 0.05 g. Meanwhile, dynamic soil pressures of the left side wall are the same with different isolation layers. With the increase of input seismic acceleration, dynamic soil pressure of left side wall with sponge rubber is less than that with foam. When the input acceleration is 0.2 g, earth pressure of the left wall with sponge rubber is 33.65 % of that without isolation layer; earth pressure with foam is 68.43 % of that without isolation material.
From Fig. 18(c), dynamic earth pressures of tunnel crown with isolation layer are smaller than that without isolation material for the same input seismic acceleration. Soil pressure of tunnel crown with the sponge rubber is the minimum. With the increase of input peak acceleration, soil pressure of tunnel crown without shock absorbing layer increases significantly compared to the increase of soil pressure with isolation layer.
Fig. 18Peak dynamic soil pressure of tunnel with different isolation layers: a) tunnel bottom, b) left side wall of tunnel, c) tunnel crown
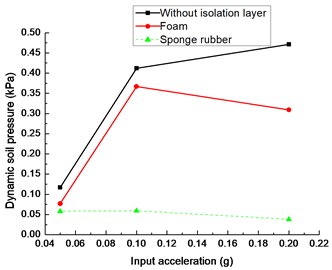
a)
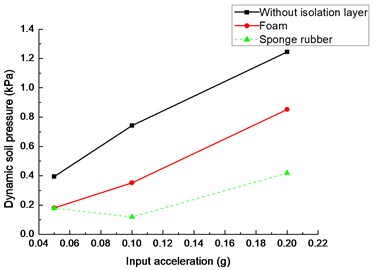
b)
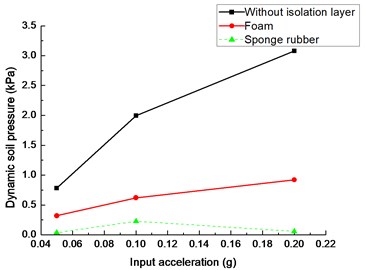
c)
In summary, dynamic earth pressure of the tunnel with isolation is less than that without isolation layer under the same input acceleration, which suggests that the shock absorption layer reduces the soil pressure response effectively. Comparing with two different damping materials, soil pressure of tunnel with sponge rubber is smaller than that with foam for the same input acceleration. Therefore, damping effect of sponge rubber is better than that of foam. With the increase of seismic acceleration, the difference becomes larger between dynamic earth pressure with and without shock absorption layer, which indicates that the shock absorption layer decreases the soil pressure effectively.
The reduction percentage of dynamic soil pressure is defined as follows:
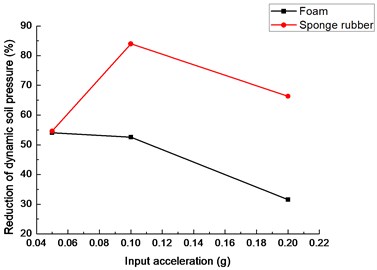
where is the reduction percentage of peak strain. and are the peak dynamic soil pressure of tunnel with and without the isolation layer respectively. Fig. 19 shows the reduction percentage of peak dynamic soil pressure at different locations of tunnel. With the increase of input seismic acceleration, the change rule of soil pressure reduction varies at different locations of tunnel.
In Fig. 19(a), the soil pressure reduction of tunnel bottom with sponge rubber increases with the rise of seismic excitements. However, the reduction of dynamic soil pressure firstly decreases and then increases with the foam as the input peak acceleration boosts. Moreover, the reductions of soil pressure with sponge rubber are more than 50 % compared to that without isolation layer. However, dynamic soil pressure with foam decreases less than 35 % of that without shock absorbing material.
Fig. 19(b) describes the dynamic soil pressure reduction of left side wall of tunnel under different earthquake excitements. With the increase of input acceleration, soil pressure reduction with sponge rubber firstly increases and then decreases. The maximum of reduction is more than 80 % when the input seismic acceleration is 0.1 g. In addition, the reduction of dynamic soil pressure decreases with input peak acceleration for foam. The reduction is less than 55 % for the foam under different peak acceleration.
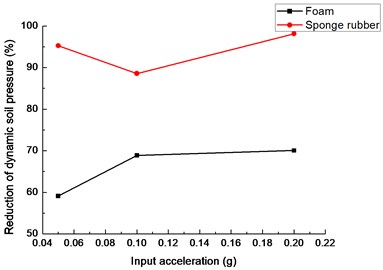
Fig. 19(c) shows dynamic soil pressure reduction of tunnel crown with foam and sponge rubber under three peak acceleration excitements (i.e. 0.05 g, 0.1 g, 0.2 g). The reductions of soil pressure with sponge rubber are larger than 85 % compared to that without isolation layer. The reductions with foam are less than 70 % of that without isolation material.
Fig. 19Peak dynamic soil pressure reduction of tunnel with different isolation layers: a) tunnel bottom, b) left side wall of tunnel, c) tunnel crown
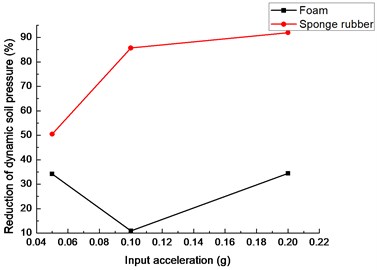
a)
b)
c)
4. Conclusions
A series of large-scale shaking table model tests are carried out to analyze the influence of different shock absorbing materials on seismic response of circular tunnel in sand. Through the quantitative analysis of the test results, the following important conclusions are drawn.
1) The acceleration response of tunnel reduces for both shock absorbing materials. Sponge rubber has a significant effect on reducing the peak acceleration of tunnel. The reduction of peak acceleration of tunnel is more than 50 % under different seismic excitements. The damping effect of foam board is not stable. The reduction of tunnel bottom is larger than 65 %, while there is less than 20 % for the tunnel crown.
2) Under input seismic motions, the peak hoop strain of tunnel with isolation layer decreases compared to that without the isolation layer. The reduction percentage of peak circumferential strain is more than 60 % with the shock absorbing material of sponge rubber. However, the maximum reduction of peak circumferential strain with foam is less than 50.01 %.
3) Both foam board and sponge rubber reduce the dynamic earth pressure under earthquake excitements. At different locations of tunnels, the reduction of soil pressure with sponge rubber is greater than that with foam. The reduction of soil pressure varies at different location of tunnel with sponge rubber. The reduction of tunnel vault is greater than 85 %, while the reduction is about 50 % at the tunnel bottom under the input peak acceleration of 0.05 g.
4) The energy reduction varies with the different absorbing materials. The damping ratio of sponge rubber is larger than that of foam, which suggests that energy dissipated by sponge rubber is more than that by foam. The experimental results show that energy absorbing effect of sponge rubber is better than that of foam board.
References
-
Florido E., Martínez-Álvarez F., Morales-Esteban A., Reyes J., Aznarte-Mellado J. L. Detecting precursory patterns to enhance earthquake prediction in Chile. Computers and Geosciences, Vol. 76, 2015, p. 112-120.
-
Asencio-Cortés G., Martínez-Álvarez F., Morales-Esteban A., Reyes J. A sensitivity study of seismicity indicators in supervised learning to improve earthquake prediction. Knowledge-Based Systems, Vol. 101, 2016, p. 15-30.
-
Yu H., Chen J., Bobet A., Yuan Y. Damage observation and assessment of the Longxi tunnel during the Wenchuan earthquake. Tunnelling and Underground Space Technology, Vol. 54, 2016, p. 102-116.
-
Kazmi Z. A., Konagai K. Co-seismic stress changes and damage to tunnels in the 23 October 2004 Mid-Niigata Prefecture earthquake. Canadian Geotechnical Journal, Vol. 55, Issue 5, 2017, p. 736-748.
-
Lu C. C., Hwang J. H. Damage analysis of the new Sanyi railway tunnel in the 1999 Chi-Chi earthquake: Necessity of second lining reinforcement. Tunnelling and Underground Space Technology, Vol. 73, 2018, p. 48-59.
-
Zhang X., Jiang Y., Sugimoto S. Seismic damage assessment of mountain tunnel: A case study on the Tawarayama tunnel due to the 2016 Kumamoto Earthquake. Tunnelling and Underground Space Technology, Vol. 71, 2018, p. 138-148.
-
Bobet A. Effect of pore water pressure on tunnel support during static and seismic loading. Tunnelling and Underground Space Technology, Vol. 18, Issue 4, 2003, p. 377-393.
-
Hasheminejad S. M., Kazemirad S. Dynamic response of an eccentrically lined circular tunnel in poroelastic soil under seismic excitation. Soil Dynamics and Earthquake Engineering, Vol. 28, Issue 4, 2008, p. 277-292.
-
Park K. H., Tantayopin K., Tontavanich B., Owatsiriwong A. Analytical solution for seismic-induced ovaling of circular tunnel lining under no-slip interface conditions: A revisit. Tunnelling and Underground Space Technology, Vol. 24, Issue 2, 2009, p. 231-235.
-
Patil M., Choudhury D., Ranjith P. G., Zhao J. Behavior of shallow tunnel in soft soil under seismic conditions. Tunnelling and Underground Space Technology, Vol. 82, 2018, p. 30-38.
-
Zlatanović E., Lukić D. Č., Prolović V., Bonić Z., Davidović N. Comparative study on earthquake-induced soil-tunnel structure interaction effects under good and poor soil conditions. European Journal of Environmental and Civil Engineering, Vol. 19, Issue 8, 2015, p. 1000-1014.
-
Ma C., Lu D., Du X., Qi C. Effect of buried depth on seismic response of rectangular underground structures considering the influence of ground loss. Soil Dynamics and Earthquake Engineering, Vol. 106, 2018, p. 278-297.
-
Wang Z. Z., Jiang Y. J., Zhu C. A., Sun T. C. Shaking table tests of tunnel linings in progressive states of damage. Tunnelling and Underground Space Technology, Vol. 50, 2015, p. 109-117.
-
Kawamata Y., Nakayama M., Towhata I., Yasuda S. Dynamic behaviors of underground structures in E-Defense shaking experiments. Soil Dynamics and Earthquake Engineering, Vol. 82, 2016, p. 24-39.
-
Wang G., Yuan M., Miao Y., Wu J., Wang Y. Experimental study on seismic response of underground tunnel-soil-surface structure interaction system. Tunnelling and Underground Space Technology, Vol. 76, 2018, p. 145-159.
-
Chen Z. Y., Shen H. Dynamic centrifuge tests on isolation mechanism of tunnels subjected to seismic shaking. Tunnelling and Underground Space Technology, Vol. 42, Issue 5, 2014, p. 67-77.
-
Chen Z., Liang S., Shen H., He C. Dynamic centrifuge tests on effects of isolation layer and cross-section dimensions on shield tunnels. Soil Dynamics and Earthquake Engineering, Vol. 109, 2018, p. 173-187.
-
Ha I. S., Olson S. M., Seo M. W., Kim M. M. Evaluation of reliquefaction resistance using shaking table tests. Soil Dynamics and Earthquake Engineering, Vol. 31, Issue 4, 2011, p. 682-691.
-
Moghadam M. R., Baziar M. H. Seismic ground motion amplification pattern induced by a subway tunnel: shaking table testing and numerical simulation. Soil Dynamics and Earthquake Engineering, Vol. 83, 2016, p. 81-97.
-
Yan X., Yu H., Yuan Y., Yuan J. Multi-point shaking table test of the free field under non-uniform earthquake excitation. Soils and Foundations, Vol. 55, Issue 5, 2015, p. 985-1000.
-
Yu H., Yuan Y., Xu G., Yan X., Li C. Multi-point shaking table test for long tunnels subjected to non-uniform seismic loadings-part II: Application to the HZM immersed tunnel. Soil Dynamics and Earthquake Engineering, Vol. 108, 2018, p. 187-195.
-
Abuhajar O., El Naggar H., Newson T. Experimental and numerical investigations of the effect of buried box culverts on earthquake excitation. Soil Dynamics and Earthquake Engineering, Vol. 79, 2015, p. 130-148.
-
Tsinidis G., Pitilakis K., Anagnostopoulos C. Circular tunnels in sand: dynamic response and efficiency of seismic analysis methods at extreme lining flexibilities. Bulletin of Earthquake Engineering, Vol. 14, Issue 10, 2016, p. 2903-2929.
-
Tsinidis G., Rovithis E., Pitilakis K., Chazelas J. L. Seismic response of box-type tunnels in soft soil: experimental and numerical investigation. Tunnelling and Underground Space Technology, Vol. 59, 2016, p. 199-214.
Cited by
About this article

This research was supported by the China Railway Corporation Key Project (Grant No. 2014G010-G) and the National Engineering Laboratory for Construction Technology of High Speed Railway. All supports are gratefully acknowledged.
