Abstract
High-performance flexible piezoresistive sensors are highly useful in areas such as biomedicine, soft robotics, and pressure change detection technology. However, they require complex designs and advanced manufacturing methods. In this study, the design and fabrication of a flexible piezoresistive sensor using a flexible resin matrix doped with magnetically oriented iron nanoparticles is presented. The sensor consists of a flexible polymer resin matrix as substrate, reinforced with iron nanoparticles in different concentrations (0.5 %, 0.7 % and 1 % by weight), oriented by a magnetic field during the manufacturing process. The nanoparticles significantly enhance the piezo-resistive properties of the sensor, increasing its sensitivity and electrical conductivity under compressive loads. The sensor demonstrated high sensitivity under loads greater than 100 N in samples with concentrations of 0.7 % and 1 % of nanoparticles, and exhibited stability during cyclic testing, demonstrating durability. Additionally, stability tests showed excellent durability in repeated load cycles. Scanning Electron Microscopy (SEM) and Confocal Laser Scanning Microscopy (CLSM) confirmed the effective alignment and distribution of the nanoparticles within the matrix, enhancing conductivity. This flexible piezoresistive sensor doped with nanoparticles has great potential for future applications in technologies such as soft robotics and electronic skins, where high sensitivity and durability in pressure detection are required.
Highlights
- A flexible piezoresistive sensor was developed using iron nanoparticles magnetically aligned during the fabrication process.
- Samples with 0.7% and 1% nanoparticles showed high piezoresistive sensitivity and excellent conductivity under loads between 28N and 733N.
- SEM and CLSM analysis confirmed effective nanoparticle alignment, enhancing the sensor’s electrical response under compression.
1. Introduction
Piezoresistive sensors developed from composite materials have had various applications, such as in biomedicine, bioengineering, among others [1-3]. In some specific applications, such as gas, temperature, and pressure, conventional rigid sensors have struggled to meet the demands, creating opportunities for the development of flexible sensing technology [4]. Currently, experimental and theoretical efforts are being made to design dielectric components that generate a response to a mechanical load based on piezoresistive polymers and metallic materials, aiming for an easy and low-cost manufacturing process [3], [5].
With the current implementation of additive manufacturing, various polymeric materials have been developed with specific mechanical, thermal, and electrical properties, such as flexible resin used in photopolymerization 3D prototyping [6]. The materials used for 3D printing of soft sensors not only need a low Young’s modulus to make them soft, but they also require a fast UV curing rate to maintain print quality. Good sensitivity can allow close contact between the sensor and the object, which not only prevents slippage, but also avoids distracting the user's attention and can reduce control complexity [7], [8].
One of the benefits of the resin is the short UV curing time, as it allows the resin and conductive reinforcement to quickly retain their shape, which could enhance the arrangement of nanoparticles in a more controlled manner [9], [10], [3].
Flexible resin is preferred as a polymer matrix due to its extraordinary piezoelectric and pyroelectric properties [3]. The resin has a high dielectric constant, is biocompatible, possesses a good dipole moment, thermal stability, and high elasticity [11-13]. Fillers such as metal oxides and ferrites are used to provide enhanced electrical and magnetic properties [14], [15]. Due to their typical magnetic and electrical properties, iron nanoparticles are one of the reinforcement materials for piezoresistive sensors [16-21].
This work proposes a flexible piezoresistive sensor formed by the combination of a polymer matrix (flexible resin) and a reinforcement of ferric nanoparticles, which helps achieve a high dielectric constant, good conductivity, and piezoresistive properties.
The objective of this work is to produce and evaluate piezoresistive sensors composed of a flexible resin polymer matrix, with varying contents of conductive reinforcement (ferric nanoparticles) at 0 %, 0.5 %, 0.7 %, and 1 % by weight. These nanoparticles are oriented within the matrix using an electric field generated during manufacturing to adjust the morphology, electrical, and mechanical properties. The stability of the sensors is evaluated, and their characteristics are optimized for potential sensor applications. The developed materials were characterized using SEM to determine the material's morphology, and the orientation of the particles was analyzed using Confocal Laser Scanning Microscopy (CLSM).
2. Materials and methods
2.1. Materials
The material used for the fabrication of the sensors is a flexible resin polymer matrix, supplied by Siraya Tech, San Gabriel, California, USA [16], and a reinforcement of ferric nanoparticles with a purity of 99.9 % and a size range between 60 and 80 nm, supplied by Intelligent Materials Pvt Ltd, Sanuai, Punjab, India [17].
2.2. Manufacturing technique
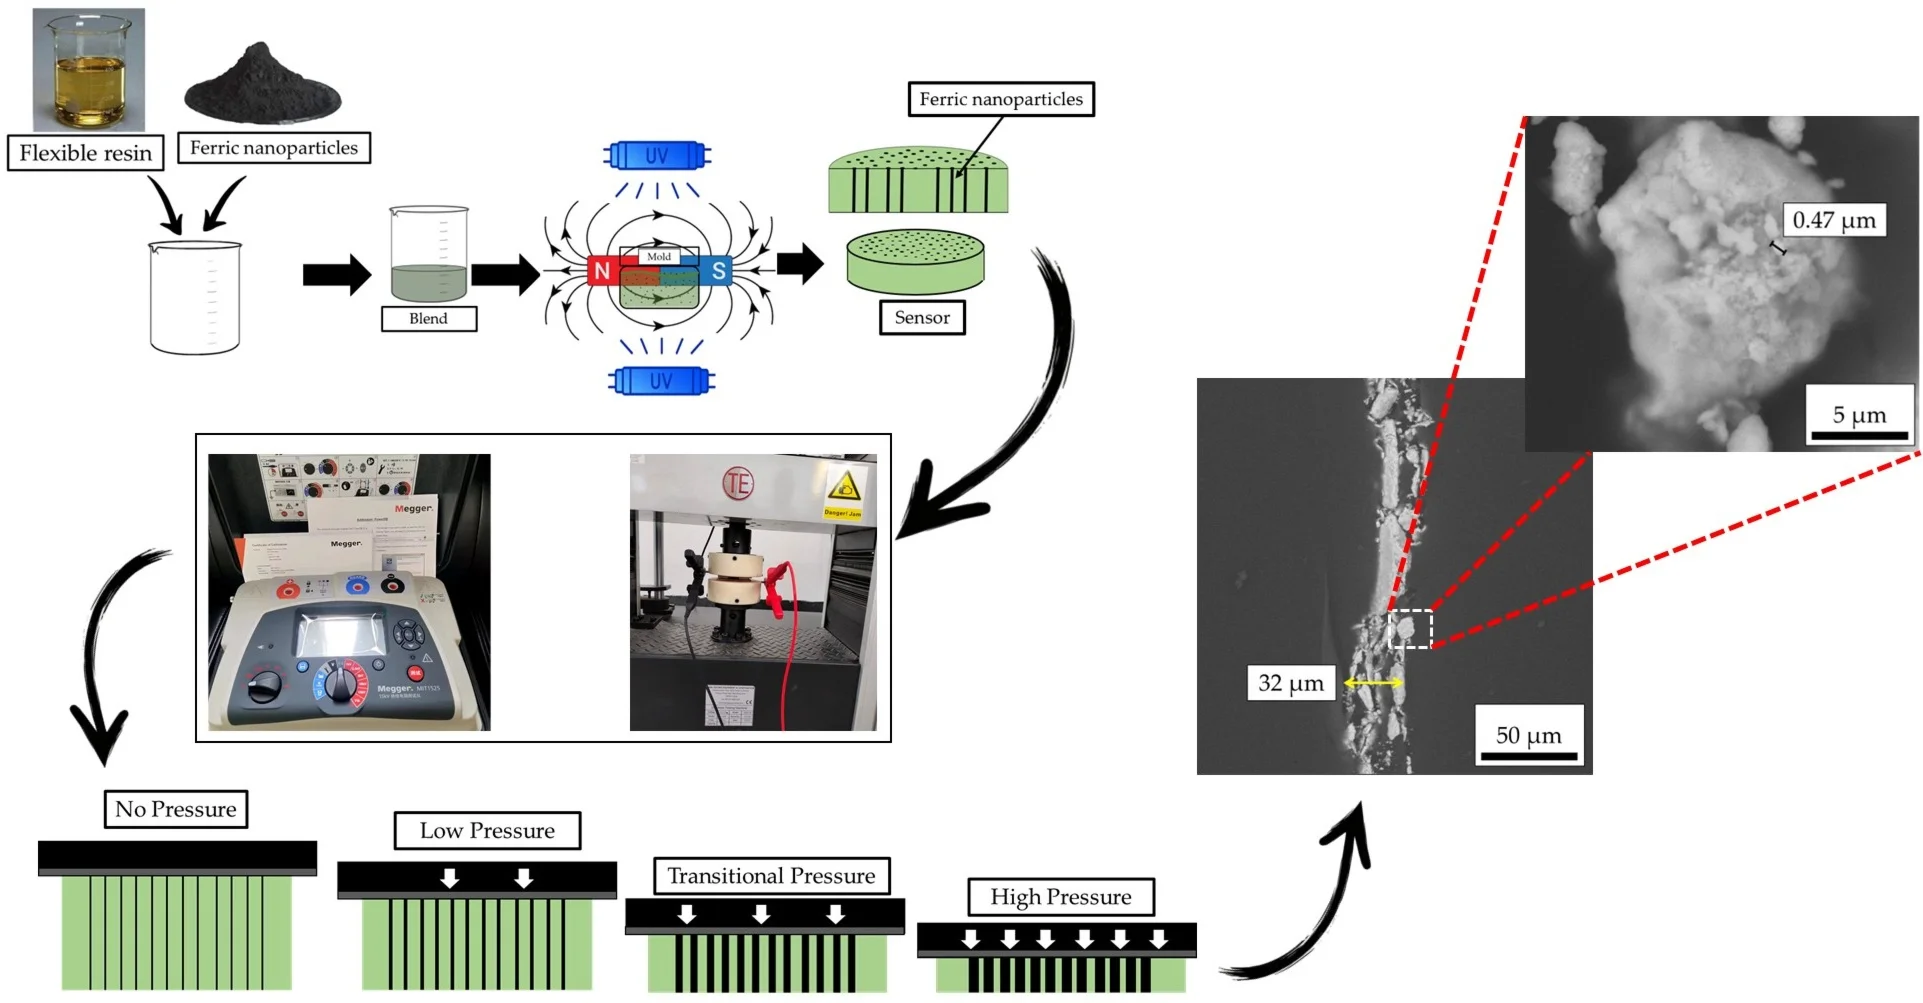
Fig. 1 shows the sensor preparation procedure, where the amount of matrix and reinforcement is represented according to their weight percentage of flexible resin and ferric nanoparticles. After this, the procedure for pouring the matrix and reinforcement into a beaker is shown, where the mixture was made by combining flexible epoxy resin with spherical iron oxide nanoparticles (average diameter: 50 nm) in a weight ratio of 0 %, 0.5 %, 0.7 %, and 1 %. The mixture was stirred for 15 minutes at 1500 rpm using a mechanical stirrer to ensure homogeneous distribution. After this, it was poured into silicone molds with dimensions of 50×10×2 mm and left to cure at room temperature (20 °C) for 24 hours. Following this, the procedure for orienting the nanoparticles using a magnetic field was carried out with two neodymium magnets, generating an orientation at 90° relative to the horizontal axis of the polymer matrix. Once the nanoparticles were oriented, the mixture was cured using ultraviolet rays for 30 minutes of exposure. After this time, the sensor was removed from the mold, fully solidified; however, material abrasion was necessary to achieve dimensions of 30 mm in diameter by 3mm in width. Later, the same process was used to prepare another sensor with different proportions of flexible resin and ferric nanoparticles. The different proportions of flexible resin and ferric nanoparticles are shown in Table 1.
Fig. 1Piezoresistive sensor manufacturing process
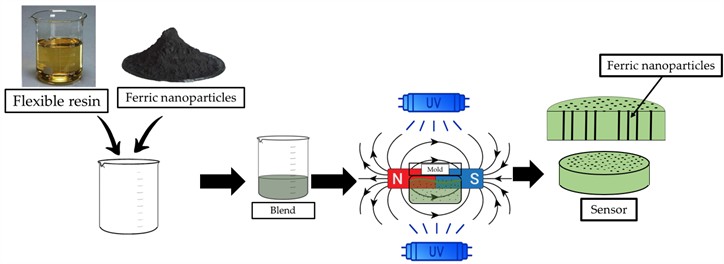
Table 1Composition of the developed materials
Sample | Flexible resin %Wt | Ferric nanoparticles %Wt |
P0 | 100 | 0 |
P1 | 99.5 | 0.5 |
P2 | 99.3 | 0.7 |
P3 | 99 | 1 |
2.3. Piezoresistive test
The piezoresistive test is conducted using the WDW100 universal testing machine (UTM), which generates compression on the samples of the developed materials. The use of a device, as shown in Fig. 2(b), is necessary. This device is connected to the insulation meter of the MEGGER brand, model MIT1525-KIT (Fig. 2(a)), with a VF2 voltage detector. The test is performed with a voltage of 200 V, allowing the detection of the electrical response as each of the developed materials is compressed. The measuring equipment was calibrated according to each particular indication as established in the user manual.
Fig. 2The use of a device a) MEGGER insulation tester model MIT1525-KIT and b) device developed for piezoresistive tests

a)
b)
2.4. Characterization techniques
The morphological characterization of the materials was performed using Scanning Electron Microscopy (SEM) with the ZEISS brand equipment, model EVO MA10. The orientation of the ferric nanoparticles was determined using Confocal Laser Scanning Microscopy (CLSM) with the OLYMPUS brand equipment, model FLUOVIEW FV1000.
3. Results
The results obtained from each of the tests to which the developed materials in this study were subjected are shown below.
3.1. Piezoresistive test
The detection mechanism of the flexible pressure sensor is predicted through the characterization of its different components.
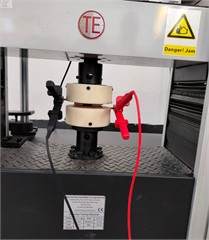
Fig. 3 shows the schematic of the cross-sectional interaction between the polymer matrix and the ferromagnetic nanoparticles under the initial, light, transition, and heavy load states. In the low-pressure region, the stress generated by the external pressure concentrates on the polymer matrix inside the sensor, while it does not undergo deformation. During this process, the distance between the clusters of ferro-magnetic nanoparticles remains unchanged. Additionally, the spacing between the nanoparticle clusters gradually decreases. Therefore, in this stage, the sensor's sensitivity begins to generate a piezoresistive response. As pressure increases, the clusters compress, causing swelling and closer proximity between them. The duration of this process is short and corresponds to the test results shown in Fig. 4. Finally, in the high-pressure region, the sensor has been fully compressed under the action of the external pressure. Under this pressure, the sensor undergoes significant deformation, which corresponds to the slow decrease in total resistance.
The piezoresistive test was performed by measuring the electrical conductivity of each sample when a mechanical compressive load was applied.
Fig. 3Schematic diagrams of the distributed microstructure of the sensor under no pressure, low pressure, transition pressure, and high pressure
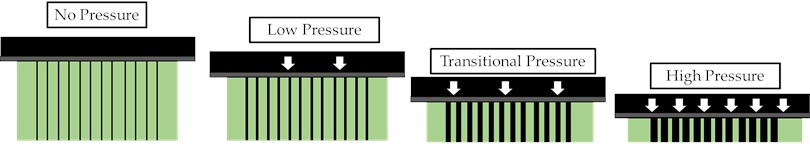
Fig. 4Piezoresistive response of sensor prototypes
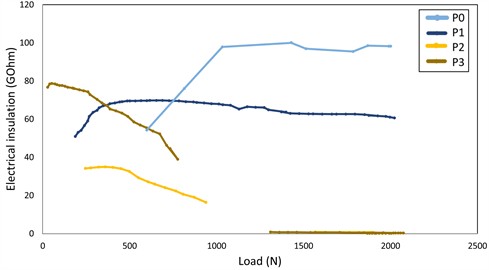
Fig. 4 shows that sample P3, with the highest nanoparticle content (1 % by weight), responds more efficiently under low loads, starting at 28 N of compression. The electrical conductivity increases significantly under higher loads, suggesting that the nanoparticles are compressed, improving the electrical contact between them.
Similarly, it is evident that sample P0 starts to generate a response in electrical conductivity from 598 N of load, where it has an electrical conductivity insulation of 54.2 GOhm. As the compression load increases, this material tends to become less electrically conductive, as above 1033 N of load, it has an electrical insulation of 97.9 GOhm.
For sample P1, it starts to generate responses in electrical conductivity from 187 N of compression load, with an electrical conductivity insulation of 5 GOhm. However, as the load increases, it tends to become more electrically insulating until it reaches 689 N, with an electrical insulation of 69.8 GOhm. From that point, it maintains this insulation value up to 2023 N of compression load, with an electrical insulation of 60.6 GOhm.
On the other hand, for sample P2, it is observed that it generates a piezoresistive response in the range of 245 N to 938 N, indicating an electrical conductivity insulation between 34.2 GOhm and 16.36 GOhm, respectively. However, the electrical insulation meter did not register further data for this material until it reached a load of 1568 N, indicating an electrical conductivity insulation of 0.87 GOhm.
Finally, for sample P3, a piezoresistive response is obtained at 28 N of compression load with an electrical conductivity insulation of 76.7 GOhm. As the compression stress increases, the behavior regarding electrical insulation decreases until it reaches 44.5 GOhm at a load of 733 N. After this, no piezoresistive response is observed between 797 N and 1232 N, until it reaches a compression load of 1309 N with an electrical insulation of 0.82 GOhm. Afterward, it remains at an electrical insulation below 0.8 GOhm, indicating an approximate electrical conductivity of 100 %. This may be due to the content of ferromagnetic nanoparticles in the composite material, as the nanoparticle clusters tend to compact as mechanical compression stress is applied to the material, generating higher electrical conductivity.
3.2. Scanning electron microscopy technique (SEM)
To observe the morphology and distribution of the ferromagnetic nanoparticles within the components of the developed materials, the scanning electron microscope (SEM) was used. A cross-sectional cut was made on each of the samples to observe this orientation.
In Fig. 5(a), (c), and (d), the orientation of the ferromagnetic nanoparticles within the polymeric matrix is observed. Similarly, it is evident that there are spaces between the ferromagnetic nanoparticles. This is why, as the compression load increases, there is greater electrical conductivity, as the nanoparticles begin to compress, occupying these spaces. The thickness of the nanoparticle clusters is clearly observed according to the percentage within the polymeric matrix. For sample P1, the nanoparticle cluster has a thickness of 18 µm, for P2 it is 32 µm, and for sample P3, the thickness is 48 µm, respectively.
In Fig. 5(b), it can be observed how the ferromagnetic nanoparticles tend to agglomerate, forming particles of up to 0.47 µm.
3.3. Scanning laser confocal microscopy technique (CLSM)
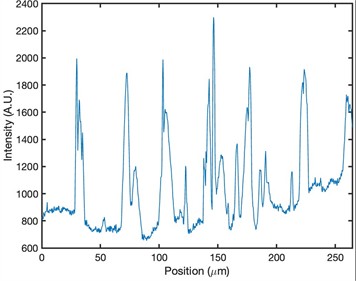
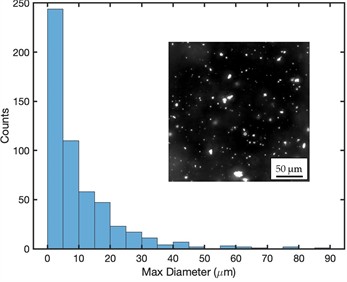
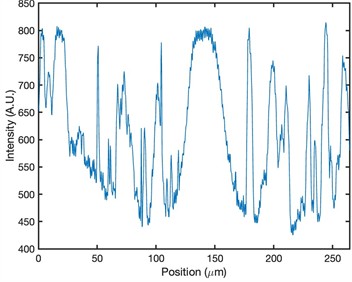
The data obtained from the laser scanning confocal microscope are shown in Figure 6, where, in addition to observing the distribution of ferromagnetic nanoparticles within the polymeric matrix, the distance between the particles can be determined through the response to the applied intensity. Likewise, it is possible to count the size of the particles present and their quantity in the sample being evaluated.
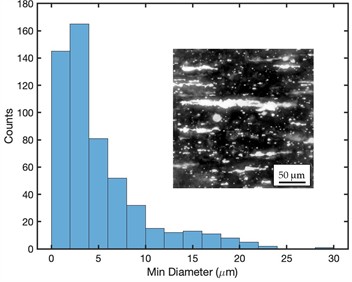
In Fig. 6(a), several intensity peaks are observed due to the position of the nanoparticles within the polymeric matrix of sample P1, which contains 0.5 % ferromagnetic nanoparticles. It can be seen that these intensities are approximately spaced every 50 µm, and the width of these peaks also reveals that the nanoparticle clusters do not exceed 18 µm. In Fig. 6(b), a quantitative analysis was performed on the number and size of particles distributed within material P1, highlighting that there are 240 ferro-magnetic particles with sizes ranging from 0.001 µm to 5 µm, followed by approximately 100 particles with sizes between 5 µm and 10 µm, which are the most abundant sizes within the sample.
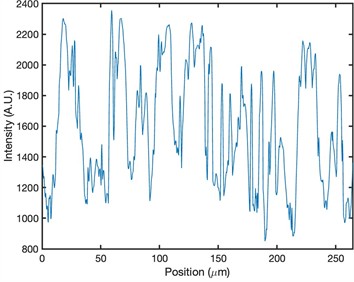
In Fig. 6(c), several intensity peaks are observed due to the position of the nanoparticles within the polymeric matrix of sample P2, which contains 0.7 % ferromagnetic nanoparticles. It can be seen that, unlike sample P1, these intensities are spaced between approximately 30 µm and 40 µm, and the width of these peaks also changes, being wider above 25 µm, indicating that the nanoparticle clusters are thicker due to the increased nanoparticle percentage. In Fig. 6(d), it is shown that the majority of particles present in material P2 have sizes between 0.001 µm and 5 µm.
Fig. 5Morphological characterization of samples P1, P2 and P3 and observation of ferromagnetic nanoparticles
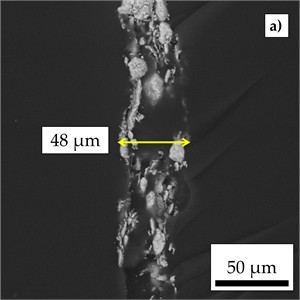
a) The P3 sample is shown
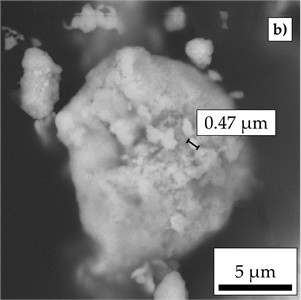
b) A cluster of ferromagnetic nanoparticles is shown
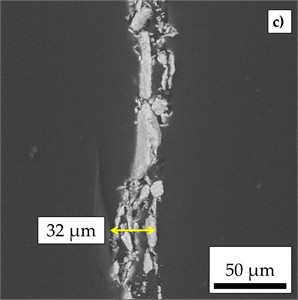
c) The P2 sample is shown
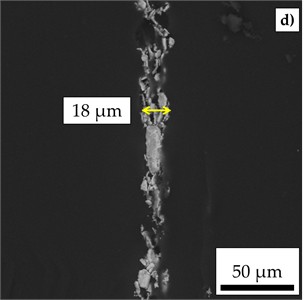
d) The P1 sample is shown.
Finally, in Fig. 6(e), the intensity peaks indicating the position of the nanoparticles within the polymeric matrix of sample P3, which contains 1 % ferromagnetic nanoparticles, can be observed. A very wide peak is noticeable, exceeding 50 µm, which is attributed to the aggregation of ferromagnetic nanoparticles forming a cluster, in contrast to the other peaks that have narrower thicknesses of less than 20 µm. In Fig. 6(f), it is evident that the majority of particles present in material P3 are between 0.001 µm and 5 µm in size.
Ferromagnetic nanoparticles are known to have a nanoscale size, confocal microscopy assays show values below 5 µm, possibly due to agglomerations between the nanoparticles.
4. Discussion
Through the composite material development process, a magnetic field was generated for the orientation of the ferromagnetic nanoparticles. This procedure was carried out based on studies conducted by Leungpuangkaew S. and Amornkitbamrung L., where a magnetic field was created, and through this, the particles tended to organize within a benzoxazine resin matrix of biological origin [17]. Or as in the study conducted by Wang Y. and Zhao Z., where hexagonal boron nitride powders were used in a polymer matrix, resulting in the particles being oriented and controlled through the application of a magnetic field [18].
The piezoresistivity tests revealed that the composites reinforced with ferromagnetic nanoparticles (materials P1, P2, and P3) exhibited a significant improvement in piezoresistive response when subjected to mechanical compression compared to the P0 material (without reinforcement). Specifically, material P3 (1 % ferromagnetic nano-particles) started recording data at a compression load of 100 N, demonstrating an efficient piezoresistive response compared to material P0. This confirms that the reinforcement with ferromagnetic nanoparticles, due to their organization within the polymer matrix, causes the material to show no piezoresistive response when no load is applied. However, as the mechanical load increases, this material generates a piezo-resistive response.
Fig. 6Morphological analysis and particle distribution in polymeric matrices of samples P1, P2 and P3
a) Distance between each of the oriented clusters within the polymeric matrix of sample P1
b) Number and size of particles present in material P1
c) Distance between each of the oriented clusters within the polymeric matrix of sample P2
d) Number and size of particles present in material P2
e) Distance between each of the oriented clusters within the polymeric matrix of sample P3
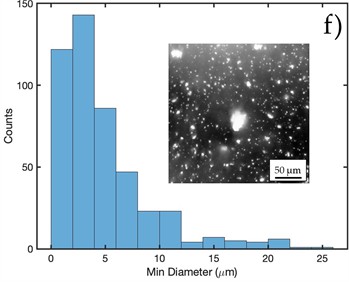
f) Number and size of particles present in material P3
In the study conducted by Noor H., Hanif M. [22], a series of nanocomposites containing iron oxide nanoparticles were prepared using the direct dispersion technique. SEM images revealed an uneven dispersion of the nanoparticles within the polymer matrix. The frequency-dependent dielectric properties showed that dielectric parameters, such as the dielectric constant, tangent loss, and AC conductivity, improved due to the incorporation of nanoparticles. These fabricated nanocomposites, which exhibit enhanced electrical and magnetic properties, can be used in the field of magnetoelectronic devices.
The SEM micrographs in the present study provided a detailed view of the internal structure of the composite materials. Images of materials P1, P2, and P3 showed clusters of ferromagnetic nanoparticles within the polymer matrix, indicating optimal dispersion, considering the shaping technique of these materials. However, some agglomerations of these nanoparticles were observed, reaching sizes above 5 µm. In the study conducted by Chaudhari D., Panda G. [23], scanning electron micrographs of ferromagnetic particles revealed agglomerations of these particles reaching dimensions above 40 µm. The magnetic orientation technique and the size of the nanoparticles contribute to a better alignment and accommodation within the polymer matrix.
As for the methodology used by Zarchi, M., Shahgholi, M., it is adaptable to the present study since the proposed method is suitable for solving the zero sample problem because it uses the transferable indices with various spaces and distributions based on the processing feature bank and the source multi-target strategy and the transfer of predefined features between source and multi-target domains with many spaces and distributions [24, 25].
5. Conclusions
This work demonstrated that the use of ferromagnetic nanoparticles magnetically oriented in a flexible resin matrix significantly improves the sensitivity and conductivity of the sensor under compression. Samples with a higher concentration of nanoparticles, particularly P3, exhibited optimized electrical conductivity. It was observed that the magnetic orientation of the nanoparticles during the manufacturing process was crucial for improving the electrical conductivity of the sensor under compression, especially in samples with higher nanoparticle content, such as those with 0.7 % and 1 % by weight.
Additionally, it was found that sensors with less than 0.5 % by weight of ferro-magnetic nanoparticles exhibited insulating behavior. The tests showed that samples with a higher percentage of nanoparticles responded better electrically to compression, particularly the sample with 1 % ferromagnetic nanoparticles, which showed a decrease in electrical insulation from 76.7 GOhm to 44.5 GOhm, indicating optimal performance within a compression load range of 28 N to 733 N. On the other hand, morphological characterization through scanning electron microscopy (SEM) revealed a uniform distribution and proper orientation of the nanoparticles within the matrix, which enhanced the material’s ability to adapt to electrical changes under pressure.
This work demonstrates the effectiveness of the composite material molding method through the orientation of ferromagnetic nanoparticles within a polymer resin matrix using a magnetic field. According to the electrical response of the developed material when exposed to a compression load, it indicates a sensor sensitivity of no more than 733 N. The P3 sensor’s piezoresistive sensitivity is primarily observed between 28 N and 733 N of compressive load. This suggests that outside this range, the sensor loses accuracy or stops responding adequately, limiting its application in very low- or very high-load environments. This material molding method serves as a foundation for future studies focused on stereolithography for sensor printing using resin and photocuring, enabling the control of the orientation of ferromagnetic nanoparticles. Ultimately, the use of flexible resins doped with magnetically oriented nanoparticles represents a significant advancement in the development of piezoresistive sensors, opening new possibilities in detection technology.
References
-
D. Zhu et al., “Long/short chain crosslinkers-optimized and PEDOT:PSS-enhanced covalent double network hydrogels rapidly prepared under green LED irradiation as flexible strain sensor,” European Polymer Journal, Vol. 174, p. 111327, Jul. 2022, https://doi.org/10.1016/j.eurpolymj.2022.111327
-
H. Liu et al., “3D printed flexible strain sensors: from printing to devices and signals,” Advanced Materials, Vol. 33, No. 8, p. 20047, Jan. 2021, https://doi.org/10.1002/adma.202004782
-
H. Shi et al., “Rapidly UV-curable resin for soft sensors of embedded 3D printing,” European Polymer Journal, Vol. 181, p. 111680, Dec. 2022, https://doi.org/10.1016/j.eurpolymj.2022.111680
-
Y. Ren et al., “Electric‐field‐induced gradient Ionogels for highly sensitive, broad‐range‐response, and freeze/heat‐resistant ionic fingers,” Advanced Materials, Vol. 33, No. 12, p. 20084, Feb. 2021, https://doi.org/10.1002/adma.202008486
-
H. Lu, B. Chen, X. Lai, H. Li, and X. Zeng, “Porous reduced graphene oxide@multi-walled carbon nanotubes/polydimethylsiloxane piezoresistive pressure sensor for human motion detection,” Materials Today Nano, Vol. 28, p. 100512, Dec. 2024, https://doi.org/10.1016/j.mtnano.2024.100512
-
S. Mohanty, V. Panwar, and P. Khanduri, “Development of flexible piezoresistive dielectric membrane by PVDF/Fe3O4,” Materials Today: Proceedings, Vol. 44, pp. 1707–1710, Jan. 2021, https://doi.org/10.1016/j.matpr.2020.11.876
-
D. Song, X. Chen, M. Wang, Z. Wu, and X. Xiao, “3D-printed flexible sensors for food monitoring,” Chemical Engineering Journal, Vol. 474, p. 146011, Oct. 2023, https://doi.org/10.1016/j.cej.2023.146011
-
D. Wang et al., “Low viscosity and highly flexible stereolithographic 3D printing resins for flexible sensors,” Materials and Design, Vol. 243, p. 113052, Jul. 2024, https://doi.org/10.1016/j.matdes.2024.113052
-
W. Xia, N. Zhu, R. Hou, W. Zhong, and M. Chen, “Preparation and characterization of fluorinated hydrophobic UV-Crosslinkable Thiol-Ene polyurethane coatings,” Coatings, Vol. 7, No. 8, p. 117, Aug. 2017, https://doi.org/10.3390/coatings7080117
-
D. Ahn, L. M. Stevens, K. Zhou, and Z. A. Page, “Rapid high-resolution visible light 3D printing,” ACS Central Science, Vol. 6, No. 9, pp. 1555–1563, Sep. 2020, https://doi.org/10.1021/acscentsci.0c00929
-
N. Rodriguez et al., “3D printing of high viscosity reinforced silicone elastomers,” Polymers, Vol. 13, No. 14, p. 2239, Jul. 2021, https://doi.org/10.3390/polym13142239
-
A. Samadi, S. M. Hosseini, and M. Mohseni, “Investigation of the electromagnetic microwaves absorption and piezoelectric properties of electrospun Fe3O4-GO/PVDF hybrid nanocomposites,” Organic Electronics, Vol. 59, pp. 149–155, Aug. 2018, https://doi.org/10.1016/j.orgel.2018.04.037
-
L. Zhang, B. Wang, W. Ma, B. Li, Y. Liu, and Y. Du, “Fe3C/Fe nanoparticles decorated three-dimensional nitrogen-doped carbon foams for highly efficient bisphenol A removal through peroxymonosulfate activation,” Chemical Engineering Journal, Vol. 437, p. 135472, Jun. 2022, https://doi.org/10.1016/j.cej.2022.135472
-
D. Liu, X. Liu, J. Wang, X. Mao, X. Xu, and X.A. Fan, “The influence of Fe nanoparticles on microstructure and magnetic properties of Fe-6.5wt%Si soft magnetic composites,” Journal of Alloys and Compounds, Vol. 835, p. 155215, Sep. 2020, https://doi.org/10.1016/j.jallcom.2020.155215
-
“Tenacious – 65D Flexible resin,” Siraya Tech Platinum Silicone – Defiant 25 Online, https://siraya.tech/products/tenacious-resin-flexible-resin
-
“Metal nano powder,” Nanoshel, https://www.nanoshel.com/product/nano-iron-powder
-
S. Leungpuangkaew et al., “Magnetic – and light-responsive shape memory polymer nanocomposites from bio-based benzoxazine resin and iron oxide nanoparticles,” Advanced Industrial and Engineering Polymer Research, Vol. 6, No. 3, pp. 215–225, Jul. 2023, https://doi.org/10.1016/j.aiepr.2023.01.003
-
Y. Wang, Z. Zhao, A. Gu, Z. Wei, W. Chen, and C. Yan, “Enhancement of thermal conductivity of BN-Ni/epoxy resin composites through the orientation of BN-Ni fillers by magnetic field and hot-pressing,” Ceramics International, Vol. 48, No. 22, pp. 33571–33579, Nov. 2022, https://doi.org/10.1016/j.ceramint.2022.07.301
-
H. Öner and H. Yüce, “Align MWCNT/GNPs/PDMS based nanocomposite dry ECG electrodes for ECG recordings,” Journal of Mechatronics and Artificial Intelligence in Engineering, Vol. 4, No. 1, pp. 18–26, Jun. 2023, https://doi.org/10.21595/jmai.2023.23201
-
S. Ersoy, G. Atakok, D. Khorsandi, and E. Toptaş, “Investigation of time-based pressure control for microfluidics chip design,” Journal of Engineering Research, Vol. 11, No. 4, May 2022, https://doi.org/10.36909/jer.14067
-
X. Guo and D. Kong, “Simulation analysis of thermal shock response of piezoelectric shock wave pressure sensor,” Vibroengineering Procedia, Vol. 51, pp. 134–140, Oct. 2023, https://doi.org/10.21595/vp.2023.23592
-
H. Noor, M. W. Hanif, S. Latif, Z. Ahmad, S. Riaz, and S. Naseem, “Dielectric and magnetic response of iron oxide nanoparticles embedded in unsaturated polyester resin,” Physica B: Condensed Matter, Vol. 602, p. 412554, Feb. 2021, https://doi.org/10.1016/j.physb.2020.412554
-
D. Chaudhari and G. Panda, “A brief overview on iron oxide nanoparticle synthesis, characterization, and applications,” in Materials Today: Proceedings, Oct. 2023, https://doi.org/10.1016/j.matpr.2023.10.087
-
M. Zarchi, M. Shahgholi, and K. F. Tee, “An adaptable physics-informed fault diagnosis approach via hybrid signal processing and transferable feature learning for structural/machinery health monitoring,” Signal, Image and Video Processing, Vol. 18, No. 12, pp. 9051–9066, Sep. 2024, https://doi.org/10.1007/s11760-024-03529-y
-
M. Zarchi and M. Shahgholi, “An expert condition monitoring system via fusion of signal processing for vibration of industrial rotating machinery with unseen operational conditions,” Journal of Vibration Engineering and Technologies, Vol. 11, No. 5, pp. 2267–2295, Oct. 2022, https://doi.org/10.1007/s42417-022-00702-w
About this article

This research was funded by the Pedagogical and Technological University of Colombia (UPTC), grant number 80740-732-2020.
The datasets generated during and/or analyzed during the current study are available from the corresponding author on reasonable request.
Rafael Hernando Blanco Gómez: conceptualization, methodology, writing-review and editing. Andres Felipe Rubiano Navarrete: conceptualization, writing-review and editing. Carlos Andrés Palacio Gómez: conceptualization, supervision, funding acquisition. Leonel Paredes Madrid: methodology, writing-review and editing, supervision, funding acquisition. Yaneth Pineda Triana: conceptualization, supervision, project administration, funding acquisition.
The authors declare that they have no conflict of interest.
