Abstract
This paper presents an algorithm that combines a convolutional neural network (CNN) with a gated recurrent unit (GRU) to predict the wharf subsidence deformation. First, the digital elevation model (DEM) image features of the wharf area were extracted using the CNN, and then the patterns of change in wharf settlement were captured using the GRU. Moreover, the wharf in the Longtan Port area of Nanjing Port, located in Jiangsu Province, was analyzed. When the CNN comprised three convolutional layers and the activation function was set to sigmoid, the prediction performance of the proposed algorithm was the best. In both short-term and long-term scenarios, the CNN+GRU algorithm had better prediction performance than long short-term memory and GRU models.
Highlights
- This paper uses UAV photography technology to collect wharf ground data and constructs a DEM.
- The CNN algorithm is adopted to extract the convolutional features from the DEM.
- GRU is used to capture the law of wharf subsidence changes, so as to accurately predict the deformation degree.
1. Introduction
With the continuous growth of global trade and improvements in port infrastructure, the stability and safety of wharves, as important hubs for cargo distribution, have become key to ensuring smooth economic operation [1]. However, during the long-term use of wharves, it is prone to subsidence deformation due to various factors, including environmental conditions, load changes, and material aging. These factors not only affect the normal operation of the wharf but also pose risks to the safety of personnel and goods [2]. Therefore, accurately predicting the degree of subsidence deformation in wharves is beneficial for implementing timely maintenance measures and extending their service life. Among the various prediction methods, deep learning has emerged as a rapidly developing technology that can process large volumes of monitoring data to predict wharf subsidence deformation and automatically learn complex relationships between wharf structures and environmental factors to enhance the prediction precision [3]. Liu et al. [4] proposed a parametric non-uniform tunnel deformation model containing three different modes and established a surface settlement prediction model. Hasanipanah et al. [5] put forward a hybrid prediction model that combines an artificial neural network (ANN) with particle swarm optimization. They found that, compared to the traditional ANN model, their proposed model could predict the maximum surface settlement with greater accuracy. Fang et al. [6] derived a prediction equation for the land subsidence process by introducing parameter j, which represents the longitudinal settlement width coefficient, and its determining formula. Ji et al. [7] proposed a physical-data-driven combined strategy for identifying the load of tire-type rail transit vehicles. This strategy extracted the temporal-spatial features of signals using a convolutional neural network (CNN) and a bidirectional gated recurrent unit (GRU), then predicted the error of an extended Kalman filter, and corrected the identification results. Chen et al. [8] developed a novel explicit speed-integrated long short-term memory (LSTM) model to improve the representation accuracy of non-stationary vibration signals and enhance gearbox fault detection performance. The above relevant studies have all conducted research and analysis on land subsidence prediction and related prediction algorithms. Some focus on land subsidence models, while others emphasize prediction algorithms. In contrast, this article used drones to collect surface images of a wharf and then constructed the digital elevation model (DEM) of the wharf. Then, a CNN algorithm was employed to extract features from the DEM, and a GRU was used to capture the time series variation law of the DEM to predict the subsidence deformation of the wharf. The differences and improvements lie in first quickly obtaining the basic situation of the wharf surface using DEM, then using the convolutional structure in CNN to extract the surface settlement characteristics from the wharf DEM data, and finally leveraging the advantages of GRU for time series data to analyze the non-linear laws of wharf settlement. This paper integrated a CNN with a GRU to forecast the subsidence deformation of the wharf. The DEM image features of the wharf area were extracted using CNN, and GRU captured the changing patterns of wharf subsidence. Moreover, the wharf in the Longtan Port area of Nanjing Port in Jiangsu Province was taken for a case study. The contribution of this paper lies in combining intelligent algorithms such as CNN and GRU to capture the patterns of wharf ground settlement to more effectively detect the changes in the wharf and ensure its safety. The novelty of this paper is the combination of a CNN with a GRU. The convolutional structure of the CNN algorithm was used to extract features from the wharf DEM data, and then the advantages of GRU for time series data were utilized to identify the patterns of changes in wharf ground settlement.
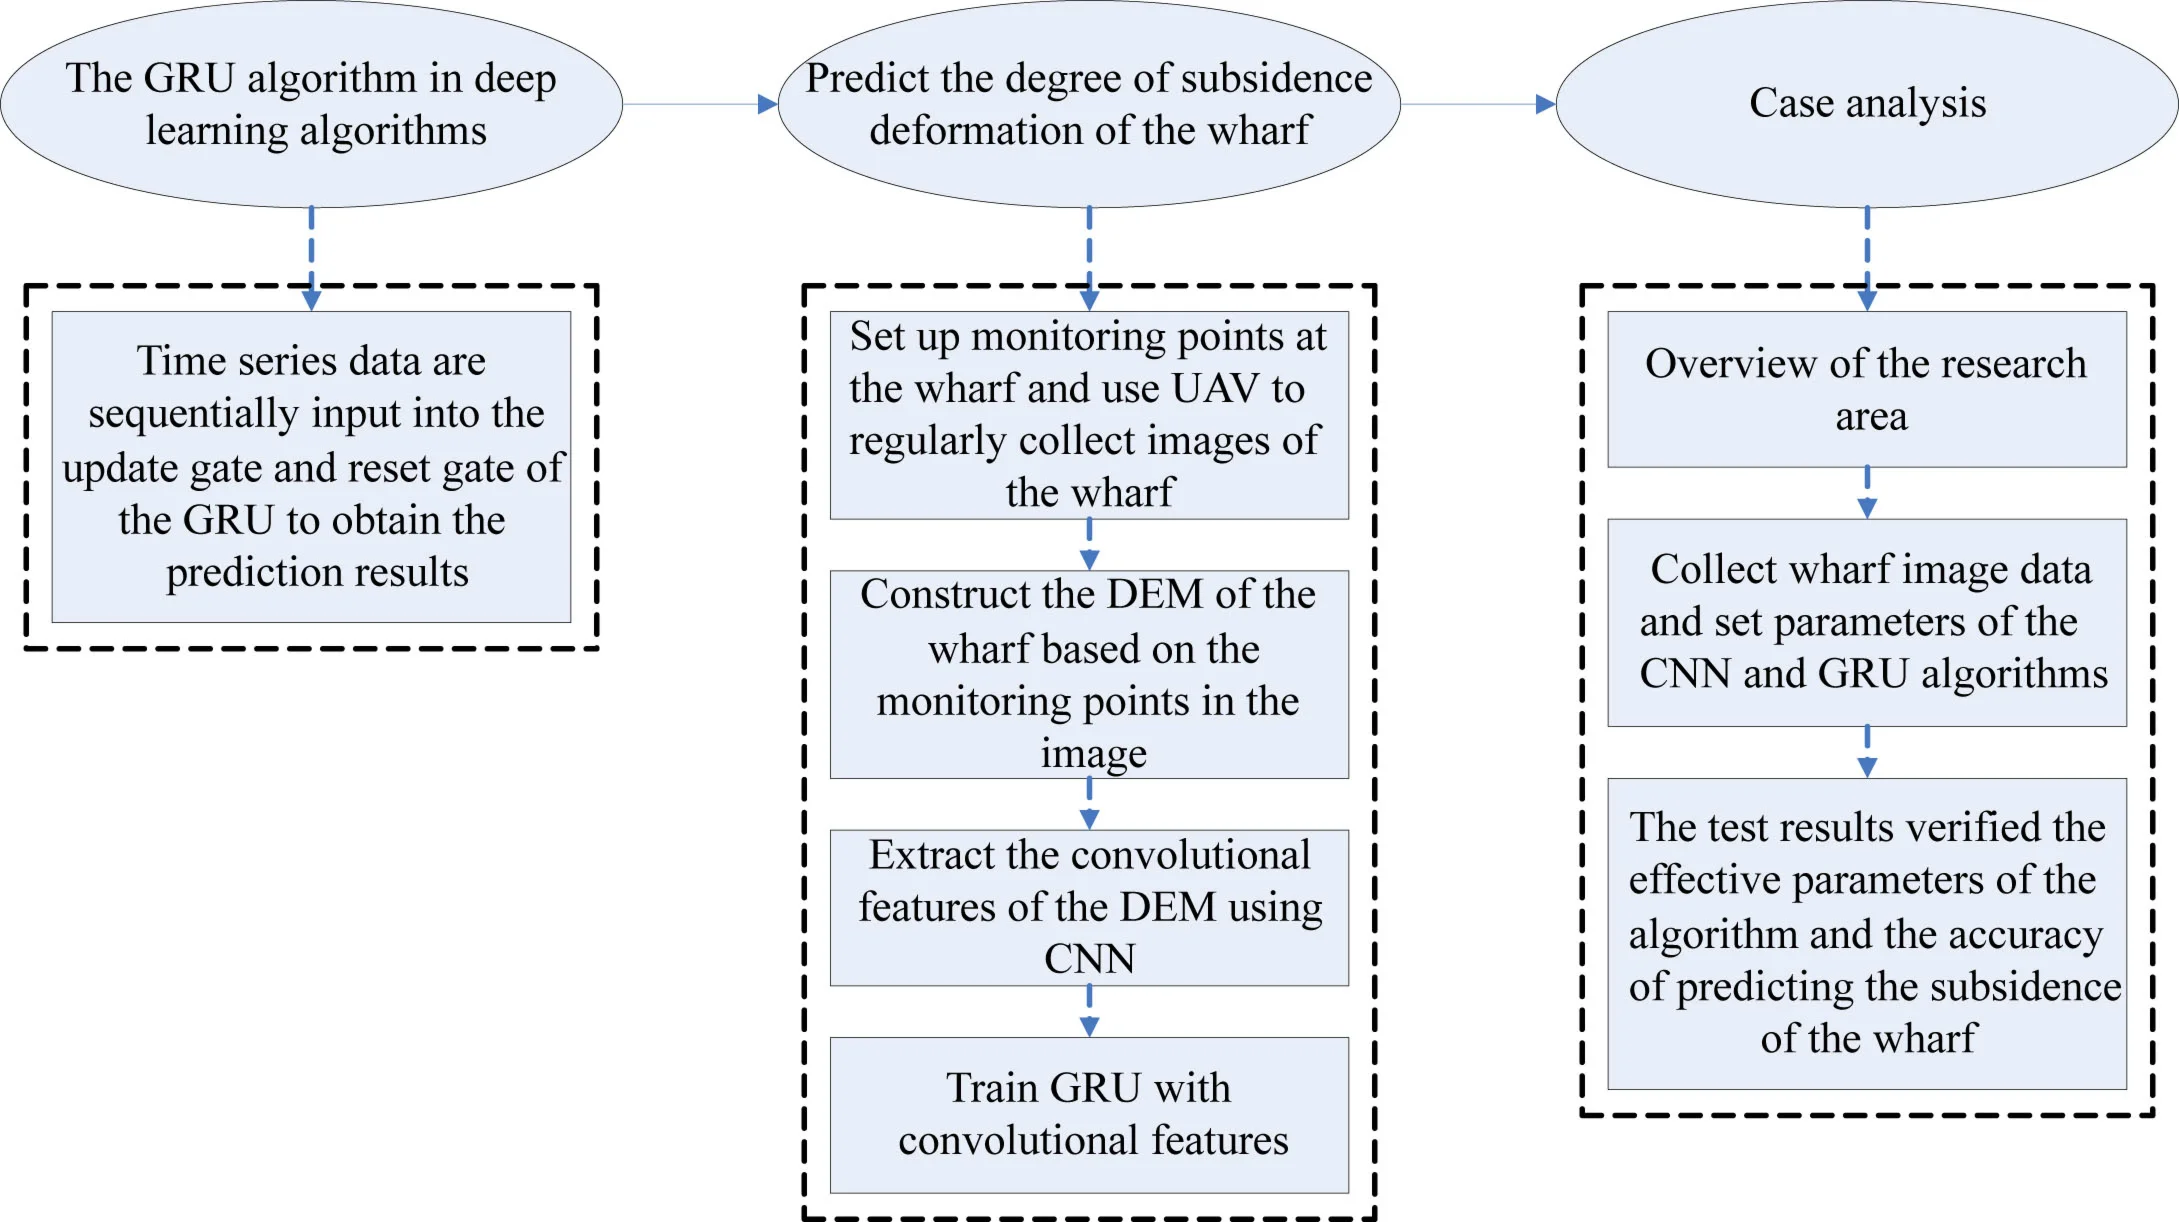
2. Prediction algorithm of wharf subsidence deformation based on deep learning
2.1. GRU algorithm in deep learning algorithm
The basic principle of predicting the degree of wharf subsidence deformation is to predict the future data based on the current and historical data [9]. Deep learning algorithms, such as the recurrent neural network (RNN), are highly appropriate for analyzing such time series data. The GRU is an enhancement of long short-term memory (LSTM) networks. It merges the forgetting gate and the input gate into an update gate, thereby reducing the computational burden of the algorithm [10], which is beneficial to the rapid early warning of changes in wharf subsidence. The forward formula is:
where is the update gate output [11], is the reset gate output, and are the weight in the update and reset gates, is the current input, is the activation function adopted by the update and reset gates, is the hidden state of the previous moment, is the temporary hidden state of the present moment, is the weight when calculating , and is the hidden state of the current moment.
2.2. Prediction of wharf subsidence deformation
The wharf is an important distribution hub in water transportation. One of the characteristics of water transportation is its capacity for large freight volumes, which leads to the need for the wharf to bear a large amount of cargo load. Typically, the wharf usually extends from the shoreline into the water (sea) region [12]. As a hydraulic structure, a wharf will be deformed during operation due to the influence of cargo loads, natural environments, and other factors. If the deformation exceeds a certain threshold, it can result in irreversible damage, which will eventually cause damages to wharf staff and cargo safety [13]. Therefore, in order to guarantee the safety of the wharf, it is necessary to monitor the subsidence deformation and then make predictions according to the monitoring data, so as to prepare coping strategies in advance.
Fig. 1Training flow of wharf subsidence deformation prediction based on a deep learning algorithm
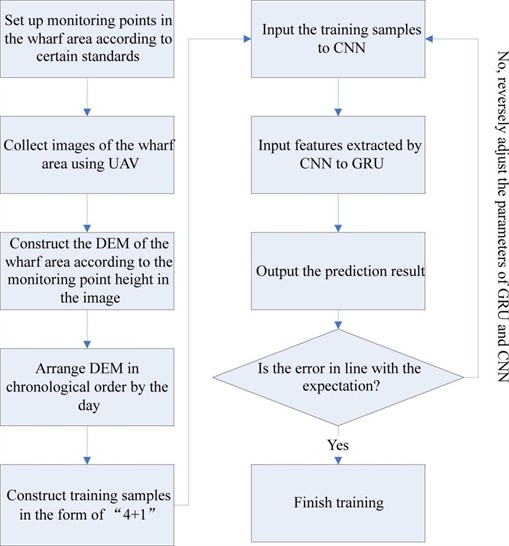
In this paper, a deep learning algorithm is employed to forecast the degree of subsidence deformation at the wharf, as shown in Fig. 1.
(1) A monitoring point is set at an interval in the wharf area to be monitored [14].
(2) An unmanned aerial vehicle (UAV) equipped with a camera is used to capture images of the wharf area, and the collection interval is determined by specific requirements.
(3) The DEM of the wharf area is constructed based on the monitoring points in the UAV-captured images. The construction process is as follows. Firstly, scale-invariant feature transform (SIFT) features are utilized to identify the monitoring points in the images. Then, the camera pose is estimated using these monitoring points, and the actual coordinates of the monitoring points are calculated to create a sparse point cloud. Then, the multi-view stereo (MVS) image matching algorithm is applied to generate a dense point cloud. Finally, the DEM of the pier area is derived by filtering and interpolating the dense point cloud [15].
(4) The DEM of the wharf area is organized chronologically by day, and then the samples are constructed in the form of “4+1”. The form of “4+1” means that in the continuous-time DEM, the DEM of four consecutive days is taken as the input data of the sample, and the DEM of the fifth day is taken as the actual forecast data of the sample (label).
(5) The input data from the training sample is input into a CNN, and the convolution and pooling layers of the CNN are used to extract and compress the convolutional features of the training sample.
(6) The convolutional features extracted by the CNN are fed into the GRU according to the time series for forward calculation.
(7) After the GRU forward calculation results are obtained, they are compared with the sample labels to determine whether the error converges to the preset threshold. If it does, the training is considered complete. If not [16], the parameters in the GRU and CNN are reversely adjusted according to the error, and the process returns to step (5).
3. Case analysis
3.1. Case overview
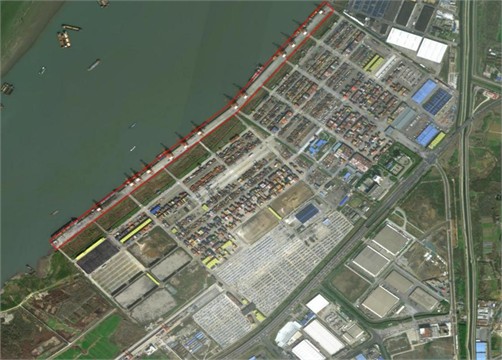
The Longtan Port area of Nanjing Port in Jiangsu Province (Fig. 2) was taken as the subject for a case analysis. Nanjing Port is located in the middle and lower reaches of the Yangtze River. Its coordinates are 118°44’ east longitude and 32°05’ north latitude. The entire Nanjing Port area is 98 km long. Longtan Port is an important part of Nanjing Port. It is a container wharf with a coastline of 910 m and an average water depth of 12.5 m at the front of the wharf. Longtan Port has a vast hinterland of cargo sources, excellent transportation conditions, and convenient access for both land and water transport.
Fig. 2Longtan Port area of Nanjing Port
3.2. Analysis and setting
The UAV used for image acquisition in the port area was a DJI Mini 4 Pro, equipped with a camera with 48 million effective pixels. It has a maximum flight time of 34 min. The navigation system employed was a combination of the global positioning system (GPS) and BeiDou.
When setting up monitoring points in the Longtan Port area, a monitoring point was positioned every 50 m along the wharf (within the red box in Fig. 2). Then, the UAV flew along the designated route, and captured images, including the monitoring points. Images were collected at 12 o'clock every day from September 2022 to September 2023. After eliminating images affected by bad weather, a total of 300 remote sensing images of Longtan Port were finally collected.
Table 1Relevant parameters of the prediction algorithm
Structure setup | Parameter | Structure setup | Parameter |
CNN input layer | Depend on the matrix specification when building the training and testing samples | CNN convolution layer | 64 convolution kernels (3×3), a moving step length of 2, the sigmoid activation function |
CNN pooling layer | 3×3 pooling box, mean pooling | GRU input layer | 256 nodes |
GRU hidden layer | 1,024 nodes, the activation function sigmoid [17] | GRU output layer | Depend on the number of points to be predicted in the sample. |
CNN and GRU algorithms were combined, and the relevant parameters of the combined prediction algorithm for wharf ground subsidence deformation degree are shown in Table 1. The CNN algorithm was used to extract image features from the DEM built by monitoring images, and then the features were input into the GRU to predict wharf subsidence. The specifications of the CNN input layer depended on the specifications of the matrix during the construction of training and testing samples. The form of “4+1” was adopted when constructing samples, i.e., the wharf DEM for four consecutive days and the wharf DEM for the 5th day. However, since the wharf DEM belongs to a point cloud map, where each point is regarded as a detection point, inputting the entire DEM into the algorithm for training at once would result in a heavy computational load. Therefore, when constructing the sample set in the “4+1” form, n detection points were selected from the DEM, the DEM data of the n detection points for four consecutive days constituted a 4× input matrix, and the DEM data on the 5th day was the output label for the sample. In order to facilitate training and testing, was set to 6, then the input layer specification of the CNN was set to 4×6.
The convolutional layers of the CNN are the key to extracting image features. The more layers there are, the more feature details will be extracted, but the amount of computation will also increase. Therefore, 1, 2, 3, 4, and 5 convolutional layers were set respectively, and the activation function in the convolutional layers was set to relu, sigmoid, and tanh, respectively, to test the performance of the algorithm under different convolutional layer numbers and activation functions.
In addition, in order to further validate the performance of the proposed algorithm, it was compared with other algorithms, LSTM and GRU, which are essentially extensions of RNNs and share a similar structural framework. The parameters for the structure settings were referred to the GRU part of the combined algorithm.
3.3. Evaluation index
The mean absolute error (MAE) and root mean square error (RMSE) were used to assess the performance of the algorithm. The formulas are:
where MAE is the mean absolute error, RMSE is the root mean square error, is the number of observation days of wharf subsidence, is the actual observed value of the detection point on the -th day, and is the predicted observation value of the detection point on the -th day.
3.4. Test results
The performance of the combined algorithm was evaluated using different CNN activation functions and varying numbers of convolution layers. As shown in Table 2, under the same CNN activation function, the error index of the algorithm decreased with the increase of the convolutional layers. However, after three convolutional layers, the error index showed minimal change. Under the same number of convolutional layers, the algorithm using sigmoid as the activation function exhibited the lowest error index. Considering these results and the computational amount of the algorithm, the activation function was finally set to sigmoid, and the number of convolutional layers was set to three.
Then, the performance of the three prediction algorithms was compared (Table 3). The MAE and RMSE of the LSTM algorithm for predicting the wharf ground subsidence were 0.178 and 0.184, respectively. The values for the GRU algorithm were 0.114 and 0.126, respectively. The values for the CNN+GRU algorithms were 0.079 and 0.087, respectively. It can be seen that the CNN+GRU algorithm had the best performance in predicting wharf ground subsidence and consumed the least time.
Table 2Performance of the proposed algorithm under different activation functions and convolution layer numbers
Activation function | Convolution layer number | 1 | 2 | 3 | 4 | 5 |
Relu | MAE | 0.231 | 0.169 | 0.109 | 0.108 | 0.108 |
RMSE | 0.222 | 0.172 | 0.112 | 0.111 | 0.111 | |
Sigmoid | MAE | 0.187 | 0.104 | 0.079 | 0.078 | 0.078 |
RMSE | 0.193 | 0.115 | 0.087 | 0.086 | 0.086 | |
Tahn | MAE | 0.219 | 0.154 | 0.107 | 0.106 | 0.106 |
RMSE | 0.226 | 0.163 | 0.115 | 0.114 | 0.114 |
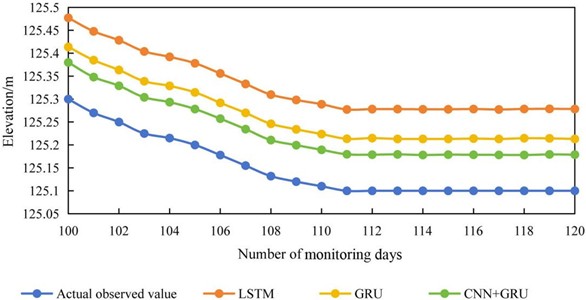
The average subsidence in the wharf area after some monitoring days and the prediction deviation of the subsidence amount by the three algorithms are shown in Table 3. The actual observed elevation value at a specific monitoring point in the wharf area over a specific time frame and the predicted elevation changes of the three algorithms are shown in Fig. 3.
Table 3Performance comparison of three algorithms
LSTM | GRU | CNN+GRU | |
MAE | 0.178 | 0.114 | 0.079 |
RMSE | 0.184 | 0.126 | 0.087 |
Time consumption | 2.15 | 1.69 | 1.23 |
As time went by, the elevation of the monitoring points gradually decreased, indicating subsidence; however, it stabilized after a certain period, indicating that the subsidence was not serious. The average subsidence changes of the entire wharf area in Table 4 further confirm that the subsidence was occurring, but it remained stable and not particularly serious. Moreover, by comparing the predicted elevation values from the three algorithms and the two evaluation indicators in Table 4, it can be seen that the predictions made by the CNN+GRU algorithm were closest to the actual observed values.
Table 4The average subsidence of the wharf area within certain monitoring days and the prediction deviations of the subsidence amount by the three prediction algorithms
Monitoring days / n | Actual average subsidence value / mm | LSTM | GRU | CNN+GRU | |||
MAE | RMSE | MAE | RMSE | MAE | RMSE | ||
100 | 3.1 | 0.178 | 0.184 | 0.114 | 0.126 | 0.079 | 0.087 |
101 | 3.0 | 0.181 | 0.188 | 0.117 | 0.130 | 0.082 | 0.089 |
102 | 2.0 | 0.186 | 0.193 | 0.120 | 0.132 | 0.084 | 0.091 |
103 | 2.5 | 0.191 | 0.195 | 0.122 | 0.135 | 0.086 | 0.093 |
104 | 1.0 | 0.195 | 0.200 | 0.125 | 0.139 | 0.088 | 0.095 |
105 | 1.5 | 0.200 | 0.203 | 0.128 | 0.142 | 0.091 | 0.097 |
106 | 2.2 | 0.203 | 0.207 | 0.131 | 0.144 | 0.093 | 0.099 |
107 | 2.3 | 0.207 | 0.210 | 0.134 | 0.148 | 0.096 | 0.101 |
108 | 2.3 | 0.212 | 0.213 | 0.138 | 0.151 | 0.098 | 0.103 |
109 | 1.2 | 0.216 | 0.218 | 0.141 | 0.154 | 0.101 | 0.105 |
110 | 1.0 | 0.220 | 0.221 | 0.143 | 0.157 | 0.103 | 0.107 |
111 | 1.0 | 0.225 | 0.226 | 0.147 | 0.160 | 0.105 | 0.110 |
112 | 0.6 | 0.229 | 0.229 | 0.150 | 0.164 | 0.106 | 0.113 |
113 | 0.6 | 0.234 | 0.232 | 0.152 | 0.167 | 0.108 | 0.114 |
114 | 0.4 | 0.238 | 0.236 | 0.156 | 0.171 | 0.110 | 0.117 |
115 | 0.4 | 0.241 | 0.239 | 0.160 | 0.174 | 0.112 | 0.119 |
116 | 0.2 | 0.245 | 0.241 | 0.163 | 0.178 | 0.115 | 0.121 |
117 | 0.1 | 0.250 | 0.245 | 0.166 | 0.180 | 0.116 | 0.123 |
118 | 0.1 | 0.253 | 0.249 | 0.168 | 0.183 | 0.118 | 0.125 |
119 | 0.0 | 0.256 | 0.252 | 0.170 | 0.185 | 0.121 | 0.128 |
120 | 0.0 | 0.261 | 0.256 | 0.174 | 0.189 | 0.123 | 0.130 |
Fig. 3The actual observed value of a monitoring point in the wharf area within a period of time and the predicted value of the three algorithms
4. Conclusions
This paper integrates a CNN with GRU to predict the wharf subsidence deformation. First, the DEM image features of the wharf area were extracted by using the CNN algorithm, and then the GRU algorithm was employed to identify the patterns of wharf subsidence changes. Then, the wharf of the Longtan Port area of Nanjing Port in Jiangsu Province was taken as the subject of the case analysis. When the number of convolutional layers in the CNN part was three and the activation function was set to sigmoid, the prediction performance of the algorithm was the best. Compared with the LSTM and GRU algorithms, the CNN+GRU algorithm showed the smallest error in predicting wharf subsidence. In the long-term prediction, the prediction error of the CNN+GRU algorithm was always the smallest. However, one limitation of this study is the reliance on SIFT features to construct the DEM of the wharf, as SIFT features can be significantly influenced by environmental factors such as changes in illumination and viewpoint. Moreover, the subject of case analysis was limited to Longtan Port. The performance of the CNN+GRU algorithm proposed in different ports has not been explored, lacking generalization. Therefore, the future research direction is to use a CNN to extract features for constructing DEM and expand the subjects of case analysis to enhance the generalization of the prediction model.
References
-
L. Chen, K. Hashiba, Z. Liu, F. Lin, and W. Mao, “Spatial-temporal fusion network for maximum ground surface settlement prediction during tunnel excavation,” Automation in Construction, Vol. 147, p. 104732, Mar. 2023, https://doi.org/10.1016/j.autcon.2022.104732
-
H. Samadi, J. Hassanpour, and E. Farrokh, “Maximum surface settlement prediction in EPB TBM tunneling using soft computing techniques,” Journal of Physics: Conference Series, Vol. 1973, No. 1, p. 012195, Aug. 2021, https://doi.org/10.1088/1742-6596/1973/1/012195
-
Z. F. Hu, J. Chen, Y. F. Qiu, and J. B. Li, “A simplified method for predicting ground surface settlement induced by deep excavation of clay stratum,” Journal of Yangtze River Scientific Research Institute, Vol. 36, No. 6, pp. 60–67, 2019.
-
B. Liu, W. Yang, G. Zhang, and L. Gao, “A prediction model based on stochastic medium theory for ground surface settlement induced by non-uniform tunnel deformation,” Chinese Journal of Rock Mechanics and Engineering, Vol. 37, No. 8, pp. 1942–1952, 2018.
-
M. Hasanipanah, M. Noorian-Bidgoli, D. Jahed Armaghani, and H. Khamesi, “Feasibility of PSO-ANN model for predicting surface settlement caused by tunneling,” Engineering with Computers, Vol. 32, No. 4, pp. 705–715, Mar. 2016, https://doi.org/10.1007/s00366-016-0447-0
-
Y. Fang, Z. Yang, G. Cui, and C. He, “Prediction of surface settlement process based on model shield tunnel driving test,” Arabian Journal of Geosciences, Vol. 8, No. 10, pp. 7787–7796, Feb. 2015, https://doi.org/10.1007/s12517-015-1800-0
-
Y. J. Ji, Y. P. Huang, J. W. Zeng, L. H. Ren, and Y. J. Chen, “A physical-data-driven combined strategy for load identification of tire type rail transit vehicle,” Reliability Engineering and System Safety, Vol. 253, p. 11049, 2025.
-
Y. Chen, X. Liu, M. Rao, Y. Qin, Z. Wang, and Y. Ji, “Explicit speed-integrated LSTM network for non-stationary gearbox vibration representation and fault detection under varying speed conditions,” Reliability Engineering and System Safety, Vol. 254, No. Part A, p. 110596, Feb. 2025, https://doi.org/10.1016/j.ress.2024.110596
-
Q. J. Pan, H. T. Wu, Z. L. Zhang, and K. Z. Song, “Prediction of tunneling-induced ground surface settlement within composite strata using multi-physics-informed neural network,” Rock and Soil Mechanics, Vol. 45, No. 2, pp. 539–551, 2024.
-
R. Zhang, Y. Li, A. T. C. Goh, W. Zhang, and Z. Chen, “Analysis of ground surface settlement in anisotropic clays using extreme gradient boosting and random forest regression models,” Journal of Rock Mechanics and Geotechnical Engineering, Vol. 13, No. 6, pp. 1478–1484, Dec. 2021, https://doi.org/10.1016/j.jrmge.2021.08.001
-
V. Ghiasi and M. Koushki, “Numerical and artificial neural network analyses of ground surface settlement of tunnel in saturated soil,” SN Applied Sciences, Vol. 2, No. 5, pp. 1–14, Apr. 2020, https://doi.org/10.1007/s42452-020-2742-z
-
Z. Ding, X.-J. Wei, and G. Wei, “Prediction methods on tunnel-excavation induced surface settlement around adjacent building,” Geomechanics and Engineering, Vol. 12, No. 2, pp. 185–195, Feb. 2017, https://doi.org/10.12989/gae.2017.12.2.185
-
X. Hu, B. Niu, X. Li, and X. Min, “Unmanned aerial vehicle (UAV) remote sensing estimation of wheat chlorophyll in subsidence area of coal mine with high phreatic level,” Earth Science Informatics, Vol. 14, No. 4, pp. 2171–2181, Aug. 2021, https://doi.org/10.1007/s12145-021-00676-5
-
W. Xiao, J. Chen, Y. Zhao, Z. Hu, X. Lü, and S. Zhang, “Identify maize chlorophyll impacted by coal mining subsidence in high groundwater table area based on UAV remote sensing,” Meitan Xuebao/Journal of the China Coal Society, Vol. 44, No. 1, pp. 295–306, Jan. 2019.
-
D. Ignjatović Stupar, J. Rošer, and M. Vulić, “Investigation of unmanned aerial vehicles-based photogrammetry for large mine subsidence monitoring,” Minerals, Vol. 10, No. 2, p. 196, Feb. 2020, https://doi.org/10.3390/min10020196
-
Z. Liu, G. Mei, and Y. Sun, “Investigating deformation patterns of a mining-induced landslide using multisource remote sensing: The songmugou landslide in Shanxi Province, China,” Bulletin of Engineering Geology and the Environment, Vol. 81, No. 5, pp. 1–16, May 2022, https://doi.org/10.1007/s10064-022-02699-8
-
Z. Motyka and B. P. Jelle, “System model for spatial mapping of anthropogenic sinkholes and subsidence basins in mining areas applying 2D laser scanner technique,” in E3S Web of Conferences, Vol. 106, p. 01007, Jun. 2019, https://doi.org/10.1051/e3sconf/201910601007
About this article

The authors have not disclosed any funding.
The datasets generated during and/or analyzed during the current study are available from the corresponding author on reasonable request.
Kai Li contributed the central idea, analysed most of the data, and wrote the initial draft of the paper. Heng Wang and Wenwu Cai contributed to refining the ideas, carrying out additional analyses, and finalizing this paper.
The authors declare that they have no conflict of interest.
