Abstract
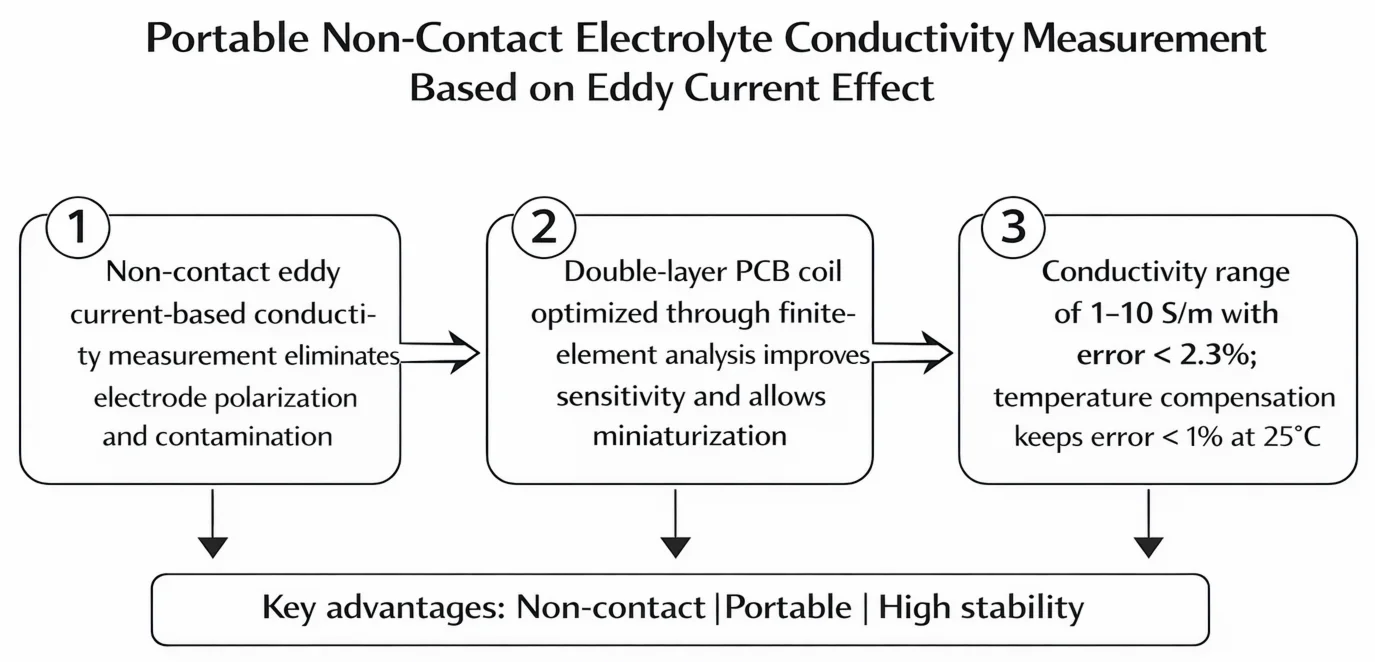
A non-contact portable electrolyte solution conductivity detection method based on the eddy current effect is proposed to overcome the issues of electrode polarization and susceptibility to contamination inherent in traditional contact measurement methods for electrolyte solution conductivity. Initially, the analysis focuses on the PCB planar coil to investigate the impact of geometric parameters such as coil line width, spacing, and number of turns on detection sensitivity, aiming to determine the optimal parameter combination. Subsequently, the hardware system integrates the LDC1001 inductance-digital converter and MCU architecture with a built-in digital communication interface and display module. This setup enables conductivity measurement and data visualization within the 1-10 S/m range. The system calculates the electrolyte solution conductivity by monitoring changes in coil inductance and parallel resistance. Experiments are conducted using solutions of varying conductivity. The results confirm the feasibility of determining electrolyte solution conductivity based on variations in coil inductance and resistance. Through temperature characteristic and anti-interference experiments, the system's stability, effective temperature compensation function, and robustness against interference are demonstrated. The relative error in measurements is found to be less than 2.3 %, with a temperature compensation error below 1 %. The entire system design is realized through PCB design. In comparison with conventional electrode conductivity meters, this method enables non-contact measurements, eliminating issues related to electrode polarization and contamination. Additional benefits include flexible design, real-time display of measurement results, and portability.
Highlights
- A portable non-contact electrolyte conductivity measurement system based on eddy current effect is proposed, eliminating electrode polarization and contamination issues associated with conventional contact conductivity sensors.
- A double-layer circular PCB coil probe optimized through finite-element analysis improves sensor sensitivity and stability while enabling miniaturization and portable system integration.
- The developed system measures conductivity in the 1–10 S/m range with a relative error below 2.3%, and temperature compensation reduces measurement deviation to less than 1% at 25 °C.
1. Introduction
The conductivity of an electrolyte solution stands as a pivotal parameter for assessing the solution's characteristics, holding substantial importance across diverse fields including food safety, power generation, semiconductor manufacturing, and pharmaceutical products [1]. Currently, conductivity is assessed through electrode-based measurements, capacitively coupled conductivity measurements, and eddy current detection methods [2].
Electrode-based conductivity sensors are contact measurements, which are usually realized using the two-electrode method or the four-electrode method. In the two-electrode method, the current path may not be confined between the two electrodes, and an electrochemical reaction occurs on the surface of the electrodes to form a polarized layer. The polarization layer forms at the electrode/electrolyte interface due to non-uniform ion migration and charge accumulation under an external electric field, which result in an uneven charge distribution and potential difference across the interface. It represents the charge accumulation area resulting from electrochemical reactions. This layer creates polarization impedance that can disrupt conductivity measurements, especially at low frequencies or in DC conditions. And two-electrode connection. The contact resistance between the electrodes and the electrolyte solution, as well as the lead resistance, introduces additional impedance, and these factors contribute to the low measurement accuracy of the two-electrode method [3]. The four-electrode conductivity meter is not affected by the contact resistance but still fails to solve the polarization effect and current path problem [4]. As the electrolyte solution contains a large number of salts, these salts form an electrolyte solution on the electrode surface, which promotes electrochemical reactions and leads to corrosion of the electrode material. As for the non-contact measurement method, no metal electrode is used in the measurement, the metal part of the sensor is not in direct contact with the object to be measured, and the non-metallic housing is not easy to corrode and avoids the influence of polarization effect. Therefore, non-contact sensors are more suitable for high stability measurements in harsh environments [5].
Non-contact conductivity sensors are mainly categorized into capacitively coupled measurements and eddy current inductive measurements. The capacitive coupling conductivity measurement method indirectly measures the conductivity of a liquid by utilizing an alternating electric field passing through an insulating medium such as pipeline walls, containers, or coatings. High-frequency (Usually refers to 10Khz to10Mhz.) electric fields cause ions in a liquid to move directionally, altering the system's impedance and leading to signal attenuation and phase shift at the receiver. By measuring the voltage changes or phase shifts in the received signal, along with circuit modeling, the liquid's conductivity can be inferred. In [6-8], capacitive coupling-based technique is utilized to measure the conductivity of electrolytic solutions using two C4Ds combined in the sensor, one for signal detection and the other for compensation of noise and drift. The C4D unit is placed in the feedback loop of the operational amplifier and the difference between the instrumentation amplifier and operational amplifier outputs is utilized to obtain the final output, which also reduces noise. Incorporating an LC circuit in the circuit reduces the operating frequency of the sensor by adjusting the inductance and capacitance [9]. All these methods improve the capacitively coupled measurement accuracy. However, capacitively coupled measurements are applied to measure analytes in capillary electrophoresis [10], microchip electrophoresis[11]and chromatography [12], where the measurement vessel is mostly a small-sized pipe, the use of the environment is restricted and the measurement range is small, compared with eddy current inductive measurements, which suffer from severe attenuation of the electric field, saturated capacitance changes, and insufficient sensitivity in the face of a higher conductivity measured object. Therefore, eddy current detection technology plays an irreplaceable role in many scenarios and is widely used in semiconductor manufacturing, metal detection, aerospace and other fields [13], [14].
In recent years, researchers have conducted numerous studies on eddy-current sensors, leading to significant advancements in measurement accuracy and range. In the context of eddy current conductivity measurement, mitigating the adverse effects of the lift-off effect presents a considerable challenge [15]. Researchers such as [16], [17] have addressed this issue by utilizing an LC resonator as a measurement probe. They have effectively minimized the impact of the lift-off effect by establishing a mathematical relationship between the resistance of the LC resonator at resonance and variables such as resonance frequency and conductivity. Furthermore, Sun and colleagues [18] have enhanced sensor performance by refining the driving circuit and incorporating a crystal oscillator circuit in place of the conventional Colpitts oscillation circuit. This modification has resulted in a more stable circuit with improved linearity and sensitivity, thereby enhancing the overall performance of the sensor. For eddy current sensor parameter optimization, in [19], [17], the theoretical analysis of the sensor by establishing a simulation model and using finite element analysis can quickly evaluate the sensor performance and propose an optimization method for the effect of coil parameters on the measurement performance. Sun Bin et al. [20] theoretically analyzed the main parameters of the sensor system, such as frequency, coil spacing, and number of turns, and obtained the optimal frequency band to stabilize the output voltage through computational analysis. At present, most of the mainstream eddy current detection methods are applied in the direction of micro-displacement measurement, metal detection, etc., less research for the determination of conductivity of electrolyte solution, and does not take into account the actual use of the sensor miniaturization, portable design needs.
Based on the aforementioned research, a miniature measurement circuit for evaluating the conductivity of electrolyte solutions is proposed. Through comprehensive optimization of coil structure, quality factor, resonant measurement circuit, and temperature compensation, the system achieves miniaturization and portability while fully leveraging the core advantages of eddy current detection: non-contact measurement, high stability, and high sensitivity. It also effectively reduces the overall circuit size. The paper elaborates on a model for measuring electrolyte solution conductivity based on the principles of eddy currents. A corresponding simulation model is developed using finite element analysis to analyze and optimize key factors that impact the sensor's sensitivity and size. Utilizing a PCB coil as the measurement probe, the system determines the conductivity of the electrolyte solution by monitoring changes in coil resistance and inductance induced by the eddy current effect. A non-contact system for detecting electrolyte solution conductivity is constructed, and the validity of this measurement method is confirmed through experiments involving electrolyte solutions with varying conductivities.
2. Theoretical analysis
2.1. Structure
A non-contact portable electrolyte solution conductivity measurement system was designed to achieve stable measurement of electrolyte solution conductivity while reducing the overall size of the sensor to enhance portability. The overall structure of the non-contact portable electrolyte solution conductivity measurement system is shown in Fig. 1.
Fig. 1System structure
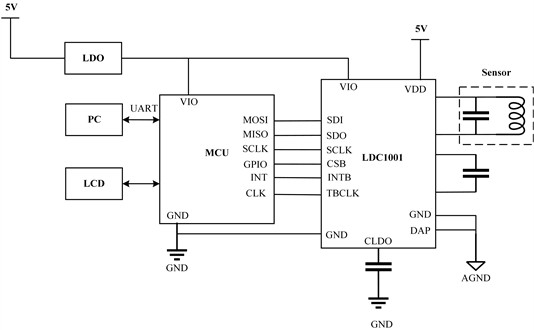
In this system, the operation of the measurement module is under the control of the MCU. The impedance of an electrolyte solution (including inductance and equivalent resistance ) undergoes quantifiable changes depending on factors such as distance and solution conductivity. By keeping the coil probe in a fixed position relative to the solution, changes in impedance can be used to determine changes in solution conductivity. This system measures the inductance and parallel resistance values of the coil through the frequency measurement module and the parallel resistor measurement module in LDC1001. The measured signals are then converted to digital signals, transmitted to the MCU using SPI communication for convenient signal processing by the subsequent microcontroller. This process aids in facilitating the signal processing by the subsequent microcontroller. To address interference caused by temperature variations stemming from ionic motion changes affecting conductivity measurements, a small, easily integratable, precise, and efficient temperature sensor is employed for temperature measurement. The MCU receives the inductance and impedance values output by the measurement module, converting them to conductivity through data fitting. These conductivity values are then adjusted with the measured temperature values, and software compensation is applied to uniformly compensate for conductivity variations. The software compensation ensures that the conductivity is standardized to the value at 25 ℃. At the same time through the UART communication to send the data to the host computer real-time display. The comprehensive implementation of miniaturized design enhances the portability of the non-contact electrolyte solution conductivity measurement sensor.
2.2. Circuit model
The portable non-contact conductivity measurement system is based on eddy current detection technology. Driven by a high-frequency signal (Usually refers to 10 Khz to 10 Mhz), the detecting coil generates an alternating magnetic field, and when the electrolyte solution is close to the detecting coil, the alternating magnetic field penetrates the electrolyte solution and induces an eddy current on its surface. The induced eddy currents generate a secondary magnetic field in the opposite direction, and the superposition of the secondary magnetic field with the primary magnetic field leads to a change in the magnetic field distribution around the detection coil, affecting the impedance of the detection coil. When detecting, the impedance of the coil will also be affected by the conductivity of the electrolyte solution, the distance from the coil to the object to be measured, the current, the excitation frequency and so on. When changing the conductivity of the measured solution, the other parameters are controlled unchanged, and the impedance parameter changes of the coil are detected by the corresponding signal detection circuit, thus realizing the measurement of the conductivity of the measured solution.
The equivalent circuit of the non-contact portable electrolyte solution conductivity measurement system is shown in the Fig. 2. is the excitation voltage, and are the series resistance and coil inductance of the detection coil itself, and are the equivalent resistance and equivalent inductance of the target solution, and is the mutual inductance between the coil and the solution, is the resonant capacitance of the detection circuit.
Fig. 2Equivalent circuit
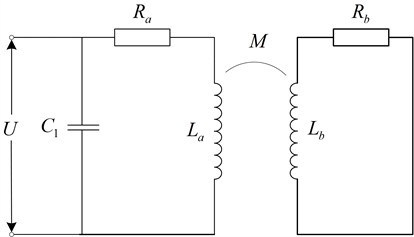
By equating the measured solution to a series connection of resistance and inductance, the sensor coil will be magnetically coupled to the eddy currents on the measured solution, thus obtaining an equivalent circuit for eddy current detection. According to Kirchhoff’s law, analyzing the equivalent circuit in Fig. 2. Eq. (1) can be obtained:
The equivalent resistance of the sensor coil is extracted from Eq. (1) as the sum of the coil’s own resistance and the parasitic resistance of the eddy currents . In Eq. (2), is the resistance of the coil itself, and the fractional term is the additional resistance (eddy current loss) caused by the target solution. It reveals the mechanism of influence of excitation frequency, coil-solution coupling, and solution electromagnetic properties on changes in the resistance component of the sensor:
The equivalent inductive coil of the sensor coil is the sum of its own inductance and the target coupling inductance :
Analyzing Eq. (2) and Eq. (3), the equivalent resistance and equivalent inductance of the coil are affected by the mutual inductance M between the coil and the solution as well as the equivalent resistance and equivalent inductance of the solution. When changing the conductivity of the solution, its equivalent resistance and equivalent inductance produce changes due to eddy current effect resulting in changes in the equivalent resistance and equivalent inductance of the coil, in the actual measurement can be obtained from the coil inductance-resistance changes. The corresponding change in the conductivity of the electrolyte solution under study was determined. At the same time, the mutual inductance M will decrease with the increase of the distance between the coil and the solution, thus generating the lifting effect, so it is necessary to control the distance between the coil and the solution to be measured to remain unchanged in the eddy current detection process.
For inductance measurements, when the sensor coil is operating, its frequency is calculated as shown in Eq. (4):
In the vast majority of cases, is much smaller than , which can be approximated:
The measurement of can be accomplished with a frequency counter, and the capacitance is known, so the inductance to be measured can be calculated to obtain the relationship between inductance and conductivity.
Variations in the electrolyte solution's conductivity led to alterations in the coil resistance. However, measuring the sensor coil's resistance directly poses challenges. Consequently, resistance is not measured directly but rather by measuring the equivalent parallel resonant impedance. The measurement principle and equivalent circuit diagram are shown in Fig. 3.
Fig. 3Parallel resonant measurement circuit
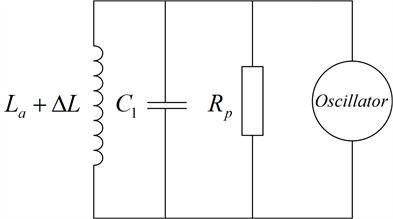
Analyzing the circuit gives the formula for the equivalent parallel resistance as in Eq. (6):
The change in inductance is induced by the electrolyte solution, while the change in parasitic resistance is caused by the variation in the solution's conductivity. When the solution’s conductivity varies, it affects both and , thereby altering the parallel resistance . The parallel resistance , as shown in Eq. (6), reflects the changes in the coil’s parasitic resistance and inductance. Since and are closely related to the conductivity of the solution, the variation in can be measured to indirectly determine the solution's conductivity.
3. Simulation and analysis
In electrolyte solution conductivity testing, the design of the sensor coil has a direct impact on the sensor’s detection performance. PCB coils offer higher precision, better repeatability and stability than wound coils, and can be customized for complex shapes. Compared with FPC coils, PCB coils have additional advantages in current-carrying capacity, thermal stability, and integration, and can meet the needs of high-power and high-integration applications [21]. Therefore, in order to meet the design requirements of miniaturization and portability, this paper chooses to use PC coils as sensor coil probes.
Q factor is an important indicator of coil performance. A high Q factor indicates that the inductor coil has low loss, high stored energy and high sensitivity [22]. The main parameters affecting the overall structure of the sensor coil include: number of turns , inner diameter , outer diameter , traces width , traces spacing , number of layers, and PCB coil shape. The key structural parameters of the sensor coil can first be determined by finite element simulation to achieve the need for better sensitivity in a smaller size. The use of finite element simulation can be effective, fast and inexpensive to obtain a reasonable model of the coil probe, to achieve a better coil performance in a smaller coil size, to meet the need for portability.
The coil configuration plays a pivotal role in the sensor probe, influencing the distribution of eddy currents across the surface of the electrolyte solution being measured. Thus, the initial step involves defining the shape of the sensor coil. To explore the distinct impact of coil shape on the sensor, circular, rectangular, and hexagonal coils were specifically crafted. These coil variations were analyzed to discern the Q factor trends across different coil geometries, with the coil shapes depicted in Fig. 4.
Fig. 4Coil shape
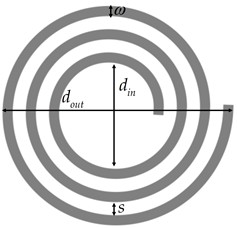
a) Circular
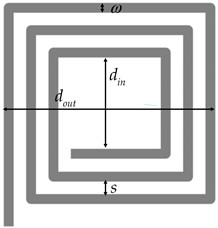
b) Rectangle
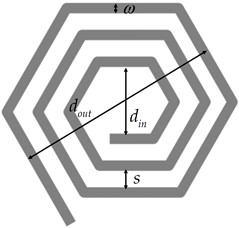
c) Hexagonal
While analyzing different coil shapes, the effect of number of turns on the quality factor can be analyzed at the same time. In order to avoid the influence of other factors on the results, keeping the relevant factors like outer diameter, wire width, wire spacing, number of layers, etc. the same, the number of turns of the coil is gradually increased and the value of the quality factor of the coil is shown in the Fig. 5.
From Fig. 5, it can be obtained that, all other things being equal, circular spiral PCB coils possess better Q factor as compared to rectangular as well as polygonal coils. Moreover, the magnetic field generated by the circular spiral PCB coil is more symmetrical compared to other shapes of coils, which makes it an ideal coil shape and the highest possible sensing capability and sensitivity can be obtained by using circular instructors [23]. Therefore, in this paper, we choose to use circular spiral PCB coil as the sensor coil. Meanwhile, from the above figure, we can get that as the number of turns of the coil increases, the Q factor increases gradually, but as the number of turns of the coil increases, it will increase the size of the sensor coil, which will not be able to satisfy the demand of miniaturization and easy portability.
In order to study the correlation between the number of coil layers and the coil Q factor, the coil shape was determined to use a circular shape to analyze the effect of different number of coil layers on the sensitivity of the sensor. The correlation between the quality factor of the detected coil and the number of coil layers is shown in Fig. 6.
Fig. 5Effect of coil shape and number of turns on Q factor
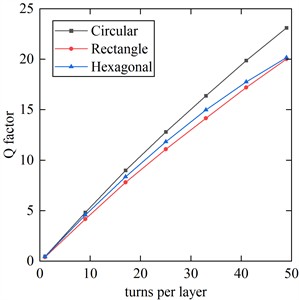
Fig. 6Effect of number of layers on Q factor
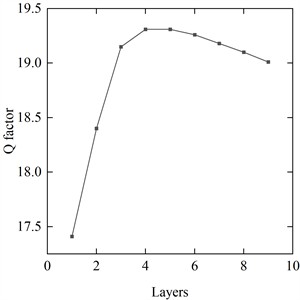
As shown in Fig. 6, multi-layer coils exhibit a significant advantage over single-layer coils in terms of the Q factor, with double-layer and triple-layer coils demonstrating the most notable improvements. This enhancement can be attributed to the design of multi-layer coils, which effectively reduces the equivalent series resistance (ESR) of the coil, thereby minimizing energy losses. Furthermore, the multi-layer structure increases the total inductance of the coil and optimizes the coupling effect between the layers, further improving the Q factor. Additionally, the geometric configuration of double-layer and triple-layer coils makes more efficient use of space, enhancing magnetic field concentration and ultimately boosting coil performance. Therefore, in terms of Q factor improvement, multi-layer coils significantly outperform single-layer coils, with the double-layer and triple-layer coils showing the most remarkable performance. The Q factor peaks at the fourth layer of coils and subsequently diminishes as the number of layers increases further. Multi-layer coils play a vital role in enhancing probe performance by enabling greater coil turns and more intricate wiring within a confined space. This capability is particularly crucial for miniaturized and high-performance electronic devices, especially in sensors requiring heightened sensitivity and accuracy. Nevertheless, excessive layering can lead to amplified parasitic capacitance and inductance effects, limiting the potential enhancements in coil performance. Factors such as signal transmission, impedance matching, and interlayer electromagnetic interference must be carefully considered as the number of layers increases. The heightened inter-layer parasitic capacitance can reduce the self-resonant frequency, necessitating the selection of appropriate structural parameters to maintain the coil at an optimal operating frequency. In practical PCB manufacturing processes, the design with a three-layer structure is seldom utilized. Therefore, when determining the number of coil layers, double-layer coils are preferred due to their pronounced enhancement in quality factor, along with a straightforward and cost-effective fabrication process. This choice aligns with the requirements for compact size and portability. Therefore, investigating the influence of coil layer number on the Q factor and sensitivity is essential, as it helps to elucidate the intrinsic relationship between structural parameters and sensing performance, and provides a theoretical basis and design guideline for achieving high-Q, high-sensitivity, and miniaturized sensor designs.
Fig. 7Effect of traces width and traces spacing on quality factor
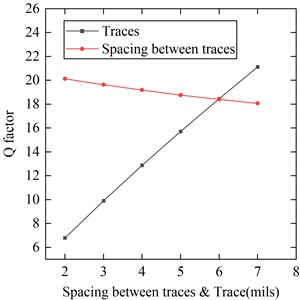
Traces width and traces spacing are the key factors affecting the sensitivity of the sensor, analyze the relationship between coil line width and line spacing and Q factor. From the Fig. 7. it can be seen that as the wire width increases; the Q value increases. With the increase of line spacing, if the size of the outer diameter remains the same, it means that the number of turns becomes less, and the Q value becomes smaller. Line width directly affects the sensitivity of the coil, should not be selected too small, to determine the line width, select a small line spacing, is conducive to improving the performance of the probe coil.
4. Measurement system design
4.1. Circuit model
Based on the analysis of the main influencing parameters of the overall structure of the sensor coil in the previous section, it was finally determined that a double-layer circular PCB coil was used, which is a shape that can save the space of the equipment and reduce the occupied volume, and can maintain a high Q factor to reduce the loss of eddy currents and improve the response speed and sensitivity. In order to avoid the influence of the lift-off effect on the measurement, the measuring coil was insulated and directly immersed in the solution to be measured during the measurement. The sensor coil was designed using the parameters in the Table 1.
Table 1Coil parameters
Parameters | Value |
Inductor | 57.85 uH |
Outer diameter | 25 mm |
Turns | 36 |
Wire width | 0.152 mm |
Spacing between lines | 0.152 mm |
Layers | 2 |
Q Factor | 20 |
Lead material | Cu |
Substrate material | FR4 |
4.2. Measurement modules
Simulation model can only analyze the change rule of the relevant parameters of the coil, but in the actual measurement is difficult to directly measure the coil inductance and resistance of the amount of change, so it is necessary to convert these changes into voltage or frequency output in the measurement circuit. The measurement circuit of the sensor system is based on the LDC1001 of Texas Instruments Incorporated (TI), which is designed for measuring parallel resistance and inductance.
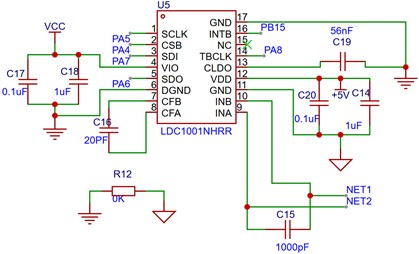
is measured by the LDC1001's built-in measurement unit. The device adopts closed-loop control to regulate the oscillation amplitude of the LC resonator to keep it constant, and measures the driving current and voltage through a high-precision ADC to detect and calculate the energy loss of the resonator in real time, and then realizes the function by inverting the calculated energy loss. After the measurement, a digital signal inversely proportional to the value of is output. CLDO is connected to the ground through a 56 nF capacitor, which is used for the chip’s internal LDO. Filter capacitors are connected to CFA and CFB for optimal performance. A 0 resistor is used to connect GND and DGND to avoid mutual interference. The 0 Ω resistor corresponds to a very narrow current path, which effectively limits the loop current and allows noise to be suppressed. During measurement, connect PCB coil probes at NET1 and NET2. By measuring the parallel resistance and frequency, it is converted into a digital signal and stored in a register, then the data is transferred to the master chip through SPI communication, and then the master chip processes the signal. The circuit diagram is shown in Fig. 8.
Fig. 8LDC1001 circuit
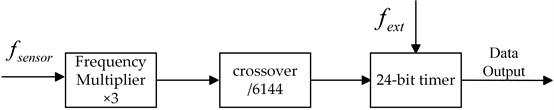
The measurement module can also measure the frequency of the detection coil; The system uses the frequency measurement method whose principle is shown in Fig. 9. The signal is used as the output of the LC parallel resonant circuit and is conditioned and fed into the internal inductance measurement module. First, the passes through an internal frequency multiplier whose frequency is boosted to three times its original. Next, the signal enters the frequency divider, which is set to a dividing factor of 6144. After the dividing process, the signal is finally fed into a 24-bit timer, where represents the clock frequency of the timer, which is provided by the external clock signal or MCU, supporting up to 8 Mhz. The timer is responsible for measuring the period of the signal after the frequency divider, which in turn accomplishes the accurate measurement of the .
Fig. 9Frequency measurement
4.3. Measurement modules
Temperature changes affect the rate of ion migration and the degree of ionization in a solution, and for conductivity, when the temperature increases or decreases, the conductivity increases or decreases accordingly, and a temperature hold or conductivity correction is used to reduce the effect of temperature on the measurement results. In this paper, the MLX90614 is used to achieve temperature measurement, which can achieve high precision contactless measurement with small size. This sensor features a measurement accuracy of ±0.5 °C, a resolution of 0.02 °C, and supports I2C digital and 10-bit PWM outputs. It has a field of view angle of 35°.
Fig. 10Temperature sensor circuit
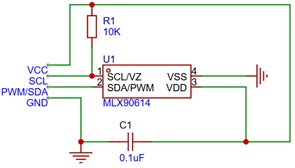
Sensor by the internal infrared thermopile sensor sensing the infrared radiation emitted by the object, the sensed infrared signal through the low noise amplifier to amplify the amplified signal through the analogue-to-digital converter converted to digital signals, by the digital signal processor (DSP) for filtering and linearization, through the internal calibration coefficients (stored in the EEPROM), the raw data is converted to a linear temperature value, the circuit diagram As shown in Fig. 10.
4.4. Structure
STM32F103C8T6 was selected for control and communication with LDC1001, which is characterized by low price and good open source. The data from the measurement module is accepted, and the accepted parallel resistance and frequency data are processed into conductivity for output. It also receives data from the temperature measurement module and performs temperature compensation of the conductivity in combination with the obtained temperature data. The temperature measurement module and the display module are connected externally via connectors.
Fig. 11PCB Schematic
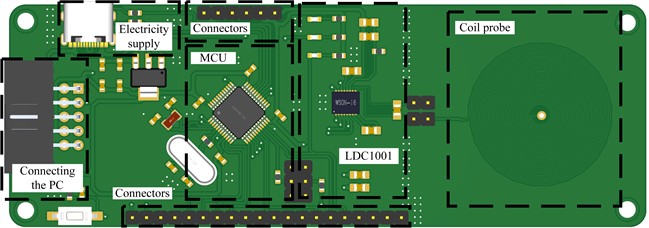
The digital inductor converter is set not to set the sleep mode through the main control chip; the clock frequency is set to 8Mhz and the frequency divider is taken as 6144 to get the highest possible resolution [24]. The relevant signals generated by the coil probe are collected by a frequency meter and a parallel resistance measurement unit, stored in registers and then output after data fitting. The power supply is regulated by a low dropout linear regulator chip, which reduces the impact of power ripple on the circuit. At the same time, the main control chip itself is connected to a PC to analyze the sensor data and then store it, and the whole system design is implemented using PCB design. Its overall structure is shown in Fig. 11.
5. Experimental analyses
5.1. System validation experiments
To validate the theoretical analysis in Chapter 2 and the circuit design in Chapter 4, a portable detection device was designed to build a complete experimental platform. The detection device is shown in Fig. 12, the whole system design implementation is using PCB design, the overall appearance of the rectangle, the maximum height of 50mm, the maximum length of the shape of 120 mm, has a small, easy to carry the characteristics of the electrolyte solution conductivity can be achieved rapid detection.
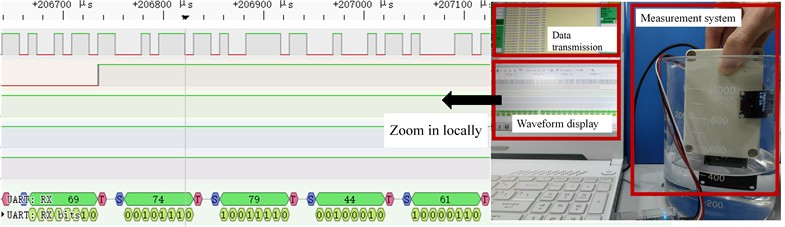
In this paper, NaCl solution was selected as the object of measurement, and the conductivity of the calibration solution was calibrated using an electrode-type conductivity meter (LeiCi DDSSJ-307A). This meter features a conductivity range of 0-10 S/m, a measurement error of less than 1 % within an ambient temperature range of 0-40 °C, an automatic range-switching capability, and a conductivity electrode constant compensation function. Comparing the electrode conductivity meter and the electrolyte solution conductivity detection system, it can be seen that the studied conductivity meter has the advantages of small size, better portability compared with the traditional electrode conductivity meter, and the ability to perform conductivity measurements in more complex environments. The physical measurement results are shown in Fig. 13.
Fig. 12Detection device object. Photo by Shuai Wu on March 27, 2025, at the Sensor Laboratory of Shanghai Ocean University
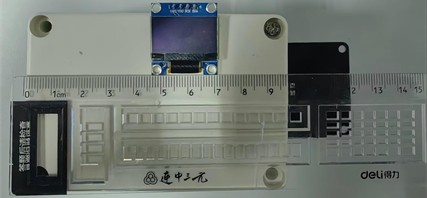
Fig. 13Physical measurement and waveform display. Photo by Shuai Wu on March 27, 2025, at the Sensor Laboratory of Shanghai Ocean University
The solution conductivity is calibrated using an electrode-type conductivity meter, configured with different concentrations of NaCl solutions and covering the measurement range. At the same time, a non-contact conductivity measurement system was used to perform the test and record the data. The data obtained by the system are the value of the parallel resonance impedance and the frequency change of the sensor due to the change of inductance, record these data, and analyze and fit these data to get the value of the conductivity of the electrolyte solution through the fitting curve to realize the measurement of the conductivity of the electrolyte solution. Table 2 shows the fitting equations for frequency and resistance, as well as the relevant parameters.
Table 2Data fitting results
Fitting content | Fitting equation | ||
Frequency | 0.998 | 72.131 | |
Resistance | 0.998 | 0.000513 |
According to Table 2, both models exhibit values close to 1, indicating a high degree of goodness of fit for the regression equations. The resistance regression equation shows a smaller SSE, suggesting a higher level of fitting accuracy. Fig. 14 shows the fitting curve and measured points.
Fig. 14Two fitted curves
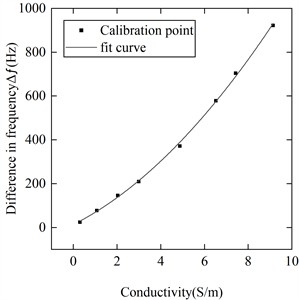
a) Frequency-conductivity fitting curve
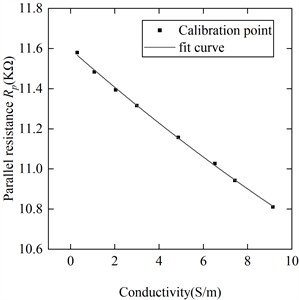
b)-conductivity fitting curve
The experimental findings indicate a linear relationship between and the conductivity of the electrolyte solution. diminishes progressively as the solution conductivity rises. Conversely, the frequency change escalates with increasing solution conductivity, albeit with a lower level of linearity. During the measurement procedure, both the obtained value and the frequency value can be concurrently assessed. The measurement outcomes alongside the associated errors are detailed in Table 3.
Table 3Measured results and errors
Standard conductivity S/m | Frequency fitted conductivity S/m | Relative error | Resistance fitted conductivity S/m | Relative error |
2.16 | 2.13 | –1.37 % | 2.12 | –1.84 % |
2.94 | 2.87 | –2.25 % | 2.88 | –2.08 % |
4.81 | 4.75 | –1.17 % | 4.83 | 0.45 % |
6.39 | 6.52 | 2.00 % | 6.41 | 0.32 % |
7.50 | 7.58 | 1.09 % | 7.63 | 1.71 % |
8.93 | 8.73 | –2.27 % | 8.91 | –0.27 % |
The table data demonstrates that the error in conductivity estimation derived from monitoring variations and measurement frequency remain consistently below 2.3 % across all test points. This demonstrates that the system is capable of providing highly accurate conductivity measurements. Furthermore, upon contrasting the relative errors between the two methods, it becomes evident that the error associated with monitoring is relatively minor, accompanied by superior curve fitting linearity. Consequently, the measurement of should be regarded as the primary basis for assessment.
5.2. Temperature characteristics experiment
Temperature changes can affect the sensitivity, zero point, and output characteristics of sensors. Through temperature experiments, sensors can be calibrated for their output at different temperatures, reducing errors caused by temperature drift and improving the accuracy of measurement data. To assess the temperature response characteristics of the conductivity detection system, the temperature was systematically elevated from 15 °C to 25 °C through incremental adjustments. To minimize experimental inaccuracies, a cooling procedure was conducted in reverse, lowering the temperature from 25 °C back to 15 °C following the same protocol. The conductivity of the electrolyte solution was recalibrated at each temperature point during both the temperature increase and decrease phases. Multiple experiments were averaged to enhance precision, and the outcomes of the temperature characterization experiments, including associated errors, are detailed in Table 4.
Table 4Temperature characteristics experimental results and errors
Temperature / °C | Standard conductivity S/m | Fitted conductivity S/m | Relative error |
15.1 | 4.58 | 4.54 | –0.86 % |
17.8 | 4.86 | 4.75 | –1.97 % |
20.4 | 5.12 | 5.09 | 0.59 % |
22.5 | 5.38 | 5.35 | –0.57 % |
25.2 | 5.66 | 5.58 | –1.34 % |
As can be seen from the table, the non-contact seawater conductivity detection system at each temperature node for the solution conductivity measurement effect is basically the same, and the error is less than 2.3 %. It can be shown that the system can maintain stable measurement in the conventional temperature environment. The effect of temperature change on resistance is mainly reflected in the change of resistance value, which is closely related to the temperature coefficient of material (TCR). For most metal resistors, an increase in temperature results in an increase in resistance value, a phenomenon known as positive temperature coefficient (PTC). The TCR of common chip resistors generally ranges from ±20 ppm/°C to ±100 ppm/°C, which means that the resistance value of a 1 kΩ resistor changes by less than 1 Ω under a temperature change of 10 °C. Therefore, the effect on sensor impedance measurement is not significant under regular temperature changes.
However, temperature changes affect the rate of ion migration and the degree of ionization in a solution, and when the temperature increases or decreases, the conductivity increases or decreases accordingly. The main reason for compensating the temperature to 25 °C (or standard temperature, as it is called) when measuring conductivity is to eliminate the effect of temperature on conductivity and to ensure uniformity, comparability, and standardization of measurement results. Temperature holding or conductivity correction is generally employed to minimize the effect of temperature on the measurement results. In this paper, a contactless thermometer is used to measure the temperature, and the output data is linearly proportional to the temperature of the object, with high accuracy and high resolution. The microcontroller collects the temperature data in real time and compensates to the conductivity at 25 °C uniformly after Eq. (7):
where is the temperature, is the conductivity at temperature , and is the conductivity at 25 °C. The results are shown in Table 5.
Table 5Temperature compensation experiment results and error
Temperature / °C | Fitted conductivity S/m | Temperature compensated conductivity S/m | Relative error |
15.1 | 4.54 | 5.62 | 0.72 % |
17.8 | 4.75 | 5.53 | –0.89 % |
20.4 | 5.09 | 5.61 | 0.54 % |
22.5 | 5.35 | 5.64 | 1.07 % |
25.2 | 5.58 | 5.59 | 0.18 % |
5.3. Stability experiments
Long-term testing of sensors is a critical step in assessing their reliability, durability, and performance stability, especially in scenarios involving long-term continuous operation, such as industrial automation, environmental monitoring, and medical equipment. In order to test the stability of the system and anti-interference, 32 hours of long-time static use of the sensor experiment was set up, of which the first 6 hours will be placed in the sensor 5cm metal objects as interference, and the subsequent metal objects will be removed. Specific experimental results are shown in Fig. 15.
Fig. 15Long-term data
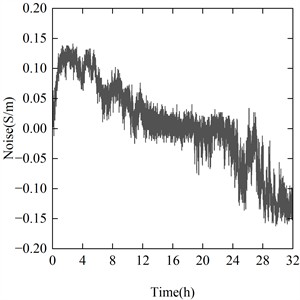
As can be seen from the above figure, the experiment just started to produce an error, and the error continued to float around 0.1, the error continued to remain in a lower range after the removal of the metal interfering objects, but with the increase in the use of time, the error gradually increased again, and after the test of 24 h, a large fluctuation occurred. This may be due to the effect of aging problems with the clock or capacitors caused by prolonged use. During the whole testing process, the error is always kept within ±0.15 S/m. The experimental results prove that the coil measurement system has good anti-interference and stability for long time use.
6. Conclusions
A non-contact portable conductivity measurement system based on eddy current with a double-layer PCB coil is proposed, and a measurement circuit based on the variation of coil inductance and the variation of coil parallel resistance is designed. Through theoretical analysis and the use of finite element simulation, the key parameters influencing the sensor coil's performance were analyzed and the coil structure parameters are optimized. A non-contact portable electrolyte solution conductivity test platform was also constructed and experimentally tested based on the simulation and analysis results. The results show that the relative errors of the measurement system are all less than 2.3 %, which verifies the feasibility of conductivity measurement and the validity of the simulation theory. Meanwhile, the sensors were tested in different temperature environments, as well as long-time use tests. The experimental results show that the error is still controlled within 2.3 %. Meanwhile, the temperature compensation is increased, and the relative error between the conductivity value at other temperatures and the actual value after compensating to 25 ℃ is 1.07 % at the most, which shows that the measurement system, utilizing the double-layer PCB coil structure, demonstrates excellent stability and effective temperature compensation. At the same time, through the miniaturization design, the whole sensor has good portability.
The system facilitates non-contact measurements, mitigating electrode head corrosion risks. Its stable and reliable structure, alongside waterproof and insulated sensor features, enables adaptation to harsh environments. The portability of the system supports versatile applications for solution conductivity measurements. The utilization of off-the-shelf components enhances cost-effectiveness. While the system excels in typical operating conditions, it has yet to undergo evaluation under more extreme temperatures and lacks a dedicated power source. Future enhancements will prioritize bolstering measurement circuit stability to ensure accuracy in challenging environments, implementing independent battery power supply, and optimizing overall power efficiency. The theoretical analysis of the influence factors of the PCB coil probe and the optimization of high-precision eddy current inductance conductivity sensors holds significant reference value for further research and development endeavors.
References
-
W. Zhang, X. Chen, Y. Wang, L. Wu, and Y. Hu, “Experimental and modeling of conductivity for electrolyte solution systems,” ACS Omega, Vol. 5, No. 35, pp. 22465–22474, Sep. 2020, https://doi.org/10.1021/acsomega.0c03013
-
C. Thirstrup and L. Deleebeeck, “Review on electrolytic conductivity sensors,” IEEE Transactions on Instrumentation and Measurement, Vol. 70, pp. 1–22, Jan. 2021, https://doi.org/10.1109/tim.2021.3083562
-
Satish et al., “Feasibility of electrolytic conductivity of aqueous solutions using two-electrode system,” MAPAN, Vol. 38, No. 2, pp. 337–341, Jan. 2023, https://doi.org/10.1007/s12647-022-00612-y
-
P. M. Ramos, J. M. D. Pereira, H. M. G. Ramos, and A. L. Ribeiro, “A four-terminal water-quality-monitoring conductivity sensor,” IEEE Transactions on Instrumentation and Measurement, Vol. 57, No. 3, pp. 577–583, Mar. 2008, https://doi.org/10.1109/tim.2007.911703
-
Z. Liao et al., “A direct-reading MEMS conductivity sensor with a parallel-symmetric four-electrode configuration,” Micromachines, Vol. 13, No. 7, p. 1153, Jul. 2022, https://doi.org/10.3390/mi13071153
-
C. Wang, H. Xing, B. Zheng, H. Yuan, and D. Xiao, “Simulation and experimental study on doubled-input capacitively coupled contactless conductivity detection of capillary electrophoresis,” Scientific Reports, Vol. 10, No. 1, p. 7944, May 2020, https://doi.org/10.1038/s41598-020-64896-3
-
M. Jaanus, A. Udal, V. Kukk, K. Umbleja, J. Gorbatsova, and L. Molder, “Improved C5D electronic realization of conductivity detector for capillary electrophoresis,” Elektronika ir Elektrotechnika, Vol. 22, No. 3, pp. 29–32, Jun. 2016, https://doi.org/10.5755/j01.eie.22.3.15311
-
X.-Y. Tang, J. Huang, H. Ji, B. Wang, and Z. Huang, “New method for bubble/slug velocity measurement in small channels,” Review of Scientific Instruments, Vol. 91, No. 5, p. 05500, May 2020, https://doi.org/10.1063/1.5134548
-
Y. He et al., “A Low excitation working frequency capacitively coupled contactless conductivity detection (C4D) sensor for microfluidic devices,” Sensors, Vol. 21, No. 19, p. 6381, Sep. 2021, https://doi.org/10.3390/s21196381
-
P. Paul, C. Sänger‐Van de Griend, E. Adams, and A. van Schepdael, “A simple, low‐cost and robust capillary zone electrophoresis method with capacitively coupled contactless conductivity detection for the routine determination of four selected penicillins in money‐constrained laboratories,” Electrophoresis, Vol. 39, No. 20, pp. 2521–2529, May 2018, https://doi.org/10.1002/elps.201800033
-
C. L. S. Chagas et al., “A fully disposable paper-based electrophoresis microchip with integrated pencil-drawn electrodes for contactless conductivity detection,” Analytical Methods, Vol. 8, No. 37, pp. 6682–6686, Jan. 2016, https://doi.org/10.1039/c6ay01963c
-
X. Huang, D. Xiao, Y. Tong, and Z. Chen, “A sensitive photochemical reaction-capacitively coupled contactless conductivity detection system for HPLC and its application in determination of Cyclosporin A,” Talanta, Vol. 206, p. 120242, Jan. 2020, https://doi.org/10.1016/j.talanta.2019.120242
-
F. Loete, Y. Le Bihan, and D. Mencaraglia, “Novel wideband eddy current device for the conductivity measurement of semiconductors,” IEEE Sensors Journal, Vol. 16, No. 11, pp. 4151–4152, Jun. 2016, https://doi.org/10.1109/jsen.2016.2544403
-
C. Wang, M. Fan, B. Cao, B. Ye, and W. Li, “Novel noncontact eddy current measurement of electrical conductivity,” IEEE Sensors Journal, Vol. 18, No. 22, pp. 9352–9359, Nov. 2018, https://doi.org/10.1109/jsen.2018.2870676
-
A. Pokatilov, M. Parker, T. Kübarsepp, O. Märtens, and A. Kolyshkin, “Grid-based computational algorithm for accurate AC conductivity measurements,” in 16th International Congress of Metrology, p. 11007, Oct. 2013, https://doi.org/10.1051/metrology/201311007
-
H. Wang, W. Li, and Z. Feng, “Noncontact thickness measurement of metal films using eddy-current sensors immune to distance variation,” IEEE Transactions on Instrumentation and Measurement, Vol. 64, No. 9, pp. 2557–2564, Sep. 2015, https://doi.org/10.1109/tim.2015.2406053
-
M. Mirzaei and P. Ripka, “Rotating speed measurement using an optimized eddy current sensor,” Measurement, Vol. 221, p. 113547, Nov. 2023, https://doi.org/10.1016/j.measurement.2023.113547
-
M. Sun, J. Zhou, B. Dong, and S. Zheng, “Driver circuit improvement of eddy current sensor in displacement measurement of high-speed rotor,” IEEE Sensors Journal, Vol. 21, No. 6, pp. 7776–7783, Mar. 2021, https://doi.org/10.1109/jsen.2020.3044592
-
H. Li, J. Wang, T. Zhang, and Z. Li, “The effect of electrical parameters of eddy current sensor on metal film thickness measurement performance and the optimization method,” Review of Scientific Instruments, Vol. 94, No. 10, p. 10500, Oct. 2023, https://doi.org/10.1063/5.0154824
-
Sun B., Ni S., and Zhu Q., “Sensor optimization design of low coupling electromagnetic conductivity measurement system,” (in Chinese), Journal of Electronic Measurement and Instrumentation, Vol. 38, No. 2, pp. 131–138, 2024, https://doi.org/10.13382/j.jemi.b2306814
-
O. Taqavi and S. M. Mirimani, “Design aspects, winding arrangements and applications of printed circuit board motors: a comprehensive review,” IET Electric Power Applications, Vol. 14, No. 9, pp. 1505–1518, Jul. 2020, https://doi.org/10.1049/iet-epa.2020.0141
-
J. P. K. Sampath, A. Alphones, and H. Shimasaki, “Coil design guidelines for high efficiency of wireless power transfer (WPT),” in TENCON 2016 – 2016 IEEE Region 10 Conference, pp. 726–729, Nov. 2016, https://doi.org/10.1109/tencon.2016.7848098
-
“Optimizing l measurement resolution for the ldc161x and ldc1101,” Texas Instruments, 2015.
-
“LDC1001 Inductance-to-Digital Converter.” Texas Instruments, https://www.ti.com/document-viewer/ldc1001/datasheet
About this article

The authors have not disclosed any funding.
The datasets generated during and/or analyzed during the current study are available from the corresponding author on reasonable request.
Shuai Wu: conceptualization, formal analysis, investigation, methodology, visualization. Writing-original draft preparation. Huang Zhe: investigation, methodology. Jianping Zhu: supervision, funding acquisition. Chunfeng Lv: investigation, supervision, and validation.
The authors declare that they have no conflict of interest.
