Abstract
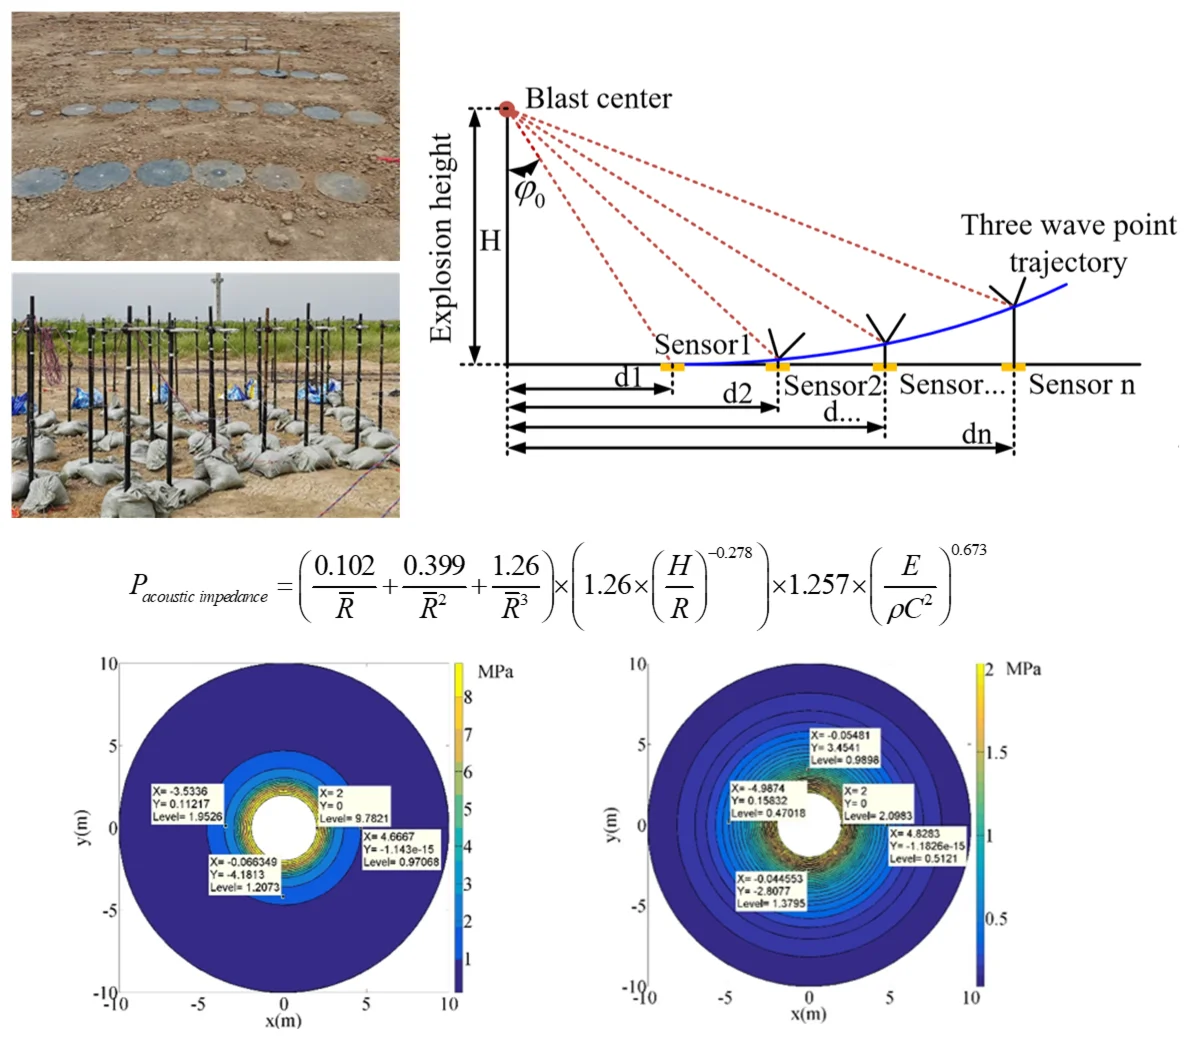
Blast wave is one of the main damage parameters generated by ammunition explosions. Clarifying the distribution pattern of blast wave pressure field in ammunition explosions is of great significance for evaluating the damage power of ammunition and guiding ammunition design. This study is based on the ground-reflection pressure and free-field pressure mapping model, considering the influence of altitude and surface material acoustic impedance on the distribution law of blast wave pressure. A reconstruction model of explosion blast wave pressure field was constructed, and experimental tests were conducted in typical scenarios to verify the accuracy of the pressure field reconstruction model. The results show that the blast wave pressure field reconstruction model proposed in this study can well reflect the pressure distribution law, with a reconstruction accuracy of better than 93.9 %, which compensates for the shortcomings of insufficient pressure distribution data in the pressure field reconstruction process. It provides theoretical and data support for accurate evaluation of ammunition explosion damage power and has significant military application value.
Highlights
- The innovation adopts a surface reflection pressure and free-field pressure mapping model as the research foundation, and builds a brand-new modeling framework for explosion shock wave pressure field.
- The modeling process innovatively incorporates two key influencing factors: altitude and surface material acoustic impedance, enhancing the consideration of dimensions affecting the shock wave pressure distribution mechanism.
- Develop a dedicated explosion shock wave pressure field reconstruction model that takes into account multiple environmental influencing factors, enabling complete digital reconstruction of the pressure field.
- Conduct entity experiments in typical scenarios to quantitatively verify the accuracy of the reconstruction model (with an accuracy exceeding 93.9%), addressing the industry pain point of scarce effective data collection in explosion experiments.
- Establish a high-precision digital reconstruction method for pressure fields, providing a new theoretical calculation and data support system for precise assessment of the destructive power of ammunition explosions.
1. Introduction
In ammunition development, in order to obtain data on explosive damage power, limited testing points are often conducted based on the existing testing environment of the target range. However, the explosion field is generally affected by high temperature, high pressure, strong impact vibration, high-speed flying fragments, flying rocks, etc., which leads to severe damage to sensors during pressure testing and the inability to effectively obtain pressure distribution data. Moreover, there are significant differences in the testing environment of different testing sites, such as altitude and meteorological conditions, resulting in the lack of comparability of the obtained blast wave pressure data, The blast wave pressure data obtained under different test conditions cannot be converted to each other, and the test data is difficult to accurately and comprehensively evaluate the damage power of ammunition. Therefore, how to analyze experimental data and use the obtained limited blast wave pressure data to reconstruct the pressure field within a certain range is a research hotspot in damage assessment [1].
At present, scholars in the field of explosion damage testing have conducted some research on the reconstruction method of explosion blast wave pressure field. According to different reconstruction methods, it can be divided into three types: travel time tomography imaging technology, blast wave pressure attenuation law model, and various interpolation algorithms applied in pressure field reconstruction. The application research of travel time tomography imaging technology in pressure field reconstruction, such as the study by Guo et al. [2], involves the use of networked testing technology to acquire blast wave pressure signals. Based on travel time tomography imaging technology [3, 4], a weighted generalized inverse inversion algorithm is used to invert the propagation velocity of the blast wave. According to the relationship between peak overpressure and velocity, the distribution pattern of pressure is calculated, and the relative deviation between the reconstructed pressure field and the measured results is within 5 %. Bai et al. [5] used travel time tomography imaging technology to reconstruct the wavefront propagation velocity of each grid unit in the test area. Based on the relationship between velocity and peak pressure, the velocity values of each grid are converted into overpressure values, reconstructing the peak pressure of the blast wave on the entire two-dimensional plane. This method achieved the reconstruction of underwater shock wave peak pressure. Wang et al. [6] proposed an OSEM inversion algorithm based on prior information [7]. This algorithm utilizes travel time tomography imaging method and combines pressure transmission characteristics to invert velocity field, achieving reconstruction research on blast wave pressure field.
The application of blast wave pressure attenuation law model in pressure field reconstruction, such as demonstrated by Luo et al. [8], involves the use of the calculation function relationship for overpressure during the explosion of a TNT spherical explosive in an infinite air medium. They employed a nonlinear adaptive fitting method to obtain the formula for the attenuation curve of overpressure from FAE fuel explosive blast waves and inverted the distribution pattern of the blast wave field. Based on the blast wave pressure propagation characteristics, Zhang et al. [9] extracted the blast wave decay curve from the modeling data. They used nonlinear regression theory and multivariate polynomial interpolation algorithms to process the blast wave decay curve, obtaining parameters such as the attenuation coefficient and peak value for each curve. Using "black box" theory, they found the relationship between these parameters and achieved the reconstruction of the blast wave pressure field. Yao et al. [10, 11] applied the Gauss-Newton algorithm to perform nonlinear regression on the measured blast wave pressure curve. They used the Zippel interpolation algorithm to obtain the global optimal solution for the coefficients, in order to invert the attenuation coefficient and peak overpressure of unknown measurement points. The reconstructed blast wave pressure curve showed an average error of less than 17 % compared to the measured results in terms of peak value, positive pressure duration, and specific impulse, which are three characteristic parameters. Xue et al. [12] modified the existing calculation function relationship for free-field pressure based on the explosion similarity law and introduced a scale parameter. The results obtained by the modified model showed a high degree of agreement with the simulation results. Xie et al. [13] analyzed the process of blast wave waveform formation and proposed a method for reconstructing blast wave pressure waveform based on the parseval time-frequency domain energy conservation law and using multiscale wavelet decomposition. This method is more stable, accurate, and closer to the real waveform than reconstruction algorithms based on Fourier transform. Yan et al. [14] proposed a method for reconstructing blast wave overpressure fields based on TV (Total Variation)-minimization and joint dictionary learning. Combining the advantages of compressive sensing in sparse constraints, the TV (Total Variation) regularization method is used to optimize the edge information of the blast wave overpressure field [15]. The dictionary learning method is used to improve the characterization of the internal details of the overpressure field, achieving the reconstruction of the blast wave pressure field with fewer blast wave pressure data. Lv et al. [16] constructed the fitness function in the genetic algorithm based on the relationship between dynamic ground reflection pressure function. They combined the measured pressure data and used the dynamic ground reflection pressure calculation function relationship to reconstruct the dynamic ground reflection overpressure field. The maximum deviation of the pressure was less than 7 %.
The application of various interpolation algorithms in pressure field reconstruction, such as Bai et al. [17], proposed an optimal sensor layout scheme. Efforts should be made to ensure that the ray path matrix of the sensor layout is fully distributed, so that the obtained blast wave pressure data can improve the reconstruction accuracy of the pressure field. Yang et al. [18] used the B-spline interpolation algorithm to refine the simulated and experimental test pressure data and reconstruct the blast wave pressure field. Compared with empirical formulas [19], least squares method [20], and Delaunay triangulation [21], the results showed that the B-spline interpolation algorithm performed the best, with an error in the reconstructed results relative to the measured results of less than 4.5 %. Yao et al. [22] applied the least squares method to construct a polynomial fitting function for the peak attenuation of near-ground blast waves. They used the attenuated polynomial to constrain the radial interpolation of the biharmonic spline surface interpolation algorithm. The reconstructed blast wave pressure distribution exhibited a high degree of agreement with the actual distribution pattern.
According to the current research results, scholars have conducted extensive research on the reconstruction method of blast wave pressure field based on limited measurement point data, and have achieved some results. However, in the reconstruction process, they failed to consider factors that affect the distribution pattern of pressure, leading to reconstruction results that tend to be biased towards ideal conditions and differ from the actual pressure distribution pattern. Therefore, it is urgent to systematically consider the influence of various factors on the propagation law of s blast wave pressure on the basis of existing research, and construct a predictive model suitable for the pressure field of high-energy ammunition explosion blast waves.
Due to the influence of various factors on the layout and measurement results of free-field pressure measurement points, the credibility of pressure measurement results is low. In actual testing, ground-reflection pressure testing is usually carried out, which leads to insufficient data on free-field pressure distribution and the inability to reconstruct the distribution pattern of free-field pressure. Considering the existing problems in current research, this study constructed a mapping model between ground-reflection pressure and free-field pressure, introduced the influence of altitude and surface material acoustic impedance on the propagation law of blast waves, constructed a reconstruction model of explosion blast wave pressure field, and conducted experimental tests under typical explosion conditions to verify the calculation accuracy of the reconstruction model.
2. Blast wave
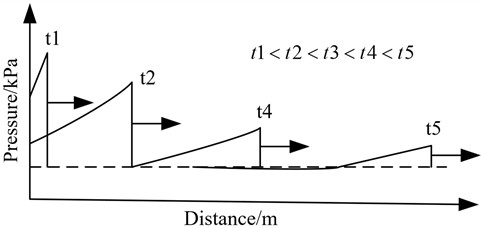
During the initial explosion of ammunition, high-temperature and high-pressure explosion products are generated. These products rapidly expand outward from the detonation center at extremely high velocities. During the expansion process, the highly compressed air medium comes into contact with it, resulting in strong compression. This compression creates localized high-pressure regions, which are known as the initial blast waves [23, 24]. The initial blast wave is a strong discontinuous front, with a movement speed much greater than that of the interface between the explosion products and air. This causes a separation between the blast wave and the explosion products. During the propagation of the explosive blast wave, the leading edge of the wave propagates at supersonic speeds, while the trailing edge of the positive pressure region propagates at the speed of sound corresponding to the pressure . As a result, the positive pressure region widens continuously during the propagation of the blast wave. The typical process of pressure propagation in an explosive blast wave is illustrated in Fig. 1 [25-27].
Fig. 1Typical blast wave pressure propagation process
As the blast wave propagates in the air, parameters such as pressure and propagation velocity rapidly decrease [28]. This is because the wave front of the blast wave continuously expands with increasing propagation distance. Even in the absence of other energy losses, the energy per unit area on the wave front rapidly decreases. Additionally, as the positive pressure region of the explosive blast wave propagates further, it widens continuously, causing an increase in the compressed amount of air and a decrease in the average energy per unit mass of air. Lastly, the propagation process of the blast wave is non-adiabatic, and entropy increases on the wave front. This increasing entropy leads to irreversible energy losses due to adiabatic compression of the air [29]. During the propagation of explosion blast waves, the pressure on the wave front decays rapidly in the initial stage and slowly in the later stage. After the blast wave propagates to a certain distance, it decays into sound waves. The typical blast wave front pressure variation curve with time is shown in Fig. 2 [30].
Fig. 2Pressure attenuation during typical blast wave pressure propagation process
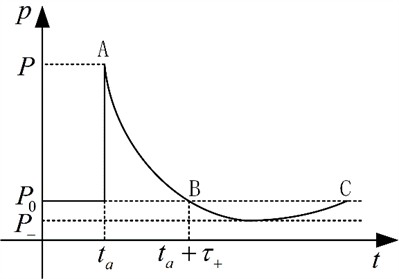
From the aforementioned pressure attenuation curve during the propagation of blast waves in air, it can be observed that the pressure attenuation curve effectively reflects parameters such as the rise time of the blast wave pressure, the peak positive/negative pressures, the positive/negative pressure durations, impulse, blast wave energy, and the decay coefficient of the pressure curve. These parameters can effectively characterize the propagation and distribution of blast wave pressure, which is of great significance for reconstructing the distribution pattern of blast wave pressure field.
Currently, the main methods for testing the pressure of ammunition blast waves are ground-reflection pressure and free-field pressure measurements. Ground-reflection pressure refers to the pressure generated after the incident blast wave collides with the ground and is measured by installing pressure sensors on a flat plate parallel to the ground. Free-field pressure refers to the pressure measured as the incident blast wave passes over the sensor surface without external interference, also known as static pressure. When measuring free-field pressure, a support bracket is used to install the sensor at a certain height above the three-wave points to accurately capture the temporal variation of the incident blast wave pressure.
3. Numerical simulation analysis
3.1. Establishment of numerical simulation models
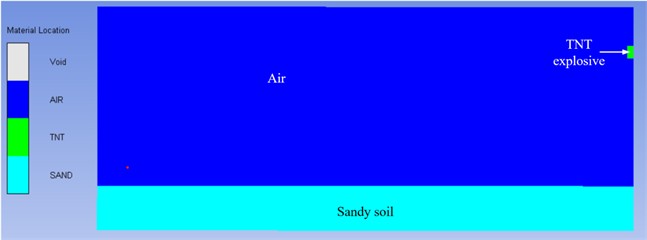
To analyze the propagation characteristics of ground-reflection pressure and free-field pressure in ammunition airburst, the explosion dynamics simulation software AUTODYN is used for simulation analysis. The numerical simulation model mainly consists of three parts: air, surface, and TNT explosive. The model comprises an air model, a surface medium model, and a TNT explosive model. The air model has structural dimensions of 20 m (length) × 8 m (width), with a grid size of 10 mm×10 mm [31], and Euler-type grid division. To simulate an infinite air domain in the actual testing environment, the boundary conditions for the three sides except for the symmetry axis are set as pressure outlets, meaning no pressure reflection occurs at the boundaries. The surface medium model uses sand as the material, with structural dimensions of 10 m (length) × 1.5 m (width). The grid size is 10 mm×10 mm, and the grid type is Lagrange. The TNT explosive is placed in the air using a filling method. The evolution process of explosive products during detonation is calculated using the JWL state equation. Considering the actual field layout of the ammunition in the test, the TNT explosive has a detonation height of 1.5 m and is centrally initiated. For the ground-reflection pressure measurement, pressure measurement points are set at distances of 0 m to 18 m from the detonation point, with a spacing of 0.5 m between each point. For the free-field pressure measurement, the distances from the detonation point are the same as those for the ground-reflection pressure measurement, and the height of the measurement points is consistent with the detonation height of the TNT explosive. To save computational time and resources, a 2D axisymmetric model is established. The finite element numerical simulation model is shown in Fig. 3.
Fig. 3Finite element numerical simulation model
The air is described using the ideal gas state equation [32-34]. The energy density of the air is 2.068×10⁵ J/kg, and the relationship between the air pressure and energy density is given by Eq. (1):
where, is the air density after compression or expansion; is the initial density of air, and the air density 1.225 kg/m3 under standard atmospheric pressure; is the adiabatic index, usually taken as 1.4.
The TNT explosion products are described using the JWL equation of state, as shown in Eq. (2) [35, 36]:
where, represents pressure, represents volume, represents internal energy, and represent material parameters, , , and as a constant, the parameters are listed in Table 1.
Table 1JWL state equation parameters
Material parameters | / kPa | / kPa | |||
TNT | 3.74×10⁸ | 3.75×10⁶ | 4.15 | 0.9 | 0.35 |
To obtain ground-reflection pressure and free-field blast wave pressure data at different altitudes and surface materials, it is necessary to consider the influence of altitude and surface material on the distribution pattern of blast wave pressure propagation in finite element numerical simulation.
The influence of altitude on blast wave pressure is mainly through the variation of atmospheric pressure, air density, and initial energy density of the air. The atmospheric pressure in the testing environment is related to altitude according to Eq. (3):
where, H represents the altitude in m, represents the atmospheric pressure in kPa, and represents the standard atmospheric pressure at sea level (altitude 0 m), 101.352kPa.
The air density of the testing environment and the altitude meet Eq. (4):
where, is the initial air energy density at an altitude of 0 m, 2.068×10⁵ J/kg; is the volume of air per unit, usually .
Considering the potential combat environment for high-energy ammunition, blast wave pressure simulations are conducted at altitudes ranging from 0 m to 5000 m. Specifically, at altitudes of 0 m, 1000 m, 1500 m, 2000 m, 2500 m, 3000 m, 3500 m, 4000 m, 4500 m, and 5000 m, covering the entire range from plains to plateaus. The air density and initial energy density at different altitudes are listed in Table 2.
The common types of surface materials in the shooting range are concrete, sandstone, and ternary soil. Therefore, in finite element numerical simulation, the surface material types are set to the above three materials for simulation analysis.
Table 2Atmospheric parameters at different altitudes
Altitude / m | Air density / kg×m-3 | Initial energy density / J/kg |
0 | 1.225 | 206786 |
500 | 1.1547 | 204470 |
1000 | 1.0871 | 202126 |
1500 | 1.0227 | 199810 |
2000 | 0.9615 | 197468 |
2500 | 0.9032 | 195150 |
3000 | 0.8478 | 192806 |
3500 | 0.7953 | 190490 |
4000 | 0.7454 | 188147 |
4500 | 0.6980 | 185830 |
5000 | 0.6531 | 183488 |
3.2. Analysis of simulation results
3.2.1. Impact of altitude on blast wave pressure
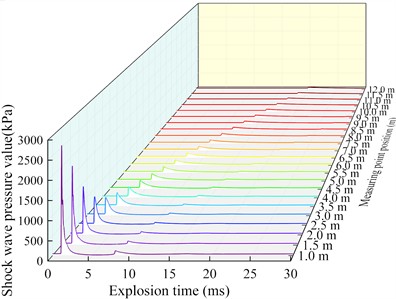
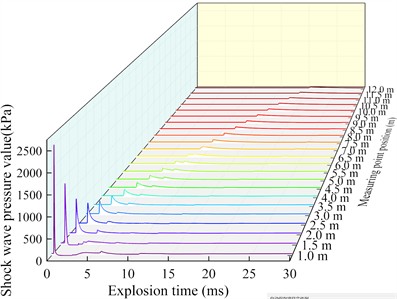
Due to the large number of simulation conditions conducted, it is not possible to present all the obtained blast wave pressure curves and data. Taking the simulation results of TNT charge with a mass of 10 kg, a length to diameter ratio of 1:1, center detonation, and a detonation center height of 2.0 m, with a surface material of composite soil and elevations of 0 m, 3000 m, and 5000 m as examples, the analysis will be conducted. The ground-reflection pressure and free-field pressure curves at a distance of 1 m-12 m from the explosion center are shown in Fig. 4-Fig. 6.
As can be seen from the above figures, at the same distance from the explosive center, as the altitude increases, both the peak values of ground reflection pressure and free-field pressure decrease. The closer to the explosive center, the faster the decay rate of the pressure peak. The trends of the peak values of ground reflection pressure and free-field pressure with altitude are very similar.
Fig. 4Blast wave pressure curve at an altitude of 0 m
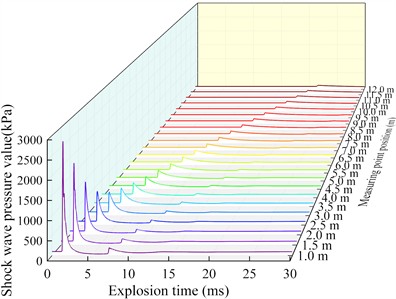
a) Ground-reflection pressure curve
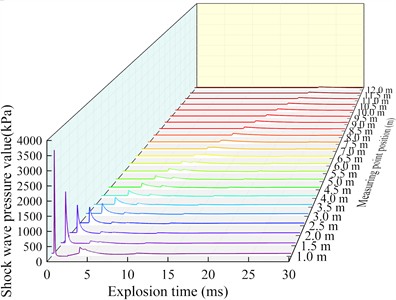
b) Free-field pressure curve
Fig. 5Blast wave pressure curve at an altitude of 3000 m
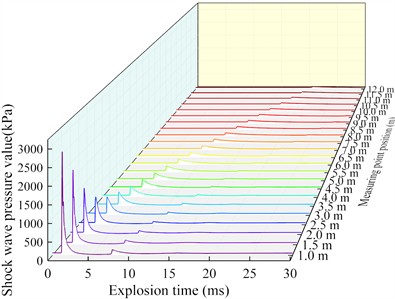
a) Ground-reflection pressure curve
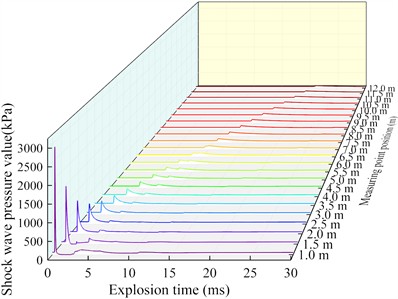
b) Free-field pressure curve
Fig. 6Blast wave pressure curve at an altitude of 5000 m
a) Ground-reflection pressure curve
b) Free-field pressure curve
The decay rate is faster in the near-field region and slower in the far-field region. In the near-field region, the decay rate of the free-field pressure peak is slightly higher than that of the ground reflection pressure. In the far-field region, the decay rates of both are almost the same. The reason behind this is that the magnitude of the free-field pressure peak in the near-field region is influenced by atmospheric parameters and the propagation speed of the blast wave front. Changes in atmospheric parameters can directly lead to changes in pressure propagation patterns. During the propagation of blast wave front, the decrease in air density and energy density leads to a sharp attenuation of energy on the front. As the distance from the explosion center increases, the propagation speed of the blast wave gradually slows down, and the resistance on the wave front also decreases. Therefore, the peak attenuation speed of the blast wave pressure in the far-field region is slower.
3.2.2. Impact of surface materials on blast wave pressure
To investigate the influence of surface material on the propagation characteristics of blast wave pressure, finite element numerical simulation analysis was conducted on test sites with concrete, soil, and sandy soil. A finite element simulation model of acoustic-solid coupling was established using COMSOL, as shown in Fig. 7. The structural dimensions of the air domain in the model are 10 m×3 m to simulate a semi-infinite air domain. The four boundaries of the air domain were set as soft acoustic boundaries to reduce the reflection of sound waves at the model boundaries. The structural dimensions of the surface material are 9.8 m×1 m, with the acoustic-solid coupling boundary being the upper surface of the material, while the other three boundaries do not have coupling. To improve the simulation accuracy, a fine mesh division method controlled by the software was used for all model grids [37].
Fig. 7Schematic diagram of finite element simulation model structure
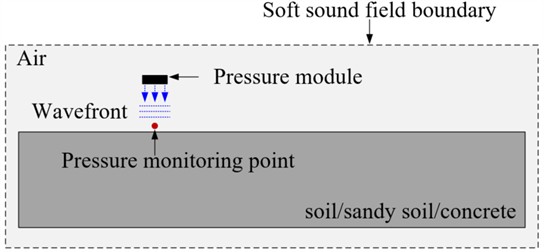
The propagation of blast waves in the air involves the acoustic-pressure transient physical field. The collision and coupling with the ground involve the acoustic-solid coupling physical field. The propagation of stress waves in the surface material involves the solid mechanics physical field. Taking the surface material as ternary soil, TNT explosive with a mass of 60 kg, detonation height of 1.5 m, and center detonation simulation results as an example for analysis. The cloud map of blast wave pressure evolution at different times is shown in Fig. 8. The blast wave pressure peak at distances of 4 m, 8 m, and 12 m are shown in Table 3. The shock wave in the figure starts from the emission point and gradually decays in pressure with the increase of propagation time, corresponding to the increasingly sparse blue wavefront in the figure.
Table 3Peak overpressure of blast wave at different ground propagation media and distance from the explosion center of the measuring point (kPa)
Surface material | Measurement point position | ||||||
4 m | 6 m | 8 m | 10 m | 12 m | 14 m | 16 m | |
Concrete | 2.655 | 1.076 | 0.471 | 0.240 | 0.151 | 0.117 | 0.104 |
Sandy soil | 1.510 | 0.620 | 0.276 | 0.147 | 0.098 | 0.080 | 0.073 |
Soil | 0.789 | 0.355 | 0.174 | 0.099 | 0.067 | 0.054 | 0.049 |
The analysis of the above data reveals that there are significant differences in the peak overpressure of blast waves at the same test environment and blast center distance under different propagation materials. Specifically, it can be observed that , indicating that concrete has the least attenuation effect on blast wave pressure during surface propagation, followed by sand, and soil exhibits the highest attenuation effect.
Fig. 8Cloud map of the blast wave pressure evolution on sandy soil ground

a) 1.2ms

b) 2.4 ms

c) 4.8 ms

d) 7.2 ms
4. Pressure field prediction model
According to the above analysis, the main factors that influence the distribution pattern of blast wave pressure field include altitude and the surface material impedance of the test site. To improve the accuracy of the reconstruction of the blast wave pressure field, it is necessary to consider the influence of the aforementioned factors on the distribution pattern of pressure during the reconstruction process.
4.1. Correction model of altitude on ground-reflection pressure
The change in altitude directly leads to variations in atmospheric pressure, thereby influencing the distribution pattern of blast wave pressure. By introducing the effect of altitude on pressure and using dimensional analysis, the influence factor of altitude can be established as shown in Eq. (5):
where, represents the atmospheric pressure at altitude h, in units of kPa, and represents the atmospheric pressure at an altitude is 0 m and the condition of an environmental temperature is 15 ℃. Based on the Sachs proportionality law [35-37], a calculation model for ground-reflection pressure under the influence of altitude is constructed as shown in Eq. (6):
Using the surface reflection pressure data obtained earlier, a nonlinear adaptive fitting was performed on the calculation model, resulting in 2/3, 1/3, 0.68, –0.22, and a sum of squared fitting errors of 0.974. Therefore, it can be concluded that the surface reflection pressure calculation model established in this study under the influence of altitude can better reflect the impact of altitude on the distribution of shock wave pressure. Therefore, the shock wave pressure correction model established is shown in Eq. (7):
4.2. Correction model of surface material acoustic impedance on ground-reflection pressure
The collision between the blast wave and the ground manifests as a compressive effect of the blast wave pressure on the surface material. The compressibility of the material is correlated with the material density , sound velocity , elastic modulus , and the peak pressure of the blast wave . The greater the density, the smaller the elastic modulus, and the less compressible the material. Conversely, the greater the compressibility of the material, the larger the density, and the smaller the elastic modulus. These two factors are negatively correlated. Considering the energy conversion process between the blast wave propagation and the surface material as the attenuation effect of the blast wave pressure on the surface material, it can be defined as the acoustic impedance coefficient . The acoustic impedance coefficient is related to the inherent properties of the surface material and can be represented by Eq. (8):
Based on the calculation model of ground-reflection pressure, the acoustic impedance coefficient of surface materials is introduced, and a calculation model is established as shown in Eq. (9):
where, represents the peak reflected pressure on the ground, in kPa; represents the equivalent mass of TNT explosive, in kg; represents the distance from the blast center, in m; represents the scaled distance, in m×kg-1/3.
To establish a calculation model with clear physical significance, the impedance coefficient of the surface material must be a dimensionless quantity, and three physical dimensions, mass , length , and time , are selected as the basic dimensions. The dimensional expression of must satisfy Eq. (10):
Dimensional power analysis was conducted on the influencing factors of the acoustic impedance coefficient of surface materials using dimensional analysis. The dimensional indices of each physical quantity are shown in Table 4.
Perform row transformations on the dimensional powers of the aforementioned physical quantities, and the transformed dimensional powers are shown in Table 5.
Table 4Power of each physical quantity dimension
Fundamental dimension | |||
1 | 0 | 1 | |
–3 | 1 | –1 | |
0 | –1 | –2 |
Table 5Power of each physical quantity dimension (row transformation)
Fundamental dimension | |||
1 | 0 | 1 | |
0 | 1 | –2 | |
0 | 0 | –4 |
According to theorem , a dimensionless physical quantity can be obtained as shown in Eq. (11):
By substituting Eq. (11) into Eq. (9), the blast wave pressure calculation model under the correction of surface material impedance coefficient can be obtained as shown in Eq. (12):
where, , , , is the undetermined coefficient; is the acoustic impedance of the surface material.
Using the data obtained from ground-reflection pressure tests conducted on several typical surface materials mentioned above, non-linear adaptive fitting was performed on the function relationship of Eq. (12), with 1.260, –0.278, 1.257, and 0.673. Therefore, the calculation model of ground-reflection pressure under the influence of surface material acoustic impedance is shown in Eq. (13):
4.3. Ground-reflection pressure and free-field pressure mapping model
The technical specifications of many ammunition are given in terms of free-field pressure indicators. However, accurate measurement of free-field pressure faces several challenges. The installation height of free-field pressure sensors should be above the triple wave point height, which is influenced by factors such as propellant mass, length-to-diameter ratio, detonation height, and detonation position. There is currently no standardized method for calculating the height. Fragments (both natural and preformed) can damage free-field pressure sensors, leading to a low data acquisition rate. In comparison, surface-reflected pressure measurement has the advantages of low cost, mature technology, and ease of operation. In engineering development, surface-reflected pressure testing is typically conducted to achieve higher reliability of measurement results. Analysis of the propagation law between surface-reflected pressure and free-field pressure reveals the existence of a certain mapping relationship between the two. To improve the acquisition rate of free-field pressure data, it is necessary to study the mapping model between ground-reflection pressure and free-field pressure, and invert free-field pressure through ground-reflection pressure to provide data support for blast wave pressure field reconstruction.
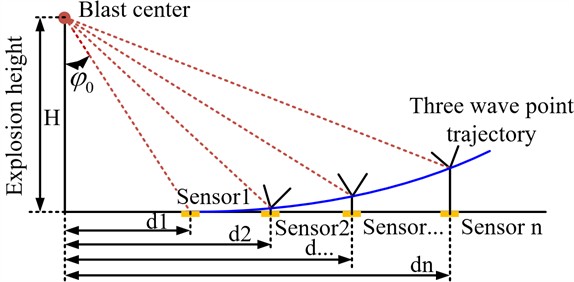
Analyzing the factors that affect the propagation of blast wave pressure in the free-field, such as TNT mass, distance to the detonation point, and detonation height. Changes in these parameters can lead to differences in the distribution of blast wave pressure. Using free-field pressure () as the dependent variable and four parameters, incident angle of the blast wave (), distance from the measurement point to the detonation point (), ground-reflected pressure (), and TNT mass () as independent variables, a mapping model between surface-reflected pressure and free-field pressure is constructed. The incident angle of the blast wave is defined as shown in Fig. 9, and the computational relationship is given by Eq. (14):
where, is the distance from the explosion center, in meters; is the detonation height, in m.
Considering the correlation between surface reflection pressure, TNT charge quality, and measurement point detonation distance, the mapping model can be simplified as the relationship between free field pressure, surface reflection pressure, and shock wave incidence angle. Based on the dimensional analysis method, the three physical quantities introduced are free field pressure , surface reflection pressure , and shock wave incidence angle . The unit of free field pressure is MPa, the unit of surface reflection pressure is MPa, and the shock wave incidence angle is a dimensionless quantity. Therefore, the established mapping model is given by Eq. (15):
Fig. 9Schematic diagram of blast wave pressure incidence angle structure
Use the ground reflection pressure and free-field pressure data obtained from the aforementioned experiments to perform nonlinear adaptive fitting on the above mapping model. The undetermined coefficients 0.266 and 1.176 in the functional relationship. Therefore, the mapping model between ground-reflection pressure and free-field pressure can be expressed as Eq. (16):
Based on the above analysis, when reconstructing the pressure field of blast wave, the mapping model based on surface-reflected pressure and free-field pressure is considered. The influence of altitude and surface material impedance on the propagation characteristics of blast wave pressure is taken into account. The distribution patterns of ground-reflected pressure and free-field pressure are calculated under different explosion conditions. Using pressure distribution contour lines as a basis, the pressure field of blast wave within a certain range is reconstructed.
5. Accuracy verification of pressure field reconstruction
To validate the accuracy of the established blast wave pressure field prediction model, experimental studies are conducted in test fields with different altitudes, environmental temperatures, and surface materials.
Using the traditional static explosion test method, the TNT charge column is suspended in the manner shown in Fig. 10, at detonation height of 1.5 m, with a central detonation point. The TNT mass is 35 kg. The test site has a surface material of clay, an altitude of 700 m, and an ambient temperature of 30 ℃.
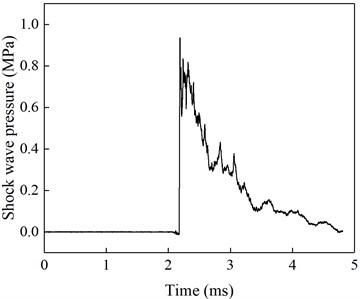
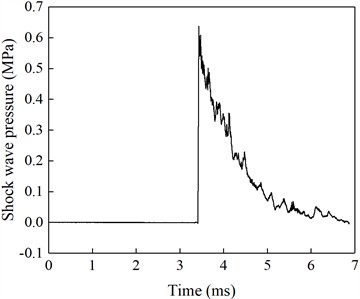
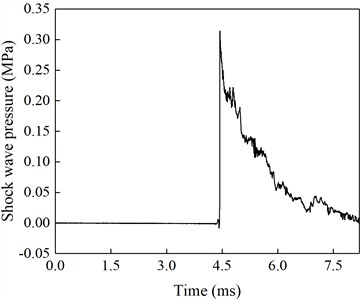
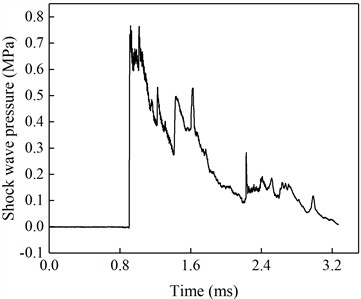
With the detonation point as the center, measurement points are set at distances of 3 m to 9 m from the detonation point. The layout of surface reflection pressure measurement points and free field pressure measurement points is shown in Fig. 11. Through the aforementioned numerical simulation and the height analysis model of the trip wave point trajectory, it can be calculated that the height of the three wave points at a distance of 9 m from the explosion center is less than 1.5 m. To ensure that the free field pressure sensor accurately collects the pressure of the incident shock wave front, the installation height of the free field pressure sensor is set at 1.5 m. Some of the shock wave pressure curves obtained in the experiment are shown in Fig. 12 and Fig. 13.
Fig. 10TNT explosive installation status. Photo by Liangquan Wangduring during the research process
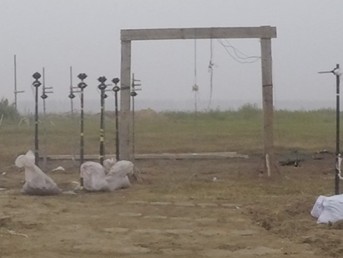
Fig. 11Sensor on-site installation status. Photo by Liangquan Wangduring during the research process
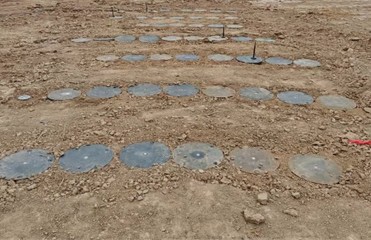
a) Installation status of ground-reflection pressure sensor
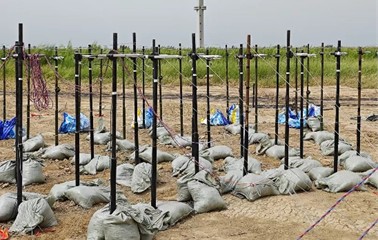
b) Installation status of free-field pressure sensor
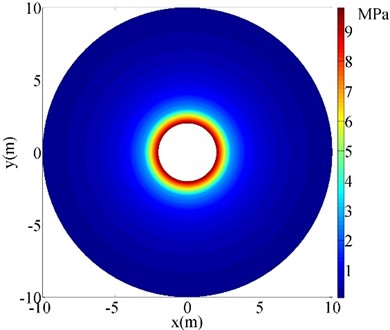
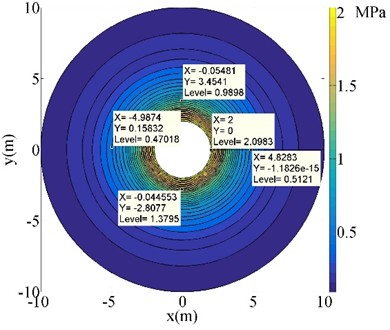
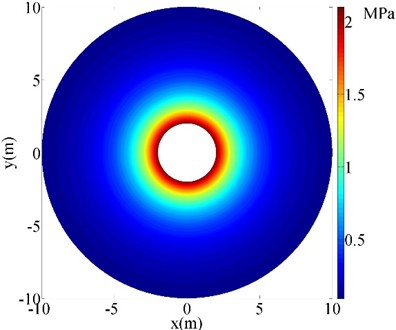
Extract the peak values of ground-reflection pressure and free-field pressure at different distances from the explosion center, and follow the reconstruction process mentioned above to obtain the distribution of ground-reflection pressure and free-field pressure under the same explosion conditions as the experimental test. The reconstruction results of pressure field distribution are shown in Fig. 14 and Fig. 15, the relative error between the reconstructed results and the measured results is listed in Table 6.
Fig. 12Ground-reflection pressure curve
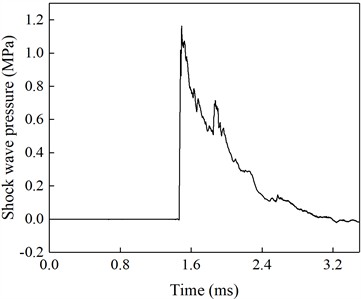
a) Measurement point explosion center distance of 4 m
b) Measurement point explosion center distance of 5 m
c) Measurement point explosion center distance of 6 m
d) Measurement point explosion center distance of 7 m
Fig. 13Free-field pressure curve
a) Measurement point explosion center distance of 4 m
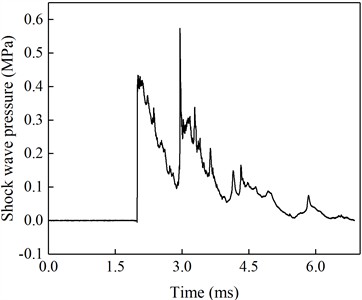
b) Measurement point explosion center distance of 5 m
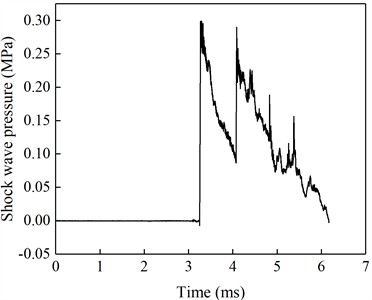
c) Measurement point explosion center distance of 6 m
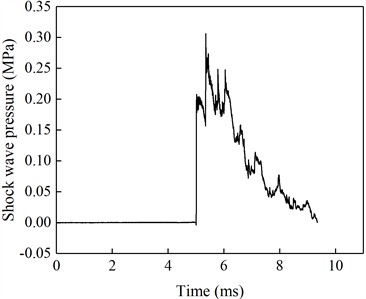
d) Measurement point explosion center distance of 7 m
According to Table 6, the maximum relative error in the reconstructed ground reflected pressure occurs at the measurement point with a distance of 8m from the detonation point, which is 11.10 %. The maximum relative error in the peak free-field pressure occurs at the measurement point with a distance of 8 m, which is 9.591 %. The predicted results at the other measurement points have relative errors less than 10 %. To reduce the impact of sampling errors, the Grubbs criterion is used to remove gross errors from all calculation results. After removing gross errors, the average relative error (MAS) of the remaining data is calculated as the calculation accuracy of the model, which is better than 94.24 %.
Fig. 14Distribution law of ground-reflection pressure
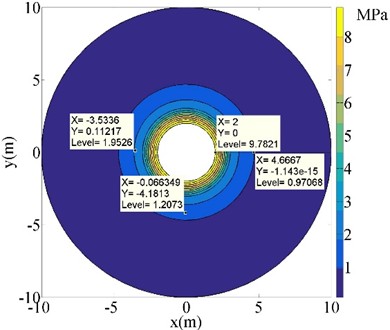
a) Contour map of pressure field distribution
b) Pseudo color map of pressure field distribution
Fig. 15Distribution law of free-field pressure
c) Contour map of pressure field distribution
d) Pseudo color map of pressure field distribution
Table 6Measurement of peak blast wave pressure and prediction model calculation results
Measurement point explosion center distance / m | Ground-reflection pressure | Free-field pressure | ||||
Peak measured pressure / MPa | Reconstruction pressure peak / MPa | Relative error | Peak measured pressure / MPa | Reconstruction pressure peak / MPa | Relative error | |
3.0 | 2.739 | 2.714 | 0.905 % | 1.201 | 1.239 | 3.187 % |
4.0 | 1.163 | 1.259 | 8.289 % | 0.767 | 0.720 | 6.094 % |
5.0 | 0.935 | 0.862 | 7.829 % | 0.434 | 0.427 | 1.717 % |
6.0 | 0.637 | 0.598 | 6.154 % | 0.299 | 0.278 | 7.13 % |
7.0 | 0.314 | 0.302 | 3.822 % | 0.208 | 0.201 | 3.202 % |
8.0 | 0.228 | 0.263 | 11.10 % | 0.171 | 0.155 | 9.591 % |
9.0 | 0.194 | 0.205 | 5.876 % | – | 0.147 | – |
Note: “–“ is invalid data. During the experiment, the TNT explosion caused damage to the free field pressure sensor at a distance of 9 meters, resulting in the failure to collect valid experimental data | ||||||
In subsequent research, the measured blast wave pressure data can be used to continuously refine the coefficients of the predictive model, thus improving the accuracy of the model’s calculations. Overall, using the predictive model to calculate the peak pressure of explosive blast wave show a high level of agreement with experimental results. Therefore, the constructed predictive model for explosive blast wave pressure fields can be applied to the calculation of high-energy ammunition blast wave pressure fields, providing data support for assessing the destructive power of ammunition explosions and guiding ammunition design.
6. Conclusions
This study focuses on the problems of low effective data acquisition rate, poor comparability of collected data, inability to convert pressure data obtained under different explosion conditions, insufficient consideration of influencing factors, and poor reconstruction accuracy in the pressure field reconstruction process during ammunition blast wave pressure testing. Therefore, research on pressure field reconstruction methods has been carried out. The main research results are listed below.
1) Considering the influence of meteorological conditions and surface material on the propagation of blast wave pressures, a dimensional analysis method is used to construct a model for calculating the ground-reflection pressure, taking into account the impact of altitude and surface material impedance. This model improves the accuracy of ground-reflection pressure calculation under different explosion conditions.
2) Based on the propagation law of blast wave pressures and considering the influence of the angle of incidence on free-field pressures, a dimensional analysis method is used to construct a mapping model between ground-reflection pressures and free-field pressures. This model provides an effective calculation method and reliable data support for the study of free-field pressure distribution patterns.
3) Taking into account the influence of meteorological conditions and surface material impedance on the distribution patterns of blast wave pressures, and based on the mapping model between ground-reflection pressures and free-field pressures, a predictive model for blast wave pressure fields is constructed. Experimental tests are conducted under typical scenarios, and the comparison between the test results and the model reconstruction results shows that the model accuracy is better than 93.9 %.
This study provides a new method for the reconstruction of ammunition blast wave pressure fields. The reconstructed pressure field results are more consistent with the actual distribution patterns of blast wave pressures. The results of the reconstruction provide reliable data support for assessing the destructive power of ammunition explosions and guiding ammunition design, and have significant military application value.
References
-
B.-L. Gan, D.-M. Zhang, Z.-K. Huang, F.-Y. Zheng, R. Zhu, and W. Zhang, “Ontology-driven knowledge graph for decision-making in resilience enhancement of underground structures: Framework and application,” Tunnelling and Underground Space Technology, Vol. 163, p. 106739, Sep. 2025, https://doi.org/10.1016/j.tust.2025.106739
-
Y. L. Guo, Y. Han, and L. M. Wang, “Reconstruction method of shock wave overpressure field based on generalized inverse algorithm,” (in Chinese), Explosion and Impact, Vol. 34, No. 6, pp. 764–768, 2014, https://doi.org/10.11883/1001-1455(2014)06-0764-05
-
R. Fukunaga, M. Ezoe, S. Nakao, and Y. Miyazato, “Application of rainbow schlieren tomography for shock-containing rectangular jets,” Journal of Visualization, Vol. 25, No. 4, pp. 687–695, Feb. 2022, https://doi.org/10.1007/s12650-022-00827-w
-
M. E. Rutherford, J. G. Derrick, D. J. Chapman, G. S. Collins, and D. E. Eakins, “Insights into local shockwave behavior and thermodynamics in granular materials from tomography-initialized mesoscale simulations,” Journal of Applied Physics, Vol. 125, No. 1, pp. 1–12, Jan. 2019, https://doi.org/10.1063/1.5048591
-
M. M. Bai, Y. L. Guo, and L. M. Wang, “Reconstruction Algorithm and Comparison of Overpressure Field in Underwater Explosion Shockwave,” Journal of Missile and Guidance, Vol. 34, No. 6, pp. 71–74, 2014, https://doi.org/10.3969/j.issn.1673-9728.2014.06.019
-
F. Wang and Y. Q. Bai, “Reconstruction technology of shock wave overpressure field based on OSEM algorithm,” (in Chinese), Shanxi Electronic Technology, pp. 15–18, 2016, https://doi.org/10.3969/j.issn.1674-4578.2016.01.007
-
L. Xu, M. Zhao, and R. P. Guo, “Research on OSEM image reconstruction algorithm based on time stream,” (in Chinese), Journal of Instrumentation, Vol. 43, No. 6, pp. 194–204, 2022, https://doi.org/10.19650/j.cnki.cjsi.j2209588
-
A. M. Luo, Q. Zhang, C. H. Bai, J. P. Li, and Y. Q. Wang, “Inversion study on shock wave overpressure of fuel air explosives,” (in Chinese), Journal of Missile and Guidance, pp. 34–36, 2005, https://doi.org/10.3969/j.issn.1673-9728.2005.01.011
-
X. G. Zhang, W. B. You, and H. Liu, “Application of BP network in dynamic characteristic correction of shock wave testing systems,” (in Chinese), Journal of Missile and Guidance, Vol. 38, No. 1, pp. 93–96, 2018, https://doi.org/10.15892/j.cnki.djzdxb.2018.01.022
-
Y. Yao, Y. H. Ding, D. X. Pei, and X. G. Zhang, “Reconstruction method for shock wave curves of explosions in the air,” (in Chinese), Journal of Metrology, Vol. 40, No. 4, pp. 636–641, 2019, https://doi.org/10.3969/j.issn.1000-1158.2019.04.15
-
Y. Yao, “Research on reconstruction technology of near earth static blast shock wave field,” North Central University, 2019.
-
Z.-Q. Xue, S. Li, C.-L. Xin, L.-P. Shi, and H.-B. Wu, “Modeling of the whole process of shock wave overpressure of free-field air explosion,” Defence Technology, Vol. 15, No. 5, pp. 815–820, Oct. 2019, https://doi.org/10.1016/j.dt.2019.04.014
-
Y. C. Xie, H. B. Zhou, Y. Tao, and C. X. Wang, “Research on waveform reconstruction method of underwater electric explosion shock wave based on wavelet decomposition,” (in Chinese), Vibration and Shock, Vol. 40, No. 5, pp. 149–153, 2021, https://doi.org/10.13465/j.cnki.jvs.2021.05.020
-
X. L. Yan, J. Li, H. H. Kong, L. M. Wang, and Y. L. Guo, “Reconstruction method of shock wave overpressure field based on compressive sensing,” (in Chinese), Electronic Measurement Technology, Vol. 45, No. 2, pp. 84–90, 2022, https://doi.org/10.19651/j.cnki.emt.2108067
-
W. J. Xing, S. Y. Cao, and S. Y. Chen, “Post stack longitudinal wave impedance inversion based on spectral inversion method,” Geophysical and Chemical Exploration, Vol. 47, No. 2, pp. 429–437, 2023.
-
Z. J. Lv, H. Y. Li, C. Y. Gao, X. L. Zhu, and F. L. Huang, “Reconstruction method of dynamic explosion overpressure field based on ground reflected shock wave and genetic algorithm,” (in Chinese), Journal of Safety and Environment, Vol. 22, No. 4, pp. 1872–1878, 2022, https://doi.org/10.13637/j.issn.1009-6094.2021.0422
-
M. M. Bai, Y. L. Guo, F. Wang, and L. M. Wang, “Reconstruction of underwater explosion shock wave overpressure field based on variable grid method,” Tactical Missile Technology, No. 4, pp. 105–110, 2014.
-
Z. Yang, Z. J. Zhang, and Y. L. Xia, “Reconstruction of shock wave overpressure field based on B-spline interpolation fitting,” Science, Technology and Engineering, Vol. 16, No. 7, pp. 236–240, 2016, https://doi.org/10.3969/j.issn.1671-1815.2016.07.040
-
L. Q. Wang and D. R. Kong, “Study on Pressure Reconstruction Method of Explosion Shock Wave,” Journal of Applied Fluid Mechanics, Vol. 16, No. 7, pp. 1442–1454, Jul. 2023, https://doi.org/10.47176/jafm.16.07.1690
-
W. J. Tao and S. Huan, “Research on Lagrange method based on least squares method in attenuated shock waves,” Journal of High Pressure Physics, Vol. 2, pp. 215–220, 2014, https://doi.org/10.11858/gywlxb.2014.02.013
-
H. B. Zhao and Z. J. Zhang, “A shock wave pressure field reconstruction method based on non-uniform rational B-spline "spider web" interpolation,” Science, Technology and Engineering, Vol. 17, No. 18, pp. 258–264, 2017.
-
Y. Wen-Bin, D. Yong-Hong, and Y. Yue, “Static Explosion Field Reconstruction Based on the Improved Biharmonic Spline Interpolation,” IEEE Sensors Journal, Vol. 20, No. 13, pp. 7235–7240, Jul. 2020, https://doi.org/10.1109/jsen.2020.2978502
-
L. Q. Wang, F. Shang, and D. R. Kong, “Numerical simulation analysis of static and dynamic blast shock waves,” Journal of Ordnance Equipment Engineering, Vol. 41, No. 12, pp. 208–213, 2020, https://doi.org/10.11809/bqzbgcxb2020.12.039
-
L. Q. Wang and D. R. Kong, “A review of research on the influence of terrain environment on shock wave propagation laws,” Foreign Electronic Measurement Technology, Vol. 41, No. 5, pp. 68–75, 2022, https://doi.org/10.19652/j.cnki.femt.2203709
-
J. Zu, T. H. Ma, and D. X. Pei, New Concept Dynamic Testing. Beijing: National Defense Industry Press, 2016.
-
Y. Deng, X. G. Tao, and J. Zhao, “Research on fast algorithm for explosion shock wave propagation in complex tunnels,” Journal of Underground Space and Engineering, Vol. 18, No. 4, pp. 1127–1137, 2022.
-
R. H. Ma, B. Jia, and L. Yang, “The influence of tunnel cross-section shape on the propagation law of explosion shock waves,” Journal of Weapon Equipment Engineering, Vol. 43, No. 2, pp. 92–96, 2022, https://doi.org/10.11809/bqzbgcxb2022.02.014
-
X. F. Chen, X. C. Huang, and Q. B. Dou, “Calculation method of explosion shock load in engineering analysis,” Strength and Environment, Vol. 47, No. 1, pp. 26–32, 2020, https://doi.org/10.19447/j.cnki.11-1773/v.2020.01.004
-
T. Mizukaki, A. Kato, and M. Mori, “Fundamental study on blast simulator for blast injury research,” Science and Technology of Energetic Materials, Vol. 81, No. 1, pp. 17–23, 2020.
-
Y. F. Jia, C. Q. Zhang, and J. Kang, “Explosion shock wave signal test and wavelet analysis,” Journal of Projectiles, Rockets and Guidance, Vol. 34, No. 5, pp. 86–89, 2014.
-
L. Wang, D. Kong, and F. Shang, “Mapping relationship between surface-reflection pressure and free-field pressure of explosion field shock waves,” Pramana, Vol. 97, No. 3, pp. 89–95, Jun. 2023, https://doi.org/10.1007/s12043-023-02555-8
-
H. M. Du, X. Y. Cao, Z. W. He, and L. Xu, “Analysis and verification of air and ground shock wave characteristics of near-ground explosion,” Journal of Projectiles, Rockets, Rockets and Guidance, Vol. 34, No. 4, pp. 65–68, 2014, https://doi.org/10.3969/j.issn.1673-9728.2014.04.018
-
X. Kong, L. Wang, T. Yu, Z. He, H.E. Luo, and B. Li, “Free-field shock-wave test method for meteorological air cannons,” Measurement, Vol. 189, p. 110456, Feb. 2022, https://doi.org/10.1016/j.measurement.2021.110456
-
B. Chang, H. P. Gu, and C. W. Niu, “Study on characteristics of shock wave field of near ground explosion of moving explosives,” Blasting, Vol. 35, No. 3, pp. 49–54, 2018, https://doi.org/10.3963/j.issn.1001-487x.2018.03.008
-
L. Wang and D. Kong, “Influence of Ground Impedance on Explosive Shock Wave Test Accuracy,” International Journal of Impact Engineering, Vol. 171, p. 104395, Jan. 2023, https://doi.org/10.1016/j.ijimpeng.2022.104395
-
Y. A. Çengel and M. Kanoğlum, “A new entropy function to analyze is entropic processes of ideal gases with variable specific heats,” Entropy, Vol. 24, No. 6, p. 746, 2022.
-
L. Wang, D. Kong, and F. Shang, “Influence of homogeneous discontinuous medium on the propagation law of explosion shock wave pressure,” Indian Journal of Physics, Vol. 98, No. 3, pp. 985–995, Aug. 2023, https://doi.org/10.1007/s12648-023-02859-w
About this article

The authors have not disclosed any funding.
The datasets generated during and/or analyzed during the current study are available from the corresponding author on reasonable request.
Liangquan Wang: conceptualization, data curation, formal analysis, methodology, software, writing-original draft, writing-review and editing, validation. Changli Wang: project administration, writing-review and editing, resources. Bingwen Qian: writing-review and editing, resources. Zhenghao Wu: Writing: review and editing, resources. Xin Zhang: writing-review and editing, resources. Botian Zhang: writing-review and editing; resources.
The authors declare that they have no conflict of interest.

