Abstract
The excavation of complex deep foundation pit poses significant risks to the safety of adjacent existing structures. To investigate the force and deformation characteristics of deep foundation pit, this study focuses on the pile-anchor support system of a deep foundation pit for a third-line ship lock on the Xiangjiang River. Model tests and numerical modeling analyses were conducted to evaluate the influence of pile diameters (1.0 m 2.0 m) on the force and deformation characteristics of pile-anchor support system in deep foundation pit adjacent to buildings. The results indicate the following: (1) The variation pattern of horizontal displacement at the top of pile in the model test is consistent with that observed in the numerical simulation. The bending moment of the pile body exhibits an “S”-shaped distribution, confirming the reliability of numerical model. (2) The horizontal displacement curve of pile body presents a “bulging belly” shape, with smaller displacements at the top and bottom and larger displacements in the middle. The curvature of displacement decreases as the pile diameter increases. (3) Larger pile diameters result in greater bending moments in the pile body, smaller changes in the positions of positive and negative bending moment extremes, and reduced surface settlement. (4) The uplift at the bottom of foundation pit initially decreases and then increases, forming a “hooked” curve. The influence of pile diameter on bottom uplift is relatively minor. (5) Larger pile diameters promote a transition in the active failure mode from semi-infinite soil to finite soil, with 1.5 m serving as the critical value for finite soil conditions. (6) Based on economic considerations, 1.5 m is determined to be the optimal pile diameter. (7) The active deformation sliding surface of finite soil behind piles is a curve or polyline that is higher than the heel of wall and returns to the adjacent buildings. This study provides valuable experimental data for investigating finite soil deformation behind piles in the pile-anchor support system for deep foundation pit, offering both theoretical significance and practical engineering value.
Highlights
- The variation pattern of horizontal displacement at the top of pile in the model test is consistent with that observed in the numerical simulation. The bending moment of the pile body exhibits an "S"-shaped distribution.
- The horizontal displacement curve of pile body presents a "bulging belly" shape, with smaller displacements at the top and bottom and larger displacements in the middle. The curvature of displacement decreases as the pile diameter increases.
- Larger pile diameters result in greater bending moments in the pile body, smaller changes in the positions of positive and negative bending moment extremes, and reduced surface settlement.
- The uplift at the bottom of foundation pit initially decreases and then increases, forming a "hooked" curve. The influence of pile diameter on bottom uplift is relatively minor.
- Larger pile diameters promote a transition in the active failure mode from semi-infinite soil to finite soil, with d = 1.5m serving as the critical value for finite soil conditions.
1. Introduction
With the rapid development of the economy, there has been a marked increase in the number and tonnage of vessels utilized in water conservancy transportation. However, the existing waterways are no longer adequate to meet operational demands. Due to spatial constraints, the newly constructed third-line lock on the Xiangjiang River is adjacent to the existing second-line lock. The surrounding geological conditions are complex and close to existing structures. Consequently, the deep foundation pit excavation for the third-line ship lock must rigorously control foundation pit deformation. The preliminary design proposal incorporates a row pile-anchor cable support system. This pile-anchor support scheme is influenced by various factors, including pile diameter, pile spacing, anchor cables, slope top load, and geological conditions. Investigating the deformation behavior of pile-anchor supports in complex deep foundation pit can contribute to refining design outcomes and optimizing engineering solutions while ensuring safety. Based on the existing literature, the studies on pile-anchor support structures predominantly employ methods such as theoretical analysis, experimental research, and numerical simulation.
In terms of theoretical analysis, Zhang [1] introduced a method to infer the bending moment from the displacement direction of supporting structure. This approach addresses the issues of high cost and susceptibility to damage at measurement points in foundation pit monitoring, thereby effectively reducing the economic burden associated with such monitoring. Liao [2], Wang [3], Ling [4], Han [5], Ling [6], and Yin [7] derived calculation formulas for the stability of pile-anchor support structures and the primary excavation pressure behind piles based on classical earth pressure theory. Liang [8] developed a force and deformation calculation model for pile-anchor structures under layered finite soil conditions through theoretical analysis, solving the force and deformation of supporting piles using the transfer matrix method and Laplace transform. Ding [9] employing the matrix displacement method, considered the synergistic effects among supporting pile, anchor rod, and soil, as well as the deformation influence of stepwise excavation on these components, proposing a novel calculation method for the deformation of pile-anchor support system.
In the context of experimental research, Meng [10] demonstrated through on-site testing and measurements that during excavation, the earth pressure acting on the supporting structure exhibited an overall gradual decrease, while the bending moment gradually increased. These changes showed a significant lag relative to the foundation pit excavation process. Furthermore, it was found that increasing parameters such as row spacing, pile diameter, pile length, and prestress of anchor rods could effectively mitigate the horizontal displacement of the pile body. Yu [11], through the analysis of engineering monitoring data, concluded that in the nailing-pile-anchor support system, the variation in horizontal displacement of the pile body was proportional to the excavation depth but constrained by the installation of lower anchor rods. Gao [12] conducted centrifugal tests combined with numerical simulations to compare the differences between compressive stress anchor rods and tensile stress anchor rods. This study also investigated the earth pressure on the shotcrete surface layer and developed fabrication and installation methods for compressive stress prestressed anchor rod models in small-scale centrifugal models. Zhang [13] explored the effects of factors such as the pile length-to-diameter ratio, excavation depth, internal friction angle of soil, and friction between soil and supporting structures on the distribution and variation patterns of earth pressure using theoretical analysis and indoor model experiments. Xie [14] conducted micropile model tests, and the results showed that micro-group piles have strong deformation under extremely poor geological conditions of the slope. Xue [15] conducted foundation pit model tests, and the results showed that the interaction of pile anchor-soil was divided into three different states, and the inclination angle of anchor rod had a significant effect on the deformation of foundation pit, and the optimal angle between the anchor cable and the pile is 60°.
In the field of numerical simulation, Zhao [16] employed the PLAXIS software to establish two-dimensional and three-dimensional models of the pile slab wall-anchor cable support system. They examined the vertical load transfer mechanisms under various types of anchor rod failures, as well as the bending moment, horizontal displacement changes, and influence ranges of the support structure when a single anchor rod failed. Based on the elastic support point method and deformation coordination principle, Ma [17] formulated a force-deformation model for the pile-anchor structure, implemented it through MATLAB programming, and validated it via PLAXIS3D finite element analysis. The findings indicated that the crown beam enhances the bearing capacity of the pile-anchor structure, mitigates the horizontal displacement at the pile top, and improves slope stability. Yin [18] integrated theoretical analysis with numerical simulation and investigated the variation patterns of earth pressure and settlement during the excavation process of an actual deep foundation pit project supported by piles and anchors. Cui [19] analyzed the deformation data of a pile-anchor support structure in a deep foundation pit in Harbin during winter. The study revealed that freeze-thaw cycles weaken the shallow support effectiveness of the pile-anchor structure. Furthermore, within the region extending from 1 meter below the top of the foundation pit to the half of foundation pit depth, the horizontal displacement of the outer corner of foundation pit increases due to the effects of freeze-thaw cycles. Using numerical simulations, Liu [20] conducted a comprehensive investigation into the spatial effects and influencing factors of soil nail wall-pile anchor support structures in red sandstone strata. The findings indicate that deformation is more pronounced in the excavation's long-side regions than the short-side regions, with greater deformation occurring at the midpoints of each side relative to the pit corners. The spatial effects are influenced by excavation depth and lithological characteristics.
Additionally, the horizontal displacement of the support structure decreases as the elastic modulus and cohesion of the soil increase. Salas [21] analyzed the dynamic behavior of deep foundation pile-anchor support system in gravel formations in San Diego through numerical simulation techniques. Liu [22] employed MIDAS software to evaluate pile-anchor support structures' internal force distribution and stability variations under continuous rainfall conditions. The results demonstrate that rainfall leads to soil saturation, reducing shear resistance and compromising the stability of the support structure. As rainfall duration increases, both rainwater infiltration depth and structural stability reach equilibrium states. Yu [23] proposed a prefabricated pile-anchor support system constructed from steel sections, wooden boards, and anchor cables. Field tests and numerical simulations confirmed that this modular support system effectively resists earth pressure and mitigates bottom-uplift deformation of the excavation. Kang [24] examined the deformation of adjacent existing buildings. By utilizing MIDAS GTS NX software to compare the retaining performance of double-row piles and pile-anchor support structures, it was demonstrated that the pile-anchor support system exhibited superior retaining effectiveness. Furthermore, it was concluded that structures more than 12 meters away from the foundation pit would not be subject to disturbances affecting the safe use of structures. Li [25] employed FLAC3D software to calculate the top settlement of piles and deep horizontal displacements during the excavation of a specific deep foundation pit supported by a “double-row piles + anchor rods” structure. The calculated results were subsequently compared with observed data; the error between the calculated results and the observed data was relatively small. Sun [26] used the FLAC3D software to simulate the excavation process of a deep foundation, proposed a quantitative analysis to obtain the deformation law of the foundation pit, by analyzing the variation law of stress and deformation, the timeliness of the data in the construction process is improved. Chen [27] compared the influence of soil nail wall and pile anchor support on load and deformation and proposed an optimized method of setting up soil nail wall on the upper part of the slope and using anchor support combined on the lower part.
In summary, due to the variations in on-site conditions, the theoretical calculation, support methods, deformation characteristics, and sliding surface morphology of deep foundation pits adjacent to existing buildings cannot be unified. To address the design challenges of complex deep foundation pit support systems and quantitatively analyze the influence of foundation pit deformation on adjacent existing structures, through model tests and numerical simulations, relying on the deep foundation pit of a three-line ship lock on the Xiangjiang River as the research object, this study investigates the force and deformation characteristics of the pile-anchor support system under complex conditions. The active deformation sliding surface of finite soil behind piles is a curve or polyline that is higher than the heel of the wall and returns to the adjacent buildings. The findings provide guidance significance and application value for engineering design of complex deep foundation pit support system.
2. An overview of model testing and numerical simulations
2.1. Model testing apparatus
The test device comprises a model box, a retaining wall, a pile-anchor system, a displacement measurement system, and a data acquisition and analysis system. The model box has dimensions of 1200 mm × 400 mm × 700 mm, with 16 mm transparent tempered glass on the front and an opening at the top; the remaining panels are constructed from 16 mm steel plate. Model testing equipment is shown in Fig. 1; the left side of model box serves as the movable retaining wall, which is hinged to the upper and lower transmission shafts on its outer side. Inside the box, slots are set at 10 cm intervals, which can be used to place a fixed retaining wall on the right side to achieve different filling widths. A reaction frame is installed above the model box to facilitate the installation of anchor hollow bolts.
Fig. 1Model testing equipment. Photo taken by Sanxian Liu, geotechnical laboratory of Hunan Institute of Science and Technology, in February 2024
a) Front view
b) Top view
2.2. The design and construction of pile-anchor support structure model
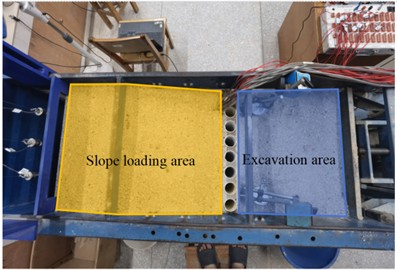
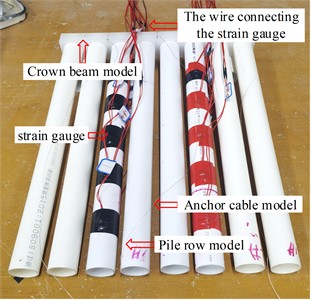
To simulate the pile-anchor support system, PVC pipes were used to simulate concrete piles and PVC plate were utilized to simulate crown beams. Eight PVC pipes were sequentially marked as 1 #~8 #. The pipes have an outer diameter of 40 mm, a wall thickness of 2 mm, and a length of 475 mm. The size of the PVC plate is 25 mm × 400 mm × 40 mm, and a hole is drilled every 50mm along the length direction for placing PVC pipes. Grooves are made between holes 2 #, 3 #, 4 #, 5 #, and 6 #, 7 # for fixing model anchor cables. The arrangement of the model piles, strain gauges, and displacement meters is illustrated in Fig. 2.
Fig. 2The arrangement of the model piles, strain gauges, and displacement meters
As shown in Fig. 2, the strain gauges are symmetrically positioned on the excavation and non-excavation sides of piles No. 3 and No. 6. Horizontal displacement measurement points at the pile tops are located on the excavation side between boreholes No. 1 and No. 2, as well as between boreholes No. 7 and No. 8. PVC pipes No. 1 to No. 8 are inserted into the corresponding holes of the PVC plate, ensuring that the bottoms of the PVC pipes are aligned and that 450 mm is exposed above the surface. Subsequently, the PVC pipes and the PVC plate are securely bonded using adhesive. Then, the strong double-sided tape is used to stick fine mesh gauze on the excavation side of the support model to prevent the non-excavation side soil from leaking between the PVC pipes to the excavation side. The Pile-anchor support structure model with strain gauge is shown in Fig. 3; the anchor cable model is fastened at the steel wire groove of the PVC plate, maintaining a remaining length of 1.5 meters. The strain data for the pile body was acquired using strain gauges and static strain measurement devices.
Fig. 3Pile-anchor support structure model with strain gauge. Photo taken by Sanxian Liu, geotechnical laboratory of Hunan Institute of Science and Technology, in February 2024
2.3. Model test scheme
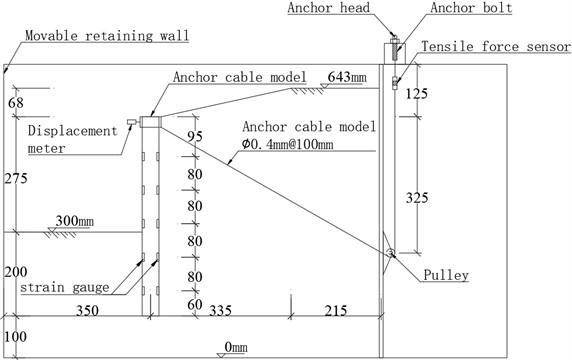
To investigate the deformation characteristics of pile-anchor support system in deep foundation pit, two comparative model tests were designed for the soil behind the crown beam: “no slope” and “with a slope”. The design elevation view of no slope and a slope condition behind the crown beam is presented in Fig. 4 and Fig. 5, respectively. Compared to the model test without slope, the model test with slope has identical pile row length and excavation depth, but the top of the crown beam has slope to simulate the loading condition.
Fig. 4Design elevation view of no slope condition behind the crown beam
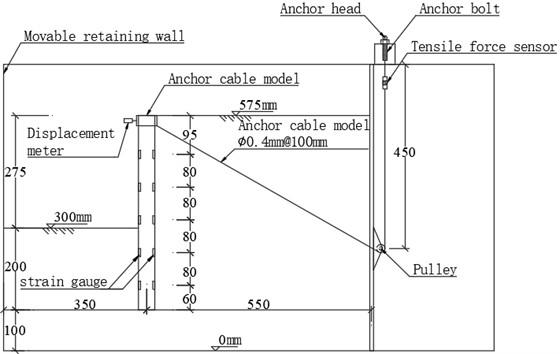
The anchor cable passes through the pulley to connect the crown beam with the tension sensor. The tension sensor is securely fastened to the anchor cable via anchor bolts. A displacement meter is installed at the center of the crown beam to measure the horizontal displacement at the pile’s top. Strain gauges are arranged on the pile body to measure the bending moment of the pile. The total designed excavation depth 275 mm, which is divided into five excavations. The depth of the first excavation is 75 mm, and each of the remaining excavations is 50 mm. In the single-group tests, the amount of sand used without slope and with a slope was 0.207 m3 and 0.217 m3, respectively.
Fig. 5Design elevation view of a slope condition behind the crown beam
2.4. Filling material parameters
The filling material used in this model test is sandy soil, which is taken from Dongting Lake in Yueyang, China. The material was processed by sieving pebbles and impurities, then washing with water and sun-drying to prepare the test filler. The soil physical and mechanical parameters are presented in Table 1. The particle size distribution of the test filler was determined using the sieve analysis method. The particle sizes of the fillers predominantly ranged between 0.5 mm and 2 mm, characterized as poorly graded coarse sandy soil with a non-uniformity coefficient = 4.89 and a curvature coefficient = 1.71. Through the density test and direct shear test, the natural density of the test filler under loose conditions is = 1.46 g/cm3, and the internal friction angle = 35.4°.
Table 1Soil physical and mechanical parameters
Particle size distribution range (mm) | Natural density (g/cm3) | Internal friction angle (°) | Soil cohesion (kPa) | Poisson’s ratio |
0.5-2.0 | 1.46 | 35.4 | 0 | 0.22 |
2.5. Testing procedure
Taking the slope on the crown beam top test as an example, the operation and steps of the model test are introduced:
1) Install three sets of pulleys on the fixed retaining wall at the anchor cable position shown in Fig. 5. Seal the excess gaps in the fixed retaining wall using tape.
2) Secure the fixed retaining wall into the slot of the model box, ensuring that the movable retaining wall is perfectly vertical and positioned precisely 900 mm away from the fixed retaining wall; and then install and adjust the reaction frame and anchor bolt status and position in sequence.
3) Weigh 52.56 kg of fill soil, pour it into the model box, and level it to a height of 100 mm to serve as the base filling material.
4) Apply Vaseline to both ends of the pile-anchor support structure model, then install it precisely 350 mm away from the movable retaining wall.
5) Thread the anchor cable through the fixed retaining wall, pulleys, and anchor bolts on the reaction frame, securing the anchor head with the anchor bolts.
6) Place a level on the top surface of the PVC plate to adjust the orientation of pile-anchor support structure model, ensuring its precise vertical alignment.
7) Fill in the sand again, ensuring that the pile anchor support structure model is vertical during the filling process, until the shape distribution of sand matches the configuration illustrated in Fig. 5.
8) Tighten the model anchor cable using the pulley system, cut the excess cable beneath the reaction frame, and install the tensile force sensor.
9) Adjust the tension of the model anchor cable by rotating the anchor bolts on the reaction frame until the tension sensor indicates a reading of 5 N.
(10) Install two sets of displacement dial indicators at the center of the crown beam as shown in Fig. 2, ensuring that the dial indicator probe just touch the crown beam and adjust the initial reading to 0.00 mm.
11) Connect the strain gauge cable and the tensile force sensor data cable to the corresponding data acquisition instruments.
12) After a stabilization period of 24 hours, sequentially remove the sandy soil layers with depths of 75 mm, 50 mm, 50 mm, 50 mm, and 50 mm on the excavation side, and record the readings from the strain gauge, tensile force sensor, and displacement dial indicators.
2.6. An overview of numerical simulation of model test
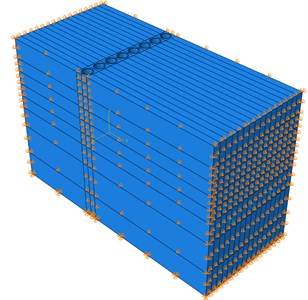
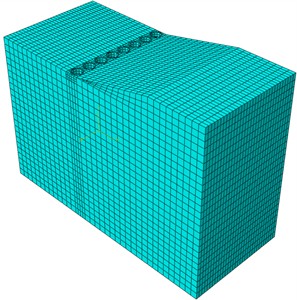
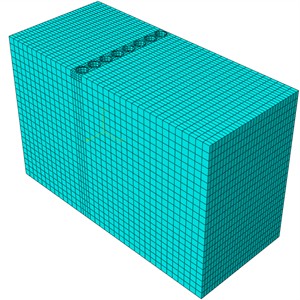
Numerical simulations were carried out using the ABAQUS software, with the slope condition and no slope condition behind the crown beam test serving as an illustrative example. Boundary constraint conditions of model with the slope condition and no slope condition is shown in Fig. 6, Grid division of model with the slope condition and no slope condition is shown in Fig. 7.
Fig. 6Boundary constraint conditions of model with the slope condition and no slope condition
a) With the slope condition behind the crown beam
b) No slope condition behind the crown beam
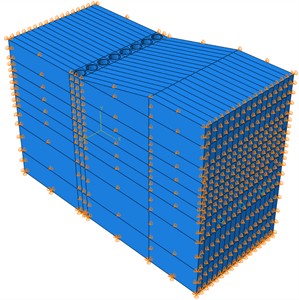
A 1:1 modeling analysis was conducted under the following conditions: the soil was modeled using the Mohr-Coulomb constitutive model; the anchor cables and row piles were both modeled as linear elastic materials. To account for the frictional interaction between the piles and soil, a frictional contact with relative slip was implemented, with a friction coefficient of 0.32. The relative deformation between the steel wire and the soil, as well as between the steel wire and the crown beam of the row pile, was constrained using an embedded model.
According to the model test conditions, -directional displacement constraints are set on the 0 mm and 900 mm planes, -directional displacement constraints are set on the 0 mm and 400 mm planes, and -directional, -directional, and -directional displacement constraints are set on the 0 plane. For the anchor cable, displacement constraints in the , , and directions are set on the plane at 900 mm. The pile row and soil models utilize the C3D8 element; the anchor cable model employs the T3D2 element. The model with the slope condition and no slope condition is discretized into a total of 33966 elements and 35950 elements, respectively.
Fig. 7Grid division of model with the slope condition and no slope condition
a) With the slope condition behind the crown beam
b) No slope condition behind the crown beam
3. The validation on the reliability of numerical model
To verify the reliability of the numerical model, a comparative analysis was conducted on the horizontal displacement of the pile top and the bending moment of the pile body between the model test and numerical simulation.
3.1. Results and analysis on horizontal displacement of pile top in model test
To study the variation law of pile top horizontal displacement with burial depth, the test results of pile top horizontal displacement when the foundation pit is excavated to the bottom (275 mm) are summarized in Table 2. The horizontal displacement of the pile top towards the outside of the foundation pit is positive, and towards the inside of the foundation pit is negative.
Table 2Test results for horizontal displacement at the top of pile
Excavation depth (mm) | Horizontal displacement at the top of the test pile with no slope (mm) | Average value (mm) | Horizontal displacement at the top of the test pile with a slope (mm) | Average value (mm) | ||
Measurement Point No. 1 | Measurement Point No. 2 | Measurement Point No. 1 | Measurement Point No. 2 | |||
75 | 0 | 0 | 0 | 0 | 0 | 0 |
125 | 0 | 0 | 0 | 0 | 0 | 0 |
175 | 0 | 0 | 0 | 0 | 0 | 0 |
225 | –0.02 | –0.01 | –0.015 | –0.04 | –0.03 | –0.035 |
275 | –0.08 | –0.08 | –0.080 | –0.13 | –0.12 | –0.125 |
It can be observed from Table 2 that when the excavation depth 175 mm, the displacement at the pile top in the model test without slope and with a slope is 0 mm. When the excavation depth 225 mm, the average displacement at the pile top in the no slope model test is –0.015 mm, while in the model test with a slope, the average displacement at the pile top is –0.035 mm, there is an increase of 57.1 % compared to the no slope model. Upon excavation reaching the pit bottom (275 mm), the average displacement at the pile top in the model test without slope is –0.080 mm. In contrast, in the model test with a slope, the average displacement at the pile top is –0.125 mm, indicating a 36.0 % greater displacement in the model with a slope.
3.2. Results and analysis on bending moment in the pile body in model test
The strain gauge readings on the excavation side and the non-excavation side of the same cross-section of pile body are denoted as and , respectively. The bending moment of the pile body can be calculated based on and using Eq. (1):
where is elasticity modulus of pile body material, is pile section moment of inertia, is the pile diameter.
Taking the bottom elevation of the model test as 0, the top elevation of the pile is 575 mm. The calculated results for the bending moment of the pile body are presented in Table 3. The bending moment is positive when directed towards the inner side of the foundation pit and negative when directed towards the outer side.
Table 3Results of the bending moment of piles No. 3 and No. 6 in model test
Pile number | 3# | 6# | |||||||||
Interface number | 3-1 | 3-2 | 3-3 | 3-4 | 3-5 | 6-1 | 6-2 | 6-3 | 6-4 | 6-5 | |
Burial depth (mm) | 90 | 170 | 250 | 330 | 410 | 90 | 170 | 250 | 330 | 410 | |
Bending Moment (Nm) | Excavation 75 mm | –43.9 | –4.4 | 11.6 | –3.9 | –1.6 | –45.2 | –4.2 | 12.5 | –3 | –1.3 |
Excavation 125 mm | –88.5 | –25.4 | 14.7 | –5.5 | 2.8 | –86.5 | –27.3 | 15.3 | –4.4 | 2.7 | |
Excavation 175 mm | –96.1 | –68.8 | –21.3 | 29.8 | 14.3 | –95.4 | –70.2 | –22.5 | 27.8 | 15.2 | |
Excavation 225 mm | –99.5 | –100.4 | –11.8 | 254.4 | 140.5 | –100.9 | –102.5 | –15.3 | 249.4 | 142.4 | |
Excavation 275 mm | –165.8 | –160.6 | –58.8 | 152.6 | 112.4 | –169 | –158.5 | –56.4 | 154.3 | 113.3 | |
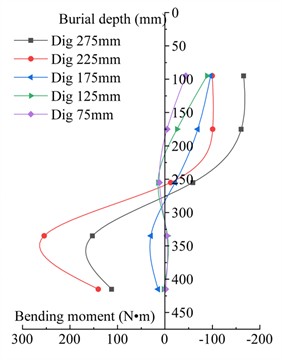
The bending moment test results for piles No. 3 and No. 6 of different excavation depths were plotted in Fig. 8 and Fig. 9, respectively. It can be observed from Fig. 8 and Fig. 9 that the variation laws of the bending moments for pile No. 3 and pile No. 6 are the same, both exhibiting an “S” shaped distribution. When the excavation depth 130 mm, the bending moment curve of the pile body can be divided into three segments: the middle segment has a positive bending moment, while the upper and lower segments have negative bending moments. The bending moment increases with the increase of excavation depth. This phenomenon occurs because, at relatively shallow excavation depths, the influence of the backfill on the pile body is minimal, and the stress in the anchor cable primarily governs the bending moment. The anchor cable, fixed to the crown beam, exerts a certain constraint on the horizontal displacement of the pile body. When the excavation depth 180 mm, the bending moment curve of the pile body can be divided into two segments, the upper segment exhibits a negative bending moment, and the lower segment exhibits a positive bending moment; The bending moment and curve curvature of the pile body increase as the excavation depth increases. At this point, the effect of the filling material on the pile body gradually increases, and the bending moment of the pile body is gradually controlled by the effect of the filling material.
Piles No. 3 and No. 6 are located at the center of the test section, and the deformation results are considered representative. The average bending moments of the pile bodies of No. 3 and No. 6 piles in the model tests without slope and with slope when burial depth 275 mm were taken as the representative values of the pile body bending moments. The representative values of the pile body bending moments are detailed in Table 4.
Table 4Representative values of pile body bending moment in model tests
Burial depth (mm) | 90 | 170 | 250 | 330 | 410 | |
Bending moment (N·m) | No slope | –156.499 | –162.078 | –77.139 | 108.978 | 80.034 |
Slope | –167.405 | –159.525 | –57.626 | 153.475 | 112.855 | |
Relative difference | 6.97 % | –1.58% | –25.30 % | 40.83 % | 41.01 % | |
It can be known from Table 4 that at burial depths of 90 mm, 330 mm, and 410 mm, the bending moment of the pile body of the model with slope is greater than that of the model without slope. Conversely, at burial depths of 170 mm and 250 mm, the bending moment of the pile body of the model with slope is smaller than that of the model without slope. Additionally, as the burial depth increases, the difference in the bending moment of the pile body between the two models becomes more pronounced.
Fig. 8Bending moment curve for pile No. 3 of different excavation depths
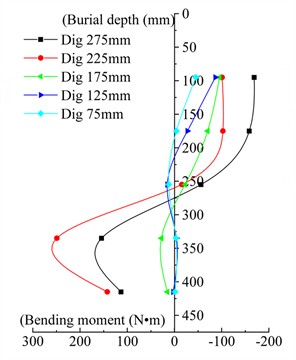
Fig. 9Bending moment curve for pile No. 6 of different excavation depths
3.3. Comparative analysis of horizontal displacement at the top of pile in model test
The horizontal displacement of the pile top under various excavation conditions was systematically summarized and compared based on the model test and the numerical simulation. The statistical analysis of horizontal displacement at the top of pile is presented in Table 5.
Table 5Statistical analysis of horizontal displacement at the top of pile
Condition | No slope behind the crown beam | With slope behind the crown beam | ||||||||
Excavation conditions (mm) | 75 | 125 | 175 | 225 | 275 | 75 | 125 | 175 | 225 | 275 |
Model test results (mm) | 0.000 | 0.000 | 0.000 | –0.015 | –0.080 | 0.000 | 0.000 | 0.000 | –0.035 | –0.125 |
Numerical simulation results (mm) | 0.010 | 0.009 | 0.009 | –0.013 | –0.080 | 0.009 | 0.005 | 0.001 | –0.040 | –0.130 |
Relative difference | – | – | – | 15 % | 0 % | – | – | – | 14 % | 4 % |
Root mean square error | 0.33 % | 0.30 % | ||||||||
It can be observed from Table 5 that when the excavation depth 175 mm, the horizontal displacement of the pile top in the numerical simulation is positive. When the excavation depth 175 mm, the numerical simulation indicates a negative horizontal displacement at the pile top. Given that the dial indicator cannot measure forward displacement, the measured horizontal displacement at the pile top during the model test is 0 mm when the excavation depth 175 mm. As the excavation depth increases, the pile top gradually shifts toward the excavation side of the foundation pit. When the excavation depth 225 mm and 275 mm, the relative difference and root mean square error between the numerical simulation and model test results of the horizontal displacement at the pile top is less than 15 % and 0.33 %, respectively. The variation trend of the horizontal displacement at the pile top remains consistent, demonstrating that the numerical simulation results are in agreement with the model test results.
3.4. Comparative analysis of pile body bending moment in model test
Piles No. 3 and No. 6 are located at the center of the test section, and the deformation results are representative. When the excavation depth 275 mm, the average bending moments of the pile bodies for piles No. 3 and No. 6 obtained from the numerical simulation were compared and validated against those derived from the model test. The test results and calculated values of pile body bending moment are presented in Table 6.
Table 6Test results and calculated values of pile body bending moment
Condition | No slope behind the crown beam | With slope behind the crown beam | ||||||||
Burial depth (mm) | 90 | 170 | 250 | 330 | 410 | 90 | 170 | 250 | 330 | 410 |
Model test results (N·m) | –156.50 | –162.08 | –77.14 | 108.98 | 80.03 | –167.41 | –159.53 | –57.63 | 153.48 | 112.86 |
Numerical simulation results (N·m) | –182.00 | –175.60 | –34.68 | 114.30 | 94.52 | –192.60 | –169.60 | –16.21 | 146.10 | 123.90 |
Relative difference | 16 % | 8 % | –55 % | 5 % | 18 % | 15 % | 6 % | –72 % | –5 % | 10 % |
According to Table 6, except for the section at a burial depth of 250 mm, the difference in bending moment between the numerical simulation and the model test results for all other sections is less than 18 %. The bending moment of the cross-section at a burial depth of 250 mm exhibited a deviation of 72 %. The deviation of 72 % was attributed to the separation between the fine-hole gauze and the pile during testing, which allowed sand to infiltrate the gap between the two components. Consequently, during the excavation process, the pile body was subjected to the lateral earth pressure from the non-excavated side and the sand's additional load between the fine-pore gauze and the pile body.
The comparison of the bending moment of pile bodies without slope and with a slope behind the crown beam is presented in Fig. 10 and Fig. 11, respectively.
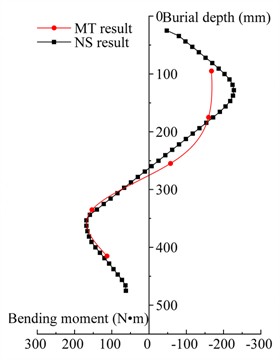
It can be observed from Fig. 10 and Fig. 11 that both the model test and the numerical simulation of the bending moment distribution along the pile body exhibit an “S” shaped distribution. In the model test, the maximum negative bending moment occurs at 140 mm, while in the numerical simulation, it is located at 150 mm. Similarly, the maximum positive bending moment is observed at 350 mm in the model test and at 360 mm in the numerical simulation. Overall, the numerical simulation results are in good agreement with those of the model test.
Fig. 10Comparison of bending moments of pile body without slope behind the crown beam
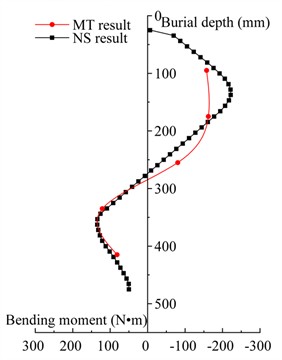
Fig. 11Comparison of the bending moments of pile body with a slope behind the crown beam
By comparing and analyzing the horizontal displacement at the top of the pile and the bending moment of the pile body, the numerical simulation results exhibit high consistency with the model test results. This indicates that the proposed numerical model is valid and can provide a reliable basis for designing foundation pit support schemes.
4. Analysis of engineering case
Based on the validated ABAQUS numerical model, a comprehensive deformation analysis was conducted for the pile-anchor support system of the deep foundation pit associated with the third-line ship lock on the Xiangjiang River.
4.1. Project summary
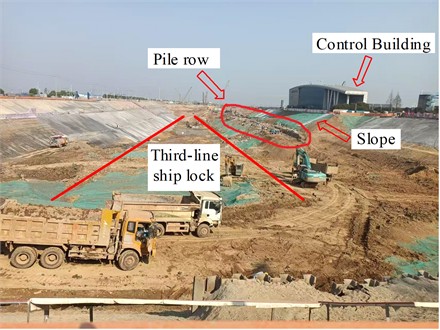
A deep foundation pit was formed during the excavation of a specific third-line ship lock on the Xiangjiang River. This foundation pit is close to existing second-line ship locks, ship lock control buildings, and other structures. The location map of the project area is illustrated in Fig. 12. The surrounding environment of the foundation pit is complex; it is essential to have strict control of the deformation of the foundation pit. The preliminary design proposes a support scheme combining row piles with anchor cables. The layout of pile-anchor support section for the third-line ship lock is presented in Fig. 13.
Fig. 12The location map of the project area. Photo taken by Yuchen Liu at the Caijiazhou project site in Wangcheng District, Changsha City, Hunan Province on June 2023
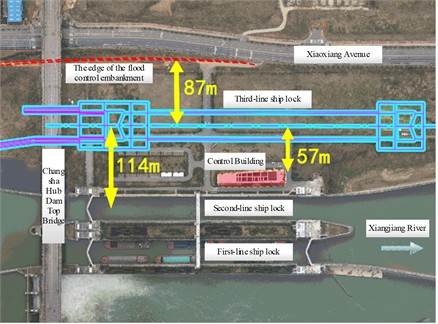
Fig. 13The layout of pile-anchor support section for the third-line ship lock. Photo taken by Yuchen Liu at the Caijiazhou project site in Wangcheng District, Changsha City, Hunan Province on January 2024
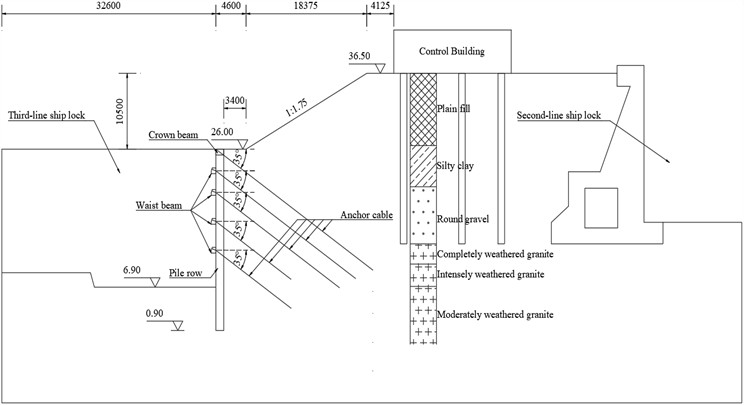
The typical section is located adjacent to the existing second-line ship lock and the ship lock control building. The support height is 19.10 m. The foundation pit support scheme is a single-row pile combined with five anchor cables. The lengths of anchor cables are 23 m, 26 m, 23 m, 14 m, and 14 m, respectively. The cross-sectional dimensions of the crown beam are 1.20 m × 0.80 m (width × height), while those of the waist beam are 1.00 m × 0.80 m (width × height). The preliminary design scheme for pile-anchor support in the typical section is shown in Fig. 14.
Fig. 14Preliminary design scheme for pile-anchor support in typical section
4.2. Engineering geological conditions
According to the geological investigation, the rock and soil strata at the site consist of Quaternary residual fill, Holocene Quaternary Orange Isle Formation alluvial layers, and Yanshanian intrusive rocks, forming a total of seven distinct layers. The physical and mechanical properties of each layer rock and soil materials are presented in Table 7.
Table 7Physical and mechanical properties of each layer rock and soil materials
Name of rock and soil sample | Layer thickness (m) | Natural density (g/cm3) | Deformation modulus (MPa) | Poisson’s ratio | Soil cohesion (kPa) | Internal friction angle (°) |
Plain fill | 10.24 | 1.97 | 2.7 | 0.25 | 10 | 10.0 |
Silty clay | 2.00 | 1.99 | 7.5 | 0.30 | 20 | 16.5 |
Rounded gravel | 11.36 | 2.20 | 38.0 | 0.20 | 0 | 33.0 |
Fully weathered granite | 2.80 | 1.90 | 15.0 | 0.35 | 25 | 18.0 |
Strongly weathered granite | 3.10 | 1.97 | 18.0 | 0.35 | 50 | 20.0 |
Moderately weathered granite | 22.14 | 2.60 | 4000 | 0.28 | 1300 | 34.0 |
Slightly weathered granite | 35.00 | 2.63 | 23000 | 0.20 | 1800 | 38.0 |
4.3. An overview of numerical simulation of engineering cases
4.3.1. Numerical simulation working conditions
To investigate the variation law of horizontal displacement and bending moment of the pile body, surface settlement and bottom uplift of the foundation pit in the pile-anchor support structure, a parametric study was conducted focusing on pile diameters ranging from 1.0 m to 2.0 m and evaluate the influence of pile diameters (1.0 m 2.0 m) on the force and deformation characteristics of pile-anchor support system. Five sets of distinct working conditions were established, as shown in Table 8.
Table 8Numerical simulation working conditions of engineering case
Pile diameter (m) | Pile spacing (m) | Pile body insertion ratio | Anchor cable angle (°) | Prestressed anchor cable (kN) |
1.0 | 2.50 | 0.3 | 35 | 400 |
1.2 | 2.50 | 0.3 | 35 | 400 |
1.5 | 2.50 | 0.3 | 35 | 400 |
1.8 | 2.50 | 0.3 | 35 | 400 |
2.0 | 2.50 | 0.3 | 35 | 400 |
4.3.2. Material properties
The pile body, crown beam, and waist beam are constructed using C30 concrete, and the prestress of the anchor cable is applied through the cooling method. The physical and mechanical properties of the concrete and anchor cable are presented in Table 9.
Table 9Physical and mechanical properties of the concrete and anchor cable
Parameters | Density (g/cm3) | Elastic modulus (GPa) | Poisson’s ratio | Coefficient of expansion (℃) |
Concrete | 2.40 | 30 | 0.2 | – |
Anchor cable | 7.85 | 195 | 0.3 | 1.2×10⁻⁵ |
4.3.3. Boundary conditions and mesh division of numerical model
The numerical simulation is divided into five components: soil, row pile, crown beam, waist beam, and anchor cable. The soil is categorized into the excavated side and the non-excavated side according to the cross-section where the pile axis is located. The slope and the top of the slope are the areas with additional construction loads. Excavation conditions are segmented into six steps in accordance with the construction sequence, with corresponding excavation depths of 2.0 m, 3.4 m, 6.4 m, 10.4 m, 14.4 m, and 19.1 m, respectively.
Fig. 15Boundary constraint condition of engineering case
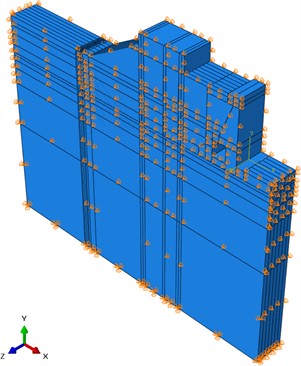
Fig. 16Grid division of engineering case
The boundary constraint condition of engineering case is shown in Fig. 15. The bottom of the numerical model is subject to displacement constraints in the , , and directions. The -direction displacement constraint is applied to the boundary perpendicular of the pile row, and the -direction displacement constraint is applied to the boundary parallel of the pile row.
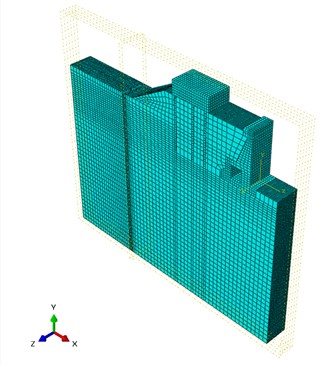
The grid division of engineering case is illustrated in Fig. 16. The soil, row pile, and crown beam adopt three-dimensional solid elements, and the element type is C3D8. The anchor cable adopts truss elements, and the element type is T3D2. The waist beam adopts beam elements, and the element type is B31.
4.4. Numerical simulation results and comprehensive analysis
Through numerical simulation, a systematic analysis was conducted to investigate the influence laws of pile diameter on the horizontal displacement, bending moment, surface settlement, and bottom uplift of the foundation pit.
4.4.1. Results and analysis of horizontal displacement of pile body
To investigate the variation pattern of the pile body’s horizontal displacement, the results of the horizontal displacement were systematically analyzed when the foundation pit was excavated to the bottom ( 19.1 m). The horizontal displacement curve of pile body under different pile diameters is shown in Fig. 17.
It can be observed from Fig. 17 that the horizontal displacement curves of the pile body exhibit a “bulging belly” shape, characterized by smaller displacements at the top and bottom and a larger displacement in the middle. Additionally, the curvature of displacement curves decreases with the increase of pile diameter; when the diameter of the pile changes from 1 m to 2 m, the extreme value of the horizontal displacement of the pile body reduced from 39.79 mm to 10.63 mm, the burial depth of the displacement extreme point decreased from 9.03 m to 4.01 m, which is located between 0.47 and 0.21 of the foundation pit.
Fig. 17The horizontal displacement curve of pile body under different pile diameters
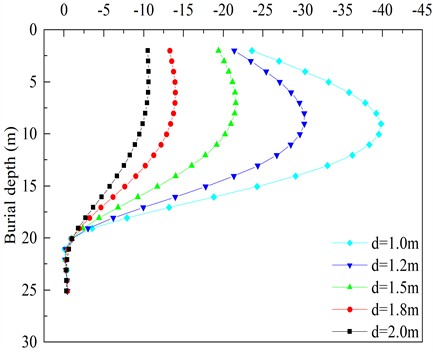
The “Technical standard for monitoring of building excavation engineering” (GB50497-2019) [28] and the “Technical specification for retaining and protection of building foundation excavations” (JGJ120-2012) [29] primarily provide limitations on the horizontal displacement of the pile top for some support structures and do not explicitly indicate the displacement control criteria for pile-anchor support system. The “Code for design of building foundation” (GB 50007-2011) [30] specifies the maximum lateral deformation of supporting structures based on the clear distance between adjacent buildings and excavation boundaries of foundation pits. In this study, by referring to the aforementioned standards and considering the specific characteristics of this foundation pit, the extreme value of horizontal displacement at the pile top is set to 20 mm, and the extreme value of horizontal displacement within the pile body is determined as 57.3 mm, serving as the displacement control indicators for the pile-anchor support system. Based on the above calculation results, the pile diameter 1.5 m is identified as the optimal choice.
4.4.2. Results and analysis of pile body bending moment
To investigate the variation pattern of the pile body bending moment, the results of pile body bending moment were summarized when the foundation pit was excavated to the bottom ( 19.1 m). The bending moment curve of pile body under different pile diameters is shown in Fig. 18.
It can be known from Fig. 18 that the pile diameter increases from 1.0 m to 2.0 m, the extreme value of the negative bending moment of the pile body increases from 1590 kN·m to 3130 kN·m, and the burial depth of the extreme value point of the negative bending moment decreases from 11.63 m to 10.66 m, which is located between 0.61 and 0.56 of foundation pit. The extreme value of the positive bending moment of the pile body increased from 2730 kN·m to 10180 kN·m, and the burial depth of the extreme point of the positive bending moment increased from 19.33 m to 19.81 m, which was located at the bottom of the foundation pit (–0.01 to –0.03). A larger pile diameter corresponds to a greater stiffness of the pile body, enabling it to withstand higher bending moments and bear greater loads, which results in an increased bending moment of the pile body. The positions of the extreme points of positive and negative bending moments change relatively little. When the pile diameter is 1.5 m 2.0 m, the lateral negative bending moment curves on the pile body almost coincide. To fully leverage the role of the anchor cable in the pile-anchor support structure, the pile diameter 1.5 m is the optimal.
Fig. 18The bending moment curve of pile body under different pile diameters
4.4.3. Results and analysis of surface settlement
To investigate the variation pattern of surface settlement, the surface settlement data obtained upon excavating the foundation pit to the bottom ( 19.1 m) were systematically analyzed. Fig. 19 shows the maximum ground settlement at the top of the slope under different pile diameters. Notably, vertical displacement is defined as positive for upward movement and negative for downward movement.
It can be observed from Fig. 19 that as the pile diameter increases from 1.0 m to 2.0 m, the surface settlement value decreases from 12.62 mm to 4.02 mm, and the tangent inclination angle of the surface settlement relationship curve gradually decreases. A larger pile diameter results in an increased overall stiffness of the supporting structure, thereby reducing the surface settlement.
Fig. 19The maximum ground settlement at the top of the slope under different pile diameters
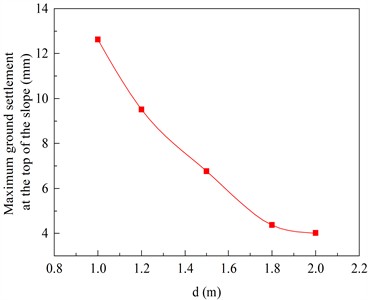
The adjacent building is the ship lock control building, with a clear distance of 26.57 meters away from the excavation boundary of foundation pit. By the “Code for Design of Building Foundation” (GB 50007-2011), the surface settlement limit is determined to be 0.25 % of the excavation depth of foundation pit, that is, 47.75 mm. For various pile diameters, the maximum surface settlement values after the completion of foundation pit excavation are all less than 47.75 mm. Increasing the pile diameter effectively reduces surface settlement at the top of the slope. However, the extent of surface settlement reduction decreases with the pile diameter increase. Excessive pile diameters result in underutilization of support performance and waste of engineering materials. Considering both safety and economic efficiency comprehensively, a reasonable pile diameter is within the range of 1.2 m 1.8 m, with 1.5 m being the optimal choice.
4.4.4. Results and analysis of pit bottom uplift
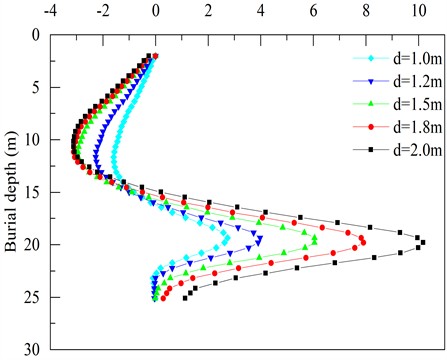
To investigate the variation pattern of pit bottom uplift, the results of pit bottom uplift when the foundation pit was excavated to its bottom ( 19.1 m) were systematically summarized. The pit bottom uplift displacement under different pile diameters is shown in Fig. 20. By taking the intersection between the row piles and the bottom surface of the foundation pit as the origin, the direction moving away from the row piles is defined as positive.
As illustrated in Fig. 20, the uplift curves at the bottom of the excavation pit are basically coincident. The variation patterns of all uplift curves are first decreasing and then significantly increasing, forming a “hooked” shape. When the distance from the row pile is less than 1m, the uplift at the bottom of the pit decreases as the distance increases. Conversely, when the distance exceeds 1 meter, the uplift at the bottom of the pit increases with the increase of distance and then tends to stabilize. When exceeds 2 meters, the uplift curves at the bottom of the pit for pile diameters of 1.0 meters and 1.2 meters are similar. The uplift curves are slightly lowered for pile diameters ranging from 1.5 meters to 2.0 meters, comparable to those for those of 1.0 meters and 1.2 meters. The influence of pile diameter on the bottom uplift of the excavation pit is relatively minor. To control the variation range of the bottom uplift and prevent the foundation from kicking feet destruction, the optimal pile diameter is determined to be 1.5 meters.
5. Deformation results and analysis of adjacent existing buildings
The existing buildings within the influence range of foundation pit excavation include the ship lock control building and the second-line ship lock. This study systematically summarizes and analyses the effects of pile diameter on the inclination, vertical displacement, and active failure sliding surface of the existing buildings.
Fig. 20The pit bottom uplift displacement under different pile diameters
5.1. Results and analysis of inclination control mechanisms in ship locks
To investigate the variation law of the influence of pile diameter on the top inclination of the ship lock control building, The calculation results of the top inclination of the ship lock control building excavated to the bottom of the pit (19.1 m) were systematically summarized, The inclination curve of the ship lock control building under different pile diameters is presented in Fig. 21. The formula for calculating the inclination of the ship lock is provided in Eq. (2). In this study, vertical displacement is defined as positive for upward movement and negative for downward movement:
where is the inclination of the ship lock, and is lateral displacement and vertical displacement of the measuring point, respectively; is height difference between the measuring point and the ground surface.
Fig. 21The inclination curve of the ship lock control building under different pile diameters
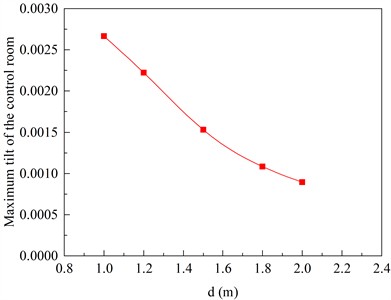
The overall displacement of the ship lock control building tilts towards the foundation pit. As illustrated in Fig. 21, the pile diameter increases from 1.0 m to 2.0 m, the inclination of the ship lock control building roof gradually decreases from 0.0027 to 0.0009. Both values are significantly smaller than the allowable inclination limit of 0.004 specified in the “Code for Design of Building Foundation” (GB 50007-2011).
5.2. Vertical settlement of the gate chamber foundation
To study the variation law of the influence of pile diameter on the vertical displacement of the gate chamber foundation, the results of the vertical displacement of the gate chamber foundation when the foundation pit was excavated to the bottom of the pit (19.1 m) were systematically summarized. The vertical displacement of gate chamber foundation under different pile diameters is shown in Fig. 22.
Fig. 22The vertical displacement of gate chamber foundation under different pile diameters
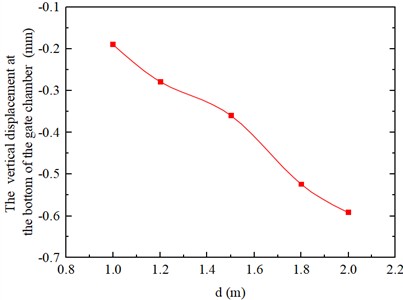
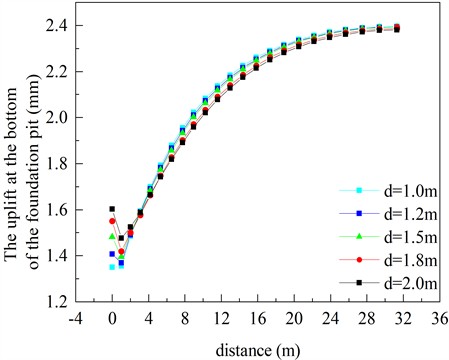
It can be observed from Fig. 22 that as the pile diameter increases from 1.0 m to 2.0 m, the average vertical displacement of the gate chamber foundation correspondingly increases from 0.19 mm to 0.59 mm. Both values remain significantly smaller than the allowable average settlement limit of 200 mm specified in the “Code for Design of Building Foundation” (GB 50007-2011).
5.3. Results and analysis of active deformation in finite soil masses
Due to the limitations of the foundation of the second-line ship lock adjacent to the existing building, the soil outside the foundation pit of the third line ship lock does not meet the semi-infinite soil condition, and there is finite soil failure and deformation [31-32]. To study the variation law of pile diameter on the active deformation of finite soil, the -direction soil displacement nephogram of excavation 19.1 m in the foundation pit was summarized; The nephogram of finite soil displacement in the direction under different pile diameters is shown in Figs. 23-27. For the convenience of comparative analysis, a unified scale is used for all displacement nephogram.
Fig. 23Cloud map representing soil displacement in the X direction (d= 1.0 m)
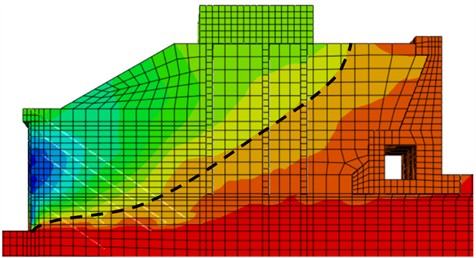

Fig. 24Cloud map representing soil displacement in the X direction (d= 1.2 m)
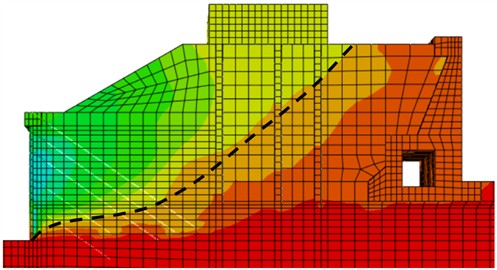
Fig. 25Cloud map representing soil displacement in the X direction (d= 1.5 m)
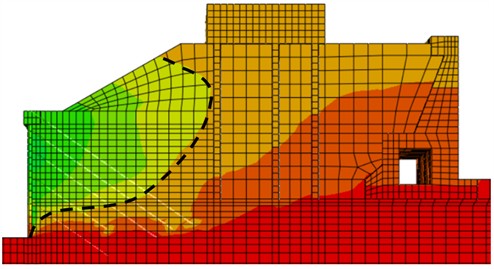

Fig. 26Cloud map representing soil displacement in the X direction (d= 1.8 m)
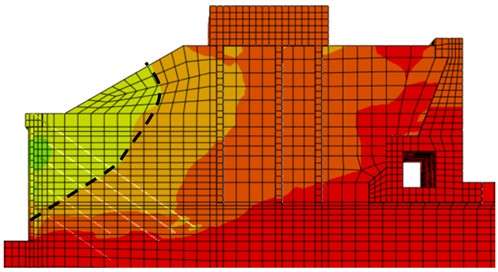

Fig. 27Cloud map representing soil displacement in the X direction (d= 2.0 m)
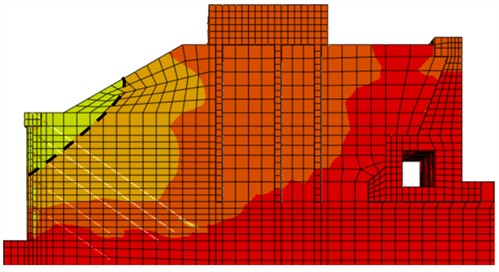

The displacement boundary line of 1.01×10⁻² m is obvious, and is therefore selected as the research object. From Fig. 23 and Fig. 24, it can be seen that the typical sliding surface morphology of the soil after the pile with a diameter of 1.0 and 1.2 m is a curve that starts from the heel of the wall and ends at the surface of the fill soil, satisfying the semi-infinite soil failure. From Fig. 25, it can be seen that the typical sliding surface morphology of active deformation of the soil behind the pile with a diameter of 1.5 m starts from the heel of the wall, turns back to the adjacent building foundation, and ends at the surface of the fill soil, the turning point is located at the foundation pit height of 0.74, which belongs to finite soil failure. From Fig. 26 and Fig. 27, it can be seen that the typical sliding surface morphology of active deformation of soil behind piles with a diameter of 1.8 m and 2.0 m is a curve or broken line that starts from 0.2 and 0.6 on the wall and ends at the surface of the fill soil, which belongs to finite soil failure. The 1.0 m, 1.2 m sliding surface start is located at the wall heel, the 1.5 m sliding surface start point is located at the wall heel, but the slope inclination of sliding surfaces increases sharply, the 1.8 m sliding surface start point is 0.2 higher than the wall heel, and the 2.0 m sliding surface start point is 0.6 than the wall heel. As the pile diameter increases, the active failure mode changes from semi-infinite soil to finite soil, and 1.5 m is the critical pile diameter value for finite soil.
Due to the deformation limitations of adjacent buildings outside the foundation pit, and taking into account internal factors such as horizontal displacement of the pile body, bending moment of the pile body, surface settlement, and uplift of the pit bottom, the optimal choice for the engineering case in this article is a pile diameter of 1.5 m.
6. Conclusions
The reasonable selection of foundation pit support schemes is critical to the safety and stability of foundation pit and adjacent buildings. To address design challenges associated with deep foundation pit support under complex conditions; this study uses an independently developed pile-anchor support model device to conduct model tests to verify the numerical model’s reliability. For the actual engineering case on a deep foundation pit of a three-line ship lock on the Xiangjiang River, the internal force and deformation characteristics of the pile-anchor support system of the deep foundation pit with pile diameters of 1.0 m 2.0 m were studied. The main conclusions are shown as follows:
1) The horizontal displacement curve of the pile body shows a “bulging belly” shape with small upper and lower parts and large middle parts, and the curvature of the displacement curve decreases with the increase of the pile diameter. When the diameter of the pile changes from 1m to 2 m, the extreme horizontal displacement of the pile body decreases from 39.79 mm to 10.63mm, and the burial depth of the displacement extreme point decreases from 9.03 m to 4.01 m, located between 0.47-0.21 of the foundation pit.
2) As the pile diameter increases from 1.0 m to 2.0 m, the bending moment of the pile body increases. Meanwhile, the positional changes of the extreme points of positive and negative bending moments remain relatively small. Specifically, the extreme value of the negative bending moment of the pile body increased from 1590 kN·m to 3130 kN·m, with the burial depth of its extreme point decreasing slightly from 11.63 m to 10.66 m, positioned between 0.61 and 0.56 of the foundation pit. Additionally, the extreme value of the positive bending moment of the pile body increased from 2730 kN·m to 10180 kN·m, and the burial depth of its extreme point increased slightly from 19.33 m to 19.81 m, located near the bottom of the foundation pit (–0.01 to –0.03).
3) As the pile diameter increases from 1.0 m to 2.0 m, the surface settlement reduces from 12.62 mm to 4.02 mm, and the tangent inclination angle of the curve gradually diminishes. For various pile diameters, the maximum surface settlement values after the completion of foundation pit excavation are all less than 47.75 mm.
4) As the pile diameter increases from 1.0 m to 2.0 m, the uplift curves at the bottom of pits with varying pile diameters basically overlap. The data exhibit a consistent trend of initially decreasing and subsequently increasing, forming a “hook” shaped curve. The influence of pile diameter on the bottom uplift of the pit is relatively minor.
5) As the pile diameter increases from 1.0 m to 2.0 m, the inclination of the ship lock control building roof gradually decreases from 0.0027 to 0.0009. Both values are significantly smaller than the allowable inclination limit of 0.004 specified in the “Code for Design of Building Foundation” (GB 50007-2011); the average vertical displacement of the gate chamber foundation correspondingly increases from 0.19 mm to 0.59 mm. Both values remain significantly smaller than the allowable average settlement limit of 200 mm specified in the “Code for Design of Building Foundation” (GB 50007-2011).
6) As the pile diameter increases from 1.0 m to 2.0 m, the active failure deformation transitions from semi-infinite soil to finite soil. A pile diameter of 1.5 m serves as the critical value for finite soil condition. Based on the economic objective, the pile-anchor support system for deep foundation pit was optimized and designed, with a pile diameter of 1.5 meters determined to be the optimal choice.
7) This paper aims to study the influence of pile diameter on the deformation of finite soil body behind piles in the pile-anchor support system for deep foundation pit. The active deformation sliding surface of finite soil behind piles is a curve or polyline that is higher than the heel of the wall and returns to the adjacent buildings. In engineering practice, many factors such as pile spacing, anchor cables, depth of foundation pit, external load, and geotechnical conditions all affect the deformation of deep foundation pits. The impact of multiple complex influencing factors on the deformation of finite soil body behind piles in the pile-anchor support system for deep foundation pit is the direction of further research.
References
-
M. Zhang, C. B. Ai, and H. Q. Guo, “Study of calculation method of bending moments of pile body of pile-anchor support structure based on horizontal displacement inverse calculation method,” (in Chinese), Journal of China Three Gorges University (Natural Sciences), Vol. 39, No. 5, pp. 69–73, 2017.
-
S. L. Liao, “Design and application of the retaining and protection for deep foundation excavation,” (in Chinese), Central South University, 2013.
-
P. P. Wang, “Analysis of mechanical properties on double pile-anchor supporting structure,” (in Chinese), Hebei University of Engineering, 2011.
-
Y. Q. Ling, “Research on stability and displacement and their relationship considering the anchor prestress of pile anchor retaining structure in deep foundation pit,” (in Chinese), Lanzhou University of Technology, 2017.
-
H. Lingjie, Z. Shihao, and T. Huarui, “Force calculation of mechanical model of pile-anchored support structure based on elastic foundation beam method,” European Journal of Computational Mechanics, Vol. 32, No. 2, pp. 183–210, Jul. 2023, https://doi.org/10.13052/ejcm2642-2085.3224
-
Y.-Q. Ling, L. Song, J. Hao, X.-L. Cao, and X.-H. Yang, “Analytical analysis for horizontal displacement of pile anchor support structure considering prestress,” Frontiers in Ecology and Evolution, Vol. 11, No. 1, pp. 1–8, Sep. 2023, https://doi.org/10.3389/fevo.2023.1249239
-
Q. Yin, H. Fu, and Y. Zhou, “Spatial deformation calculation and parameter analysis of pile-anchor retaining structure,” Applied Sciences, Vol. 13, No. 11, p. 6637, May 2023, https://doi.org/10.3390/app13116637
-
C. Liang, “Calculation and engineering application of pile-anchor support structures for buildings with adjacent group pile foundations,” (in Chinese), Hunan University, 2023.
-
M. Ding and Y. X. Zhang, “Analysis method for pile-anchor retaining structures based on the displacement matrix method,” (in Chinese), Engineering Mechanics, Vol. 29, No. 8, pp. 116–122, 2012.
-
X. X. Meng, “Field test and numerical simulation research on double row pile-anchor support structure of deep foundation pit,” (in Chinese), Shandong Jianzhu University, 2022.
-
H. Y. Yu, “Research on deformation monitoring and numerical simulation of soil nail wall pile anchor support in deep foundation pit,” (in Chinese), Lanzhou University of Technology, 2016.
-
J. C. Gao, “Research on mechanical behavior of pre-stressed anchor flexible retaining structures based on centrifuge modeling test,” (in Chinese), Dalian University of Technology, 2018.
-
Q. Zhang et al., “Study on the mechanical behavior of a foundation pit retaining structure adjacent to the pile foundation of a subway station,” Environmental Earth Sciences, Vol. 80, No. 20, pp. 1–10, Oct. 2021, https://doi.org/10.1007/s12665-021-09996-7
-
C. J. Xie, J. Y. Rao, D. K. Liu, and C. X. Nie, “Experimental study on flexural capacity of micro-piles with different pile cores,” (in Chinese), Journal of Disaster Prevention and Mitigation Engineering, Vol. 41, No. 3, pp. 540–548, 2021.
-
X. Xue and G. Zhang, “Centrifuge model test study on pile-anchor support system,” Soils and Foundations, Vol. 65, No. 1, p. 101561, Feb. 2025, https://doi.org/10.1016/j.sandf.2024.101561
-
W. Zhao et al., “A numerical study on the influence of anchorage failure for a deep excavation retained by anchored pile walls,” Advances in Mechanical Engineering, Vol. 10, No. 2, pp. 1–17, Feb. 2018, https://doi.org/10.1177/1687814018756775
-
T. Ma, Y. Zhu, and S. Ye, “Simplified calculation method and stability analysis of top beam cooperative pile-anchor supporting slope structure,” Frontiers in Materials, Vol. 9, No. 1, pp. 1–14, Sep. 2022, https://doi.org/10.3389/fmats.2022.988455
-
X. Yin and H. Ni, “Displacement analysis and numerical simulation of pile-anchor retaining structure in deep foundation pit,” Journal of Measurements in Engineering, Vol. 12, No. 1, pp. 124–137, Mar. 2024, https://doi.org/10.21595/jme.2023.23635
-
G. Cui, S. Ma, Z. Liu, S. Liu, C. Xi, and Z. Cheng, “Effect of freeze-thaw cycles on deformation properties of deep foundation pit supported by pile-anchor in Harbin,” REVIEWS ON ADVANCED MATERIALS SCIENCE, Vol. 61, No. 1, pp. 756–768, Oct. 2022, https://doi.org/10.1515/rams-2022-0266
-
W. Liu, T. Li, and J. Wan, “Deformation characteristic of a supported deep excavation system: a case study in red sandstone stratum,” Applied Sciences, Vol. 12, No. 1, p. 129, Dec. 2021, https://doi.org/10.3390/app12010129
-
F. Salas, E. Sáez, C. Ovalle, and J. M. Fernández, “Dynamic analysis of a deep excavation supported by anchored piles in Santiago gravel,” (in Spanish), Obras y Proyectos, Vol. 25, pp. 76–82, Jun. 2019, https://doi.org/10.4067/s0718-28132019000100076
-
Z. R. Liu, H. B. Qiu, and M. Q. Peng, “Study of seepage and stability of foundation pit under continuous rainy conditions,” Applied Mechanics and Materials, Vol. 501-504, No. 1, pp. 83–87, Jan. 2014, https://doi.org/10.4028/www.scientific.net/amm.501-504.83
-
L. Yu, Y. Zhang, W. Y. Wang, Z. H. Han, and T. Zhao, “Stress and deformation analysis of assembled recoverable support and pile anchor support structure in foundation pit,” (in Chinese), Journal of Jilin University (Earth Science Edition), Vol. 51, No. 6, pp. 1789–1800, 2021.
-
K. Kang, N. Li, W. Shi, T. X. Tan, and S. J. Wang, “Stability analysis of deep foundation pit excavation on adjacent buildings,” (in Chinese), Geotechnical Engineering Technique, Vol. 39, No. 1, pp. 89–96, 2025.
-
H. T. Li and L. C. Zhou, “Numerical simulation and analysis of double row pile anchor composite support structure based on FLAC3D,” Journal of Progress in Civil Engineering, Vol. 5, No. 8, pp. 45–48, Aug. 2023, https://doi.org/10.53469/jpce.2023.05(08).07
-
Y. Sun and Z. Li, “Analysis of deep foundation pit pile-anchor supporting system based on FLAC3D,” Geofluids, Vol. 2022, No. 1, pp. 1–19, Aug. 2022, https://doi.org/10.1155/2022/1699292
-
A. Chen, Q. Wang, Z. Chen, J. Chen, Z. Chen, and J. Yang, “Investigating pile anchor support system for deep foundation pit in a congested area of Changchun,” Bulletin of Engineering Geology and the Environment, Vol. 80, No. 2, pp. 1125–1136, Oct. 2020, https://doi.org/10.1007/s10064-020-01985-7
-
“Technical standard for monitoring of building excavation engineering,” GB50497-2019, China Architecture and Building Press, Beijing, 2019.
-
“Technical specification for retaining and protection of building foundation excavations,” JGJ120-2012, China Architecture and Building Press, Beijing, 2012.
-
“Code for design of building foundation,” GB50007-2011, China Architecture and Building Press, Beijing.
-
X. Liu, Y. Wang, Y. Zeng, Y. Ye, Y. Liu, and H. Cai, “The critical width-height ratio of finite soil behind retaining wall considering the compaction degree of fill under RB mode,” Journal of Measurements in Engineering, Vol. 13, No. 2, pp. 344–361, Jun. 2025, https://doi.org/10.21595/jme.2024.24457
-
X. H. Liu, Y. C. Liu, Z. F. Liu, Y. Q. Zeng, Y. X. Wang, and S. X. Liu, “Study on the influence of compaction degree of fill behind the retaining wall to the critical width-height ratio of finite soil in active failure under TT mode,” Engineering Letters, Vol. 33, No. 4, pp. 1145–1156, 2025.
About this article

The study was supported by the Natural Science Foundation of Hunan Province of China (Grant No. 2022JJ40160), the Key Scientific Program of Hunan Education Department, China (Grant No. 22A0472), the Postgraduate Scientific Research Innovation Project of Hunan Province, China (Grant No. CX20231231), and The school-enterprise research and development project of Yueyang Planning, Survey and Design Institute Co., Ltd. of Hunan Province (No. 2024430607002014), and The school-enterprise research and development project of Yueyang Baili Surveying and Mapping Technology Co., Ltd. (No. 2025430607000446).
The datasets generated during and/or analyzed during the current study are available from the corresponding author on reasonable request.
Sanxian Liu, Yuchen Liu and Yongqing Zeng contributed to Conceptualization, Data Curation, Data Analysis and wrote the Original Draft Preparation of the study. Zhengfu Liu and Zuhui Long contributed significantly to Funding Acquisition, Investigation and Methodology. Qiang Yin and Xiaohong Liu helped perform Review and Editing with constructive discussions.
The authors declare that they have no conflict of interest.
