Abstract
There are deficiencies in the optimization of the seismic performance of high-rise building shear walls, such as weak integrity and collapse resistance. Aiming at this problem, this study innovatively combines the partial replacement of concrete and steel pipe reinforcement technology, and proposes a method of locally adding steel pipe reinforcement shear walls. The experimental results showed that the specimens reinforced by the studied method exhibited better ductility and toughness when subjected to a vertical load of 840.84 kN as compared to the low-strength concrete specimens that were not reinforced by the studied method. The overall structure of the wall was able to maintain its load-bearing capacity despite the fact that the concrete at its base also suffered from crushing and spalling. In addition, the cracking displacement of the specimens (JGC-2, JGC-4, JGC-6) with localized steel pipe reinforcement was only 3.0 mm, 2.1 mm, 2.4 mm, respectively. The limit displacement was only 27.0 mm, 24.0 mm, 25.0 mm, and 45.0 mm, 47.0 mm, and 36.0 mm, respectively. The destructive displacement was only 45.0 mm, 47.0 mm, and 36.0 mm. The superiority of partial replacement of concrete and steel pipe reinforcement in improving the performance of high-rise building shear wall structures was further confirmed. It can be concluded that the research method can not only provide new ideas for the seismic strengthening of existing high-rise buildings, but also is expected to play an important role in a wider range of engineering applications. In turn, this will contribute to the improvement of the seismic performance of high-rise building structures and the protection of people's lives and property safety.
Highlights
- Based on the stress differences in different sections of the shear wall, a design strategy of strengthening the performance of weak areas through local concrete replacement was proposed, constructing a more reasonable load-bearing capacity distribution system.
- A composite reinforcement method using steel pipes at the ends of the local replacement zone was proposed. This improved the shear wall's ductility, hysteresis, and deformation coordination under high axial compression and cyclic loading.
- Under the same vertical load, a comparative test of 12 scaled specimens verified the significant advantages of the proposed composite reinforcement system in key seismic performance indicators, such as cracking, ultimate, and failure displacement.
1. Introduction
High-rise concrete casting has grown in popularity in tandem with the building industry's explosive growth and the ongoing expansion of public demand. It can not only effectively alleviate the problem of land resource tension in the process of urbanization and realize the efficient use of land. Meanwhile, it can also significantly enhance the durability and fire resistance of the building, so as to meet people’s high standard requirements for housing [1]. However, the high requirements for vertical and horizontal loads in the structure of the high-rise building (HRB) itself have led to challenges in the seismic design of the building. Furthermore, the total seismic performance (SP) of HRBs can be greatly impacted by the bearing performance of shear walls, which are a crucial lateral force-resisting component in HRBs [2]. In earthquake-prone areas, how to enhance the SP of HRB shear walls has become a hot issue of concern for many researchers at home and abroad. At this stage, the optimization of the SP of HRB shear walls is mainly focused on shear wall replacement reinforcement and steel pipe shear wall replacement reinforcement.
Firstly, for the problem of shear wall replacement reinforcement, Tang L. et al. compared the performance of cast-in-place (CIP) shear wall specimens (SWSs) with that of precast concrete (PC) specimens reinforced with helical tendons through low-cycle reverse loading tests and finite element analysis (FEA) methods. The experimental results indicated that the stiffness degradation performance of the PC specimens reinforced with helical hoop replacement was comparable to that of the CIP specimens after entering the elastic-plastic stage. In the yield stage, the maximum difference in energy dissipation performance between the spiral hoop replacement reinforced PC specimens and the CIP specimens did not exceed 11.34 % [3]. For unsupported roof slabs, Liu Y. et al. suggested a local reinforcement replacement technique. They also built 18 sets of shear wall models using VFEAP FEA software to examine how the bearing performance of shear walls changed before and after the local reinforcement replacement technique. The outcomes indicated that the method proposed by the research team was less discrete and more robust than the traditional reinforcement method [4]. To enhance the SP of concrete shear walls (CSW), Gao et al. reinforced CSWs with carbon fiber reinforced polymer (CFRP) mesh reinforcement, and established the corresponding strength calculation method and numerical model. The experimental results indicated that the method could significantly improve the safety and reliability of HRB structures [5].
Then, Zhang et al. employed optimized steel pipe reinforced concrete for steel pipe shear wall reinforcement in an effort to lower the quantity of steel reinforcement needed and improve the damage tolerance of reinforced CSWs with squatting openings. They also examined the concrete’s SP using cyclic loading tests. According to the experimental findings, by delaying and reducing damage, steel pipe reinforcement (SPR) might significantly increase the shear wall's capacity to deform and dissipate energy. Furthermore, it could partially replace steel reinforcement [6]. Katrangi et al. proposed an innovative low-damage self-centering composite steel pipe (LDSCCSP) shear wall for the problem of regional damage and high residual drift in the plastic zone of composite shear walls in practical applications. In comparison to the composite steel plate shear wall, the experimental results demonstrated that the shear wall constructed utilizing the investigated method provided more superior performance in terms of transverse strength and ductility with less damage [7]. Dou et al. proposed a new composite concrete filled steel tube reinforced CSW-concrete filled steel tube (CCRCSW-CFST). The experimental results demonstrated that the SP of CCRCSW-CFST was superior to that of the conventional steel-reinforced concrete reinforced shear wall, with a 14.2 % increase in ductility and a 47.5 % increase in energy dissipation capacity [8].
In summary, at this stage, domestic and foreign researchers have made significant progress in optimizing the SP of HRB shear walls. The main techniques include spiral hoop replacement reinforcement, unsupported top plate local reinforcement replacement, CFRP mesh reinforcement and LDSCCSP reinforcement technology. These methods are great for increasing seismic capacity, optimizing design, and improving structural performance of shear walls. However, they have drawbacks, including high risk, a high workload, lengthy reinforcing cycles, poor integrity and collapse resistance of shear wall parts. Therefore, the study innovatively combines the localized concrete replacement reinforcement technique with the end-addition steel pipe reinforced concrete technique and proposes a method of localized additional SPR for shear walls. Through this novel method, the study aims to further enhance the SP of HRB shear walls, reduce earthquake-induced damages, and provide a reference for enhancing the rapid recovery capability of HRBs after an earthquake.
The main innovations and contributions of this study are as follows: (1) This study proposes a design strategy based on the differentiated stress characteristics across various regions of shear walls. This strategy enhances the performance of weak zones through localized concrete replacement, thereby establishing a more rational distribution of load-bearing capacity. This approach effectively mitigates the issues of insufficient global integrity and localized brittle failure that are commonly observed in conventional shear walls due to uneven stress distribution. It offers a new pathway for optimizing the performance of HRBs. (2) A composite strengthening method incorporating steel tubes at the ends of the locally replaced regions is introduced. This method significantly improves the ductility, hysteretic behavior, and deformation compatibility of shear walls under high axial loads and cyclic lateral loading by enhancing the confinement and flexural stiffness of the boundary elements. (3) Systematic comparative tests on twelve scaled specimens were conducted under identical vertical loading conditions. These tests comprehensively verified the superior SP of the proposed composite strengthening system, particularly with regard to cracking displacement, ultimate displacement, and failure displacement.
2. Methods and materials
2.1. Design of test program based on partial replacement of concrete with SPR
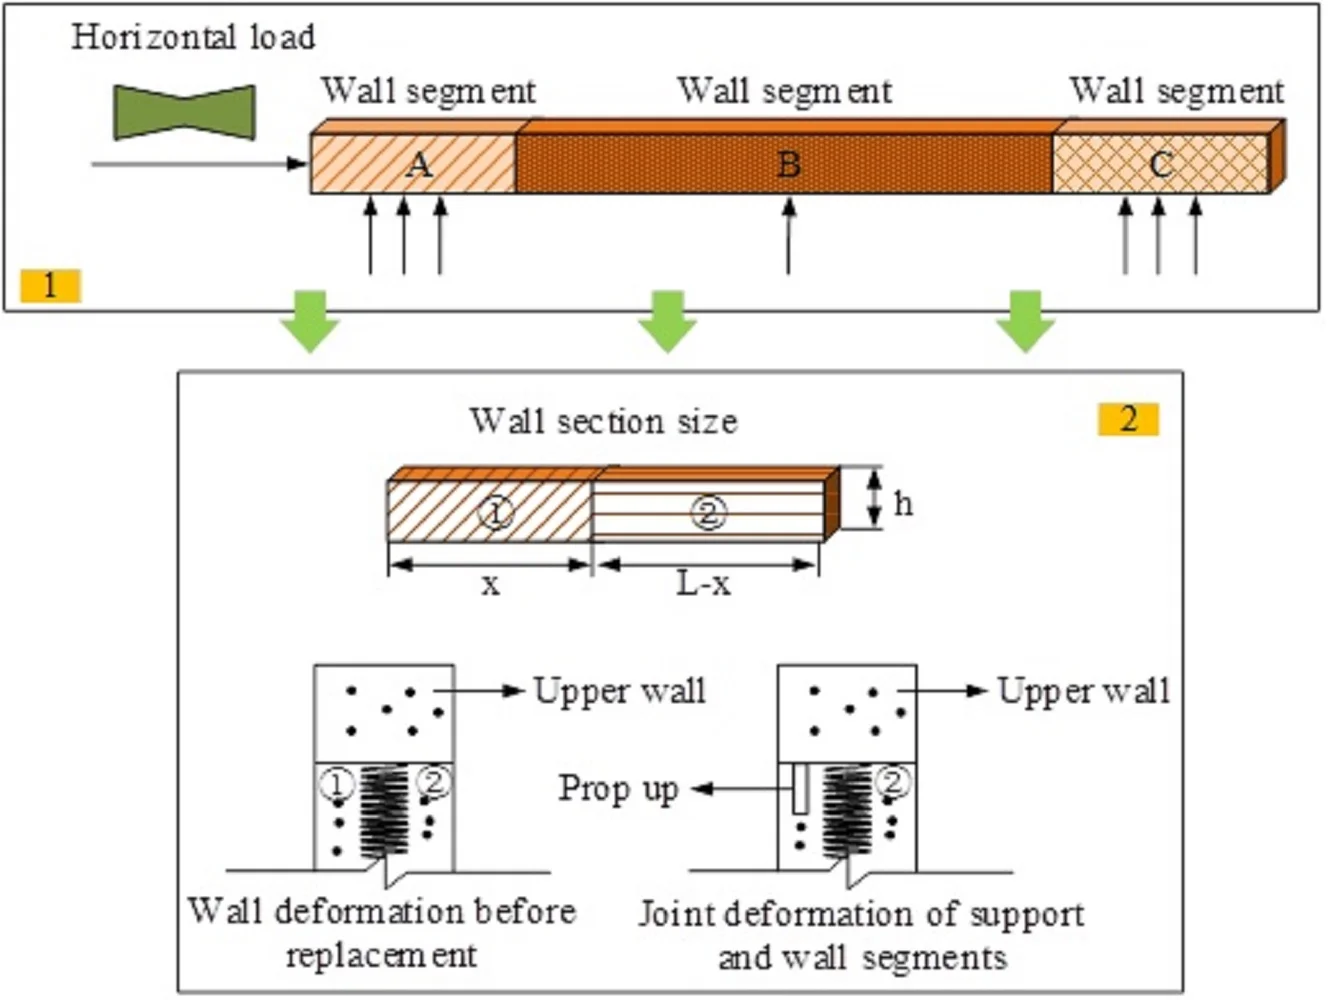
At present, the commonly used methods for seismic strengthening of shear walls in HRBs mainly include the section enlargement strengthening method, the adhesive steel plate strengthening method, and the replacement concrete strengthening method [9-10]. Among them, the local replacement reinforcement method in the replacement concrete reinforcement method is a kind of reinforcement method that can restore or even enhance the original design bearing capacity by replacing or reinforcing the weak links in the structure [11]. This method is especially suitable for concrete structures and has the advantages of no additional support, convenient construction and higher safety [12]. Therefore, the partial replacement of concrete method is chosen to design the test elements of shear walls for HRBs. The schematic diagram of partially replaced shear walls structure is shown in Fig. 1.
Fig. 1Partially replaced shear walls
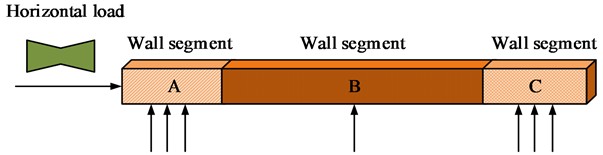
In Fig. 1, the study divides the partially replaced shear walls into three different zones (A, B, and C). Under horizontal loading, the compressive stresses at the end of the wall (A and C) are relatively large, while the compressive stresses in the middle zone (B) are relatively small. When the difference in axial compression ratios (ACRs) of shear walls is small, only the end zones can be replaced. For the end segments that need to be replaced, reinforcement measures should be taken, such as upgrading the strength grade (SG) of concrete, increasing the number of hoops restraining the end columns, or installing steel sections for reinforcement. Shear wall end addition SPR technology is a kind of method that can enhance the integrity and bearing capacity of the structure itself by adding steel pipes at the end of the shear wall. It can not only increase the section modulus of the wall to improve the bending capacity, but also provide additional shear resistance to reduce the deformation of the shear wall when it is subjected to shear force [13]. Therefore, using ABAQUS FEA software, the study suggests a new optimization approach for the SP of HRB shear walls by combining the partial replacement of concrete with the technique of inserting SPR at the end of the shear wall. During the test, the study mainly simulates the seismic action by maintaining the vertical load unchanged, while the application of the horizontal load is accomplished by the MTS hydraulic servo system. It is assumed that the shear wall to be replaced is still in the elastic deformation stage, and the upper shear wall can be regarded as a rigid body, and the SPR support is also kept in the elastic deformation state. Under this condition, a uniformly stressed wall can be divided into two sequential replacement wall segments. The specific wall cross-section dimensions and force conditions are shown in Fig. 2.
In Fig. 2, the increase in strain in wall segment (2) leads to an increase in the internal force it bears, which in turn shares more of the internal force transmitted from the upper wall. Thus, the internal force of the bracing device decreases accordingly, which is lower than the unloading amount obtained from the theoretical calculation (TC). Consequently, during the segmental replacement of a shear wall, the stress of the first wall section to be replaced should be greater than the TC value, and the stress of the subsequent wall section to be replaced should be lower than the TC value.
Fig. 2Schematic diagram of wall cross-section dimensions
Meanwhile, to ensure structural safety and construction efficiency, the replacement of shear walls should not exceed two batches. In addition, the specific effects of various axial pressure ratios on the performance of shear walls must be considered comprehensively in the test process. The expression for the calculation of axial pressure ratio is shown in Eq. (1):
where, is the design value of axial pressure of SWS. and represent the design value of concrete compressive strength (CS) of specimen and the full cross-sectional area (CSA) of wall limb, respectively. If the axial pressure ratio of shear wall is calculated according to the combined section, the formula of is shown in Eq. (2):
where, and represent the CSA of concrete in the non-replaced area and the CSA of concrete in the replacement area, respectively. and represent the design value of CS of concrete in the non-replacement area and the design value of CS of concrete in the replacement area, respectively. The TC formula for ACR replacement reinforcement is shown in Eq. (3):
where, and represent the length of the original wall and the total length of the wall in the two replacement areas, respectively. and represent the cubic CS and the original cubic CS, respectively. represents the cubic CS after replacement.
2.2. Preparation of test elements for shear walls in high-rise buildings
A test program based on partial replacement of concrete with SPR provides the basis for the preparation of test specimens for shear walls of HRBs. A total of 12 CIP SWSs are prepared according to the proposed test program. The 12 CIP SWSs are divided into 3 groups, each containing 4 specimens. Table 1 displays the specimen parameters.
Table 1Specimen parameters
Groups | Specimen number | Strength class of component concrete | Vertical load / kN | Axial pressure ratio | Note |
1 | GC15-1 | C15 | 360.36 | 0.30 | – |
GC30-1 | C30 | 360.36 | 0.15 | – | |
JGC-1 | C30+C15 | 360.36 | – | 200 mm C50 at both ends | |
JGC-2 | C30+Q235B+C15 | 360.36 | – | 200 mm C50 at both ends | |
2 | GC15-2 | C15 | 600.60 | 0.50 | – |
GC30-2 | C30 | 600.60 | 0.25 | – | |
JGC-3 | C30+C15 | 600.60 | – | 200 mm C50 at both ends | |
JGC-4 | C30+Q235B+C15 | 600.60 | – | 200 mm C50 at both ends | |
3 | GC15-3 | C15 | 840.84 | 0.70 | – |
GC30-3 | C30 | 840.84 | 0.35 | – | |
JGC-5 | C30+C15 | 840.84 | – | 200 mm C50 at both ends | |
JGC-6 | C30+Q235B+C15 | 840.84 | – | 200 mm C50 at both ends |
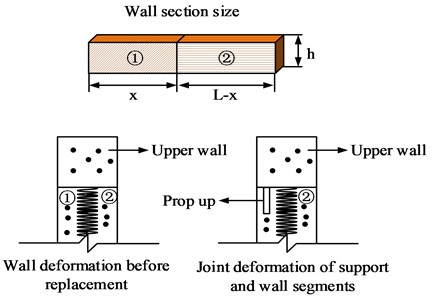
In Table 1, the three groups of SWS are subjected to vertical loads of 360.36 kN, 600.6 kN, and 840.84 kN, respectively, during the tests. These vertical loads correspond to ACRs of 0.15, 0.25, and 0.35 for the C30 SWS, respectively. The ACRs are determined on the basis of concrete specimens with a design SG of C30. When the actual SG of concrete is reduced to C15, the corresponding ACRs applied to the C15 SG concrete specimens can be deduced to be 0.3, 0.5, and 0.7, respectively, by using Eq. (1) [14-15]. The specific size of SWS is 2600 mm×1200 mm and the thickness of SWS is 150 mm. The cross sectional size of floor beam and the cross sectional size of girder are 500 mm×800 mm and 180 mm×300 mm respectively. The longitudinal reinforcement (LR) of header beam and hoop reinforcement are 4C14 and C8@150 respectively. The floor beam is 6C25 LR and C10@100 hoop reinforcement. The top beam and floor beam are all made of C30 concrete. The construction drawings of shear walls with specimen numbers GC & JGC (2, 4, 6) are shown in Figs. 3-4.
The specific process of SWS fabrication is as follows. Firstly, according to Figs. 3-4, 12 shear walls are processed with reinforcement skeleton tying and 60 mm×60 mm×4 mm Q345 square steel pipes are pre-buried in them, so as to lay a foundation for the subsequent concrete pouring. Next, concrete pouring and floor beam supporting work are carried out to ensure the structural integrity of the floor beam. After 28 days of curing of the floor beam concrete, the test piece wall supporting operation is carried out. For the whole casting specimen without concrete replacement, the one-time mold supporting method is adopted to support the mold. As for the wall that needs SPR and localized replacement, the second support is used to support the mold. After completing the above steps, the second batch of support molding for the replacement area is continued, and the pouring operation is started after the wall and roof beam support work is completed. Grout is first injected into the square steel pipe to enhance the bond between the steel pipe and the concrete. Subsequently, the concrete pouring in the replacement area is carried out. After the pouring is completed, the concrete is cured for one day to promote the early hardening of the concrete. Finally, 12 SWSs are demolded and cured under the same conditions for 28 days. Thus, three sets of CIP SWSs in Table 1 are successfully produced.
2.3. ABAQUS finite element model
After preparing the test components of shear walls for HRBs, it is also necessary to evaluate their mechanical property indexes. The study mainly adopts a staged modeling approach, in which concrete and steel reinforcement are first modeled separately using different types of units. Subsequently, the concrete and reinforcing steel models are combined as a whole by ABAQUS finite element (FE) software. The bifold model and the concrete damage plasticity (CDP) model in ABAQUS FE software can simulate the intricate mechanical behaviors of reinforcing steel and concrete by establishing the damage parameters and stress-strain (SS) relationship of concrete [16-17]. To explain the mechanical behavior of the concrete and steel reinforcement in the prepared SWS, the CDP model and the bifold model are selected. Table 2 displays the inputs for the CDP model as well as the mechanical property indices of the steel reinforcement and concrete materials used in the study.
Fig. 3Construction drawings for shear walls with specimen number GC
Fig. 4Shear wall construction drawing with specimen number JGC
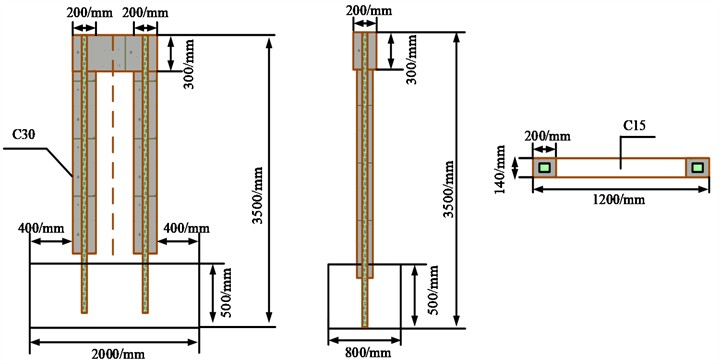
Table 2Mechanical performance indicators and inputs to the CDP model
Typology | Cubic compressive strength / MPa | Densities / t/mm3 | Modulus of elasticity / MPa | Poisson’s ratio |
Concrete | 16.86 | 23485 | ||
35.59 | 2.5×10⁻⁹ | 31496 | 0.2 | |
45.24 | 33704 | |||
Expansion angle | Eccentricity | Viscosity parameters | Plasticity | |
30 | 0.1 | 0.005 | 0.667 | |
Steel reinforcing bar | Rebar diameter/mm | Densities / t/mm3 | Modulus of elasticity / MPa | Poisson’s ratio |
8 | 7.85×10⁻⁹ | 200000 | 0.3 | |
10 | ||||
12 |
In Table 2, concrete can produce cracks, damage and plastic deformation when subjected to forces [18]. In addition, in the event of events like earthquakes, damage to plastic can significantly impact SP. Therefore, the study defines the tensile and compressive plastic damage in the hysteresis curve of reinforced concrete based on the Code for the Design of Concrete Structures (GB50010-2010). The expression for stress calculation of concrete under compression is shown in Eq. (4):
where, and represent the uniaxial compressive damage evolution parameters and modulus of elasticity (MOE) of concrete, respectively. represents the strain of concrete. computational expression is shown in Eq. (5):
where, represents the reference value of the descending section of the uniaxial compression SS curve of concrete. and represent the SS ratio of concrete and the SS ratio of concrete after entering the plastic state, respectively. represents the height of concrete compression zone (CZ). The expression for calculation is shown in Eq. (6):
where, and represent the representative uniaxial CS of concrete and the corresponding peak strain, respectively. The expression for calculation is shown in Eq. (7):
where, the algebraic meaning is the same as before. The SS relationship for the bifold model is shown in Eq. (8):
where, and represent the MOE of the reinforcement and the reinforcement strain, respectively. and represent the representative values of the yield strength of the reinforcement and the slope strain of the hardened section of the reinforcement, respectively. represents the reinforcement yield strain corresponding to . The cross-section equivalent CZ height is calculated as shown in Eq. (9):
where, represents the width of the rectangular section. and represent the distance from the longitudinal tension point to the edge of the CZ and the design value of the tensile strength of the vertically distributed reinforcement (VDR), respectively. represents the CSA of VDR in shear wall. The design value of positive section compressive bearing capacity is calculated as shown in Eq. (10):
where, and represent the design value of CS of LR in the CZ and the CSA of LR, respectively. represents the distance from the combined point of LR to the near side of the section. According to the specification of Building Seismic Testing Regulations, the specimen cut line stiffness calculation formula is shown in Eq. (11):
where, represents the cyclic equivalent stiffness. and represent the cyclic forward/reverse peak load (PL) values, respectively. and represent the cyclic forward/reverse peak displacement values, respectively.
3. Results
3.1. Analysis of damage patterns of shear wall specimen
The study first analyzes the test damage states and phenomena of 12 SWSs based on the data in Table 1. Table 3 displays all SWS damage patterns as a function of loads.
Table 3Load test results for each shear wall specimen
Shear wall specimen | Cracking load / kN | Peak load / kN | Destructive load / kN | |||
Push | Pull | Push | Pull | Push | Pull | |
GC15-1 | 80.4 | 71.6 | 210.2 | 221.5 | 173.6 | 198.8 |
GC30-1 | 90.1 | 91.2 | 220.7 | 213.6 | 195.8 | 170.9 |
JGC-1 | 73.3 | 65.8 | 262.4 | 254.3 | 201.6 | 196.4 |
JGC-2 | 61.8 | 52.5 | 276.1 | 268.5 | 223.4 | 211.6 |
GC15-2 | 93.6 | 91.9 | 235.0 | 241.1 | 206.6 | 163.9 |
GC30-2 | 109.5 | 108.0 | 255.9 | 260.5 | 136.4 | 221.3 |
JGC-3 | 82.4 | 86.5 | 278.9 | 254.3 | 159.2 | 232.1 |
JGC-4 | 74.2 | 76.8 | 294.3 | 288.4 | 223.8 | 242.3 |
GC15-3 | 89.1 | 106.6 | 263.4 | 250.9 | 233.8 | 186.1 |
GC30-3 | 115.7 | 134.6 | 291.2 | 308.9 | 227.5 | 281.9 |
JGC-5 | 94.5 | 80.3 | 270.3 | 290.5 | 89.7 | 122.6 |
JGC-6 | 80.2 | 73.8 | 288.8 | 300.2 | 119.4 | 142.6 |
In Table 3, the PLs of low strength specimens (GC15-1~GC15-3), design strength specimens (GC30-1~GC30-3), reinforcement replacement specimens (RRSs) (JGC-1, JGC-3, JGC-5), and steel pipe RRSs (JGC-2, JGC-4, JGC-6) increase with the increase in axial pressure ratio. Among them, the addition of SPR outperforms the rest of the specimens in terms of cracking load, PL, and destructive load. The PL is a measure of the load value when the member reaches its maximum load capacity. The PLs of the steel pipe RRSs (JGC-2, JGC-4, and JGC-6) in the pushing condition reach 276.1 kN, 294.3 kN, and 288.8 kN, respectively. The PLs in the pulling condition reach 268.5 kN, 288.4 kN, and 300.2 kN, respectively. It shows that the steel pipe RRSs can withstand higher loads before reaching the maximum load carrying capacity. By comparing PL and destructive load, the ductility of a member can be evaluated. The more ductile members are still able to withstand a certain amount of load and gradually destroy after reaching PL. Compared with the rest of the specimens, the difference between the destructive load and PL of the steel pipe RRSs (JGC-2, JGC-4, and JGC-6) in the pushing and pulling states is smaller, which indicates that they have better ductility. It can be concluded that the method of localized addition of SPR shear wall proposed by the study not only performs outstandingly in terms of load carrying capacity, but also has significant advantages in terms of structural ductility. Fig. 5 displays the final damage morphology data for GC15-3, JGC-5, and JGC-6 SWS.
Fig. 5Final damage morphology effects of different shear wall specimens: a) GC15-3; b) JGC-5; c) JGC-6. The author took on-site photos at a structural engineering laboratory of a university in Sichuan Province on May 12, 2023
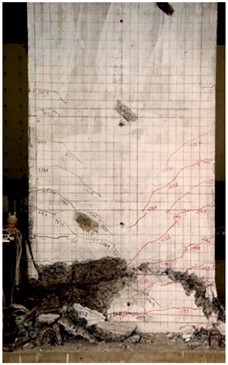
a)
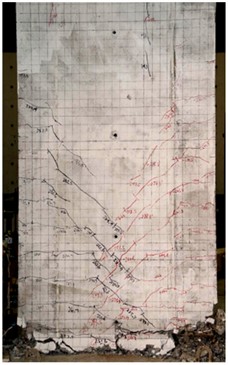
b)
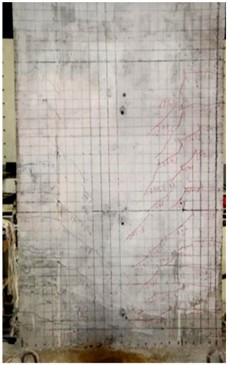
c)
Figs. 5(a-c) show the effect of final damage morphology of GC15-3, JGC-5, and JGC-6 SWS, respectively. The horizontal cracks of the wall in the replacement part of the additional SPR specimen are more widely distributed. During the test, some existing horizontal cracks further develop into diagonal cracks under the action of shear force. Most of these diagonal cracks start from the inner side of the steel pipe. The damage characteristics of all SWSs exhibit crushing of the bottom concrete and yielding of the steel reinforcement. Compared with the unreinforced low-strength concrete specimen GC15-3, the JGC-6 specimen with SPR exhibits better ductility and toughness when subjected to a vertical load of 840.84 kN. The overall structure of the wall is able to maintain its load-bearing capacity despite the fact that the concrete at its base also suffers from crushing and dislodging. This result highlights the significant advantages of the SPR method in improving the structural integrity. Through this reinforcement method, the specimens are able to maintain higher stability and load-bearing capacity when facing extreme loads, thus providing more reliable performance in practical applications. Table 4 displays the results of 12 SWSs’ displacement tests.
Table 4Displacement test results for each shear wall specimen
Shear wall specimen | Cracking displacement / mm | Limit displacement / mm | Destructive displacement / mm | |||
Push | Pull | Push | Pull | Push | Pull | |
GC15-1 | 3.6 | 2.8 | 33.6 | 39.2 | 51.6 | 51.2 |
GC30-1 | 3.6 | 3.2 | 38.8 | 32.2 | 53.3 | 52.6 |
JGC-1 | 3.9 | 3.6 | 36.0 | 40.0 | 60.0 | 60.0 |
JGC-2 | 2.8 | 3.1 | 29.2 | 27.3 | 45.3 | 45.3 |
GC15-2 | 4.4 | 2.7 | 28.9 | 26.5 | 42.8 | 40.9 |
GC30-2 | 4.7 | 4.6 | 35.9 | 35.3 | 49.8 | 49.3 |
JGC-3 | 2.7 | 2.4 | 27.2 | 29.2 | 47.1 | 51.1 |
JGC-4 | 2.7 | 2.1 | 21.0 | 24.0 | 35.0 | 47.0 |
GC15-3 | 3.4 | 3.5 | 25.7 | 21.5 | 33.5 | 31.5 |
GC30-3 | 4.7 | 6.2 | 30.3 | 36.1 | 46.2 | 46.2 |
JGC-5 | 4.2 | 3.6 | 28.0 | 32.0 | 38.0 | 38.0 |
JGC-6 | 2.4 | 2.4 | 23.0 | 25.0 | 36.0 | 36.0 |
In Table 4, the cracking displacement of most SWSs under thrust is less than that under tension, indicating that shear walls are more prone to cracking under thrust. The limit displacement is the final displacement of the specimen before it reaches the maximum load capacity. The JGC series specimens (reinforced specimens) are generally better than the GC series specimens (unreinforced specimens) in terms of cracking displacement, limit displacement, and destructive displacement. This suggests that the SP of shear walls can be successfully increased by both localized replacement reinforcement and localized extra steel pipe reinforcing techniques. Among them, the specimens with partially added SPR (JGC-2, JGC-4, and JGC-6) perform the best. The cracking displacement of JGC-2, JGC-4, and JGC-6 SWS under tension is 3.0 mm, 2.1 mm, and 2.4 mm, respectively. The limit displacement is 27.0 mm, 24.0 mm, and 25.0 mm, respectively. The destructive displacement is 45.0 mm, 47.0 mm and 36.0 mm respectively. This further confirms the superiority of SPR in improving structural performance.
3.2. Finite element parametric analysis
To verify the feasibility of the FE model and testing method, the study constructed a FE model corresponding to the test specimen. Among them, the concrete is modeled using eight-node three-dimensional solid elements (C3D8R), and the reinforcing bars are modeled using three-dimensional beam elements (B31). The coupling between the concrete and the reinforcing bars is achieved through an “embedded region constraint”, which ensures that the two materials work together. In terms of the division of the model mesh, the concrete wall uses a mesh with an average side length of 30 mm. The steel pipe uses a more precise 20 mm mesh to ensure accurate stress transmission between the pipe and the concrete. Before grid division, a grid sensitivity analysis was conducted.
Fig. 6Hysteresis curves for different specimens: a) GC15; b) JGC
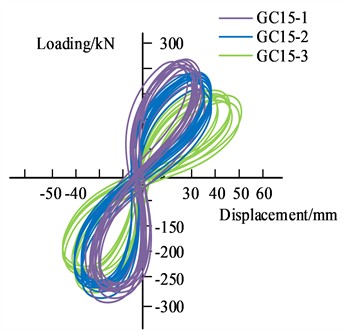
a)
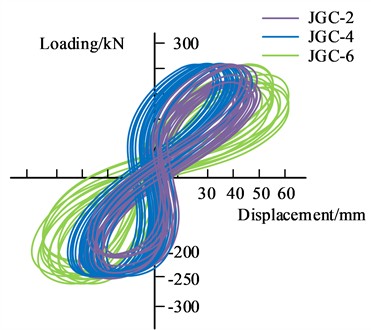
b)
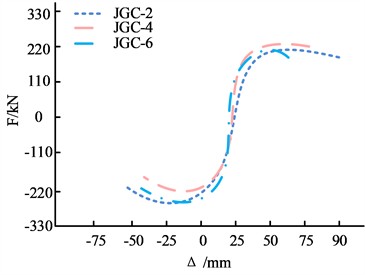
The results shows that when the side length of the concrete grid is less than 30mm, the changes in PL and hysteresis curves are less than 2 %, and it can be considered that the model convergence is reliable. The FEA adopts the static nonlinear analysis (static general step) combined with the load-displacement control method. The horizontal load is simulated by applying the displacement controlled MTS actuator, while the vertical load remains constant. The concrete adopts the plastic damage model (CDP), and the steel bars adopt the double-line model, which can accurately describe the yield hardening characteristics. The displacement convergence is set so that the residual force at each iteration step is less than 1 % of the total reaction force. The convergence of forces necessitates that the force balance error at the node be less than 0.5 %, the initial incremental displacement be 0.1 mm, and the step size be automatically adjusted according to the nonlinear response to ensure the convergence of the calculation. In the analysis, the study defines the thrust force of the horizontal actuator as the positive load, while the tension force is defined as the negative load. When the whole loading process is completed, the hysteresis loops generated by each cycle together constitute the complete hysteresis curve of the shear wall, as shown in Fig. 6.
Figs. 6(a-b) show the hysteresis curves of SWS GC15 series and JGC series under different axial pressure ratios, respectively. Under the same axial pressure ratio, the JGC series specimens have not only larger hysteresis loop area but also more cycles than the GC15 series specimens. In addition, when the specimen reaches the destructive stage, the hysteresis loop area of the JGC series still exceeds that of the GC15-3 specimen, which further confirms the advantage of the reinforcing member in terms of energy consumption. Together, these results indicate that the SPR technique can significantly improve the SP of shear walls and enhance their energy dissipation capacity under seismic actions, thus providing higher safety and reliability for buildings. Fig. 7 displays all of the SWSs’ skeletal curves.
Fig. 7Skeleton curves for different specimens: a) GC15; b) GC30; c) JGC
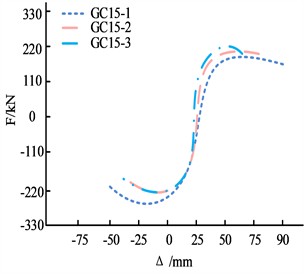
a)
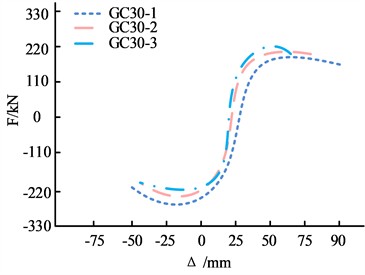
b)
c)
In Fig. 7, the trend of the skeleton curves of GC15, GC30 and JGC series SWS is basically the same, but the JGC series SWS still exceeds the GC15 SWS in all the performance indexes. From this, it can be concluded that the performance indexes of the JGC series SWS not only meets the standard of design strength specimen, but also shows better performance in many aspects. The comparison curves of the destructive displacement of all specimens are shown in Fig. 8.
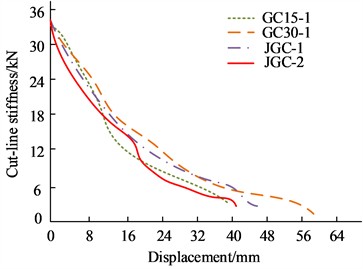
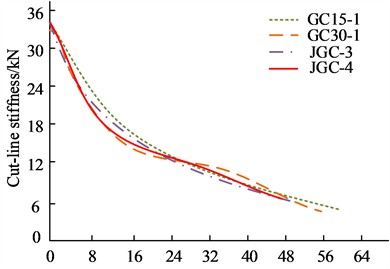
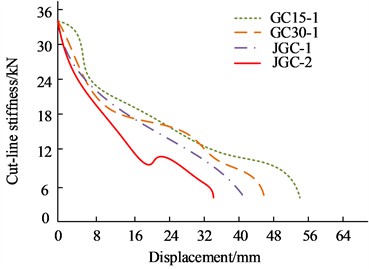
Fig. 8 shows the comparison results of destructive displacement of SWS of Group 1, Group 2, and Group 3, respectively. Under the same ACR condition, the initial stiffness (IS) of the design strength SWS is similar to that of the additional SPRSWS. Compared with the low-strength SWS, the SWS with the addition of SPR exhibits a significant increase in the IS, which is about 15 %, 8 %, and 18 %, respectively. In addition, both low-strength SWS and design-strength SWS shows a trend of gradual decrease in stiffness with the increase of displacement in their cut-line stiffness curves. It is indicated that the decay rate of the stiffness of shear wall members is independent of the vertical compressive stress level.
Fig. 8Comparative stiffness degradation performance curves for all specimens: a) Group 1; b) Group 2; c) Group 3
a)
b)
c)
Although CIP specimens with locally added SPR demonstrates significant improvements in bearing capacity and optimization of hysteresis performance under standard test conditions. However, HRBs are often located under different foundation and site conditions in actual engineering. Different foundation stiffness, settlement patterns, and site types will directly affect the force path, hysteresis characteristics, and damage mode of shear walls, thereby changing their overall SP under seismic action. For this purpose, the proposed optimization method for the SP of shear walls in high-rise buildings is further extended to the shear wall systems of HRBs under different foundation conditions (classes I-IV), and a comprehensive analysis is conducted in combination with the soil-structure interaction (SSI) effect. The equivalent site stiffness (equivalent elastic modulus ) is used to represent different sites. Among them, it includes: for Class I (rock foundation), = 10,000 MPa; Class II (hard soil) = 5000 MPa; Class III (medium soft soil/fill) = 500 MPa; Class IV (soft soil/liquefaction sensitive) = 50 MPa. To accurately reflect the impact of site conditions on the dynamic performance of structures, the study employs a direct coupling method to create an SSI numerical model. In this model, the soil solid element (C3D8R) is used to simulate the foundation, and the soil and base plate of the shear wall are solved together through contact and constraint relationships. The SSI numerical model is verified by comparing it with the hysteresis curve, skeleton curve, and bearing capacity results of the test to ensure the consistency of the simulation results with the test. The test results are shown in Table 5.
In Table 5, as the site stiffness gradually decreases from Class I to Class IV, the interaction effect between the foundation and the structure continuously intensifies. Furthermore, the bearing capacity, hysteresis energy, and deformation capacity of all specimens all show a significant degradation trend. Among them, under the condition of a Class I rock foundation, the peak bearing capacity of the SWSs reaches its maximum due to the foundation's high stiffness and strong bottom constraint. The residual drift and settlement can almost be ignored. The structural response is mainly determined by the performance of the component itself. After entering Class II and Class III sites, the softening effect of SSI causes the PL to decrease by approximately 10 % to 20 % on average. The hysteresis curve shows a more pronounced pinching effect, and the residual drift increases two to threefold. This indicates that foundation deformation significantly contributes to the structure's lateral displacement, resulting in decreased overall stiffness and energy dissipation capacity. In Class IV soft soil or liquefaction-sensitive sites, the decline in bearing capacity is the most significant (up to 30 % or more compared to Class I). Residual drift increases to 5-7 mm, and base settlement exceeds 8 mm. This indicates that intense foundation softening and bottom rotation significantly reduce the hysteresis energy dissipation and failure control capacities of the shear wall system. Under different site conditions, the JGC-2 specimens always exhibit the optimal ductility and hysteresis performance. In Class IV sites, the PL, residual drift and base settlement of JGC-2 are 190 kN±6 kN, 3.6 mm±0.3 mm, and 7.5 mm±0. 5mm, respectively. Compared with the GC15-1 and GC30-1 specimens, the PL of the JGC-2 specimen has increased by 40 %, the residual drift has decreased by more than 30 %, and the base settlement has also decreased by approximately 20 %. This suggests that adding steel pipes locally can effectively delay stiffness degradation caused by SSI, maintaining higher structural stability and seismic reliability under weak foundation conditions.
Table 5The key responses (mean ± standard deviation, n= 3) of CIP specimens under different foundation conditions (classes I to IV)
Site class | Specimen number | Strength class of component concrete | Cracking load / kN | Peak load / kN | Ultimate displacement / mm | Hysteretic energy / kN·mm | Residual drift / mm | Foundation settlement / mm |
Ⅰ | GC15-1 | C15 | 85±3 | 165±5 | 16.2±0.8 | 12500±600 | 1.2±0.1 | 0.3±0.1 |
GC30-1 | C30 | 105±4 | 198±6 | 18.8±0.9 | 15200±700 | 0.9±0.1 | 0.2±0.1 | |
JGC-1 | C30+C15 | 118±4 | 228±7 | 21.5±1.0 | 18900±800 | 0.7±0.1 | 0.2±0.1 | |
JGC-2 | C30+Q235B+C15 | 132±5 | 255±8 | 24.6±1.2 | 22400±900 | 0.5±0.1 | 0.1±0.0 | |
Ⅱ | GC15-1 | C15 | 80±3 | 155±5 | 17.4±0.9 | 11800±650 | 1.8±0.2 | 1.2±0.2 |
GC30-1 | C30 | 101±4 | 186±6 | 19.8±1.0 | 14200±650 | 1.4±0.2 | 1.0±0.2 | |
JGC-1 | C30+C15 | 113±4 | 215±7 | 22.8±1.1 | 14200±650 | 1.1±0.1 | 0.8±0.2 | |
JGC-2 | C30+Q235B+C15 | 125±4 | 240±8 | 25.9±1.2 | 17800±750 | 0.9±0.1 | 0.6±0.1 | |
Ⅲ | GC15-1 | C15 | 68±3 | 138±5 | 20.6±1.2 | 20900±800 | 3.5±0.3 | 4.5±0.4 |
GC30-1 | C30 | 92±4 | 168±6 | 22.9±1.3 | 9800±500 | 2.9±0.3 | 4.0±0.4 | |
JGC-1 | C30+C15 | 103±4 | 195±7 | 25.8±1.4 | 12600±600 | 2.1±0.2 | 3.6±0.3 | |
JGC-2 | C30+Q235B+C15 | 115±4 | 216±7 | 28.4±1.5 | 15800±700 | 1.7±0.2 | 3.2±0.3 | |
Ⅳ | GC15-1 | C15 | 55±2 | 118±4 | 24.5±1.6 | 18200±750 | 6.8±0.5 | 9.5±0.6 |
GC30-1 | C30 | 78±3 | 148±5 | 27.0±1.7 | 7600±450 | 5.2±0.4 | 8.7±0.6 | |
JGC-1 | C30+C15 | 88±3 | 175±6 | 30.2±1.8 | 13100±600 | 4.1±0.3 | 8.1±0.5 | |
JGC-2 | C30+Q235B+C15 | 96±3 | 190±6 | 33.6±1.9 | 14800±650 | 3.6±0.3 | 7.5±0.5 | |
Note: The hysteresis energy is the area of the hysteresis curve of the last stage (close to destruction) cycle. The base settlement is the cumulative maximum settlement observed during the test process. Residual drift is the residual displacement measured after failure | ||||||||
4. Conclusions
Every year, more high-rise shear wall structure homes are being built as a result of the economy’s quick expansion. However, during the construction process, it is inevitable to be interfered by a variety of uncertain factors, which easily leads to frequent structural concrete quality problems. The study suggested a novel way to optimize the SP of shear walls in HRBs by partially replacing the concrete with SPR technology. One of the many causes of these common issues is the failure of the SP of shear walls to match the design criteria. The experimental results revealed that the SWSs prepared by utilizing the research method were superior to the SWSs prepared by the rest of the methods both in terms of cracking load, PL and destructive load. The PLs of the SWSs (JGC-2, JGC-4, JGC-6) prepared by this method in the pushing condition reached 276.1 kN, 294.3 kN, and 288.8 kN, respectively. The PLs of the SWSs prepared by this method in the pulling condition reached 268.5 kN, 288.4 kN, and 300.2 kN, respectively. Under the same axial pressure ratio conditions, the JGC series specimens had not only a larger hysteresis loop area but also a higher number of cycles compared to the GC15 series specimens. In addition, the IS of the SWS prepared by the research method was significantly improved compared to the low-strength specimens prepared by the rest of the methods, with an increase of about 7.1 %, 9.0 %, and 10.3 %, respectively. It can be concluded that the research method could effectively improve the bearing capacity and ductility of shear walls, so that they could show better stability and safety under extreme loading conditions such as earthquakes. However, the effect of replacement length on SP should not be neglected. Only a replacement length of 200 mm was used in the study. In addition, introducing inertial devices or bionic devices as supplementary control means was also an important cutting-edge direction in current structural seismic research. For instance, to alleviate the dynamic response of the structure under near-fault seismic excitation, Jangid RS analyzed the motion characteristics of a single-degree-of-freedom (SDOF) system in the presence or absence of a clutching inertial system (CIS) by numerically solving the motion control equations. The results showed that CIS could effectively reduce the displacement response of SDOF structures. Its efficiency increased with the increase of CIS inertia and had a significant inhibitory effect on the absolute acceleration of structures with shorter natural periods. However, for structures with longer cycles, the effect of CIS was not very significant [19]. To verify the effectiveness of the biological excitation device (BIDs) in mitigating the impact of earthquakes on elastic foundation isolation structures, Jangid RS utilized the equivalent linearization technique to analyze the nonlinear force-deformation characteristics of rigid foundation isolation structures with BIDs devices under stationary white noise seismic excitation. The results showed that even under the challenging conditions of near-fault movement, BIDs had the ability to control the displacement of the isolator [20]. In summary, the combination of inertial devices or bionic control devices with shear wall reinforcement technology was expected to build a composite system of “reinforcement+control”, thereby achieving more efficient energy dissipation and structural response control in the seismic design of HRBs.
Based on this, future research can be carried out in the following directions: First, this study systematically investigates the effects of different displacement lengths and local reinforcement configurations on the load-bearing capacity and ductility of shear walls, optimizing reinforcement geometric parameters and material combinations. Second, through numerical simulations and small-scale physical model experiments, it explores how parameter configurations of different inertia devices and BID devices influence structural displacement, acceleration, and energy dissipation characteristics. Third, the study comprehensively validates the “reinforcement+control” composite system for high-rise shear wall structures. By integrating seismic station testing or field simulations, it achieves optimization of design parameters and reliability assessment. Fourth, by integrating different foundation conditions, ground motion characteristics and composite control strategies, the performance of high-rise shear walls in complex sites is studied, thereby providing a scalable seismic optimization scheme for engineering practice.
References
-
T. Alam, R. Banerjee, V. Mahadeven, N. Gupta, and A. K. Parashar, “Assessment of shear wall quantity on seismic performance of high-rise building,” Asian Journal of Civil Engineering, Vol. 25, No. 5, pp. 3815–3822, Apr. 2024, https://doi.org/10.1007/s42107-024-01013-z
-
J. Zhao et al., “Mechanical behavior of ECC-reinforced coupled shear wall,” International Journal of Structural Integrity, Vol. 15, No. 3, pp. 522–538, May 2024, https://doi.org/10.1108/ijsi-12-2023-0147
-
L. Tang, Z. Guo, and X. Zang, “Seismic performance of precast concrete shear walls with spiral stirrup restrained grout-anchored lapped reinforcement connection,” Advances in Structural Engineering, Vol. 27, No. 15, pp. 2592–2608, Aug. 2024, https://doi.org/10.1177/13694332241276053
-
Y. Liu, J. Deng, Y. Jia, G. Wu, N. Ke, and X. Wei, “A study on the bearing performance of an RC axial compression shear wall strengthened by a replacement method using local reinforcement with an unsupported roof,” Buildings, Vol. 14, No. 9, p. 2926, Sep. 2024, https://doi.org/10.3390/buildings14092926
-
Y. Gao et al., “Study on seismic performance of reinforced concrete shear wall with diagonally distributed reinforcement,” Structural Concrete, Vol. 25, No. 6, pp. 5010–5023, May 2024, https://doi.org/10.1002/suco.202400391
-
H. Zhang, Z. Tang, Y. Duan, and Z. Chen, “Seismic performance of SFRC shear walls with window opening and the substitution effect for steel bars,” Buildings, Vol. 13, No. 6, p. 1550, Jun. 2023, https://doi.org/10.3390/buildings13061550
-
M. Katrangi and M. Khanmohammadi, “Experimental study of seismic performance of an innovative low-damage self-centering composite steel plate shear wall,” Journal of Structural Engineering, Vol. 150, No. 1, Jan. 2024, https://doi.org/10.1061/jsendh.steng-12815
-
L. Dou, Z. Huang, Y. Liu, Y. Wang, and L. Zhao, “Experimental Investigation on the seismic performance of novel prefabricated composite RC shear walls with concrete-filled steel tube frame,” Buildings, Vol. 14, No. 9, p. 2673, Aug. 2024, https://doi.org/10.3390/buildings14092673
-
A. Khelaifia, R. Chebili, and A. Zine, “Impact of the position and quantity of shear walls in buildings on the seismic performance,” Asian Journal of Civil Engineering, Vol. 25, No. 1, pp. 953–964, Jul. 2023, https://doi.org/10.1007/s42107-023-00824-w
-
M. A. Salmassi, A. Kheyroddin, and A. Hemmati, “Enhancement of the performance of two tall buildings with end shear walls using nonlinear time history analysis: a case study,” Iranian Journal of Science and Technology, Transactions of Civil Engineering, Vol. 48, No. 4, pp. 2019–2029, Dec. 2023, https://doi.org/10.1007/s40996-023-01289-2
-
S. Ghoul, A. Ahmed-Chaouch, M. Saidani, R. Taleb, and W. E. El-Demerdash, “Seismic performance of L-shaped RC shear walls of buildings subjected to monotonic lateral loading,” International Journal of Civil Engineering, Vol. 22, No. 1, pp. 125–144, Sep. 2023, https://doi.org/10.1007/s40999-023-00889-3
-
C. Vulcu, B. Hoffmeister, D. Bimbli, R. Das, and H. Degee, “Hybrid coupled walls with replaceable shear links: technical solution and seismic performance of a 3D multi‐story building,” ce/papers, Vol. 6, No. 3-4, pp. 2272–2277, Sep. 2023, https://doi.org/10.1002/cepa.2460
-
R. Banerjee, A. K. Parashar, N. Gupta, and J. B. Srivastava, “Study on earthquake induced torsional irregularity and lateral displacement of RC building with shear wall,” Asian Journal of Civil Engineering, Vol. 24, No. 8, pp. 3463–3471, May 2023, https://doi.org/10.1007/s42107-023-00725-y
-
K. Shukla and K. Nallasivam, “Dynamic response of high-rise buildings with shear walls due to seismic forces,” Asian Journal of Civil Engineering, Vol. 24, No. 7, pp. 2645–2657, Apr. 2023, https://doi.org/10.1007/s42107-023-00669-3
-
D.-P. N. Kontoni and A. A. Farghaly, “Enhancing the earthquake resistance of RC and steel high-rise buildings by bracings, shear walls and TMDs considering SSI,” Asian Journal of Civil Engineering, Vol. 24, No. 7, pp. 2595–2608, Apr. 2023, https://doi.org/10.1007/s42107-023-00666-6
-
A. Agarwal, S. Chatterjee, S. Ram, D. Singh, R. Ralli, and C. Sharma, “Effectiveness of friction pendulum system on the seismic behavior of high-rise building with shear wall,” Asian Journal of Civil Engineering, Vol. 24, No. 7, pp. 2719–2726, Mar. 2023, https://doi.org/10.1007/s42107-023-00618-0
-
P. Suwansaya and P. Warnitchai, “Simplified procedure for rapidly estimating inelastic responses of numerous high-rise buildings with reinforced concrete shear walls,” Buildings, Vol. 13, No. 3, pp. 670–677, Sep. 2022, https://doi.org/10.21203/rs.3.rs-2016644/v1
-
A. M. Usman and M. K. Abdullah, “An assessment of building energy consumption characteristics using analytical energy and carbon footprint assessment model,” Green and Low-Carbon Economy, Vol. 1, No. 1, pp. 28–40, Mar. 2023, https://doi.org/10.47852/bonviewglce3202545
-
R. S. Jangid, “Response of structures with clutching inertial system under near-fault motions,” Journal of Structural Design and Construction Practice, Vol. 31, No. 1, Feb. 2026, https://doi.org/10.1061/jsdccc.sceng-1939
-
R. S. Jangid, “Resilient base-isolated structures using bio-inspired supplementary devices,” Structures, Vol. 71, p. 108099, Jan. 2025, https://doi.org/10.1016/j.istruc.2024.108099
About this article

This study was supported by the Research on failure mechanism of vertical non-uniform frozen reinforced concrete columns under coupling action of freeze-thaw cycles and continuous loads (No. 232300420107).
The datasets generated during and/or analyzed during the current study are available from the corresponding author on reasonable request.
The authors declare that they have no conflict of interest.
