Abstract
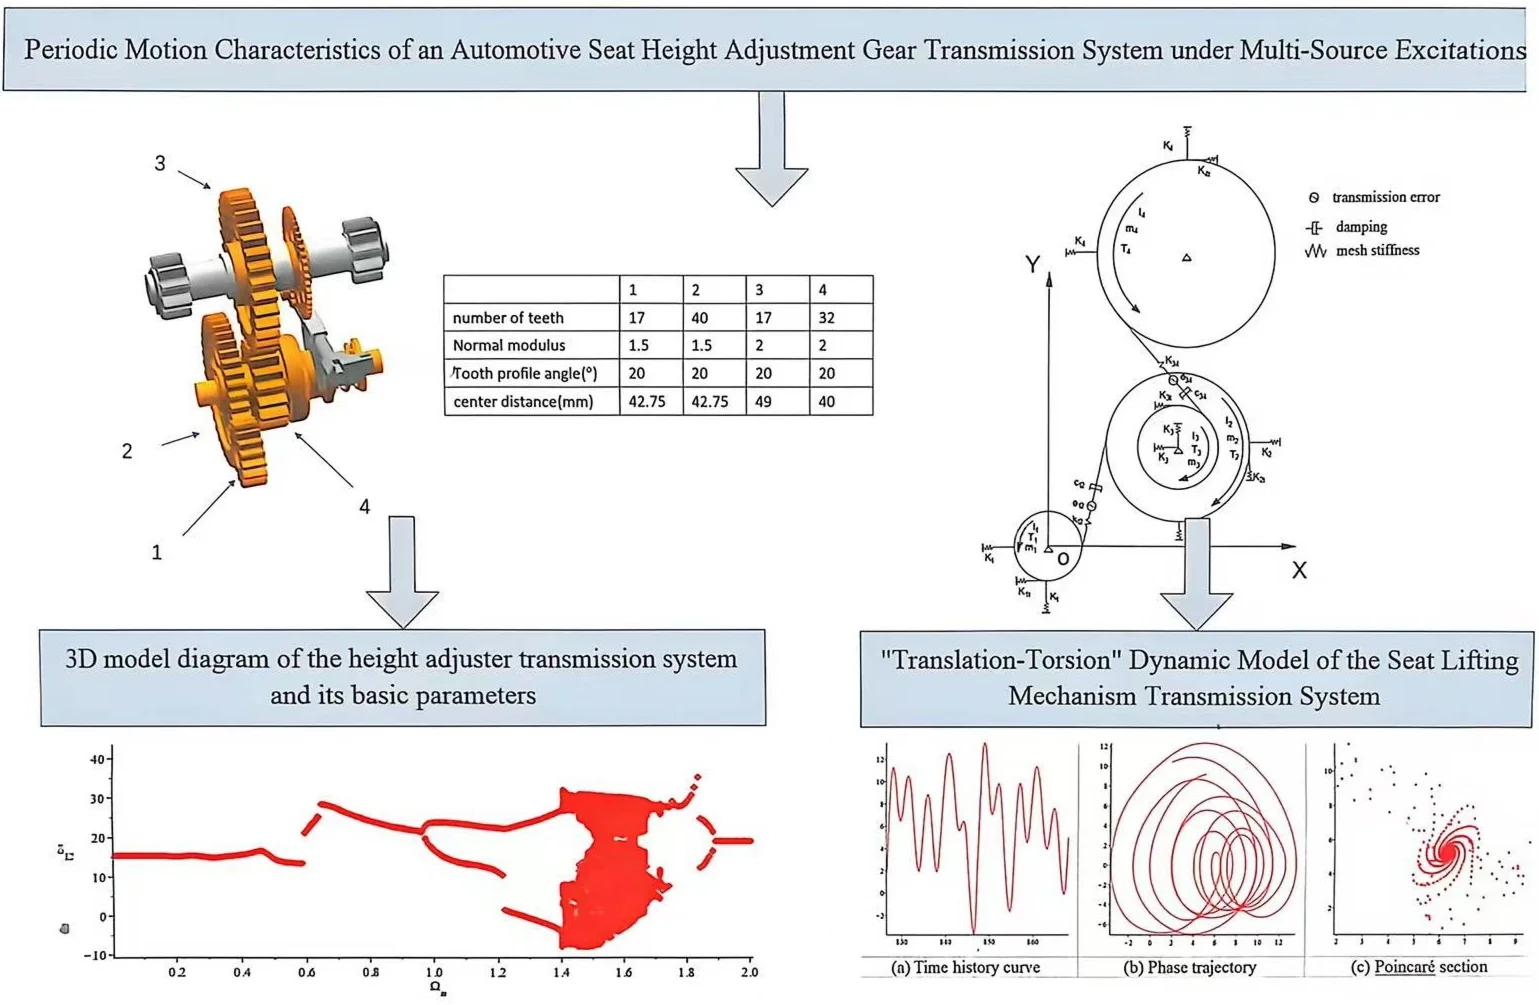
To reveal the influence patterns of various internal and external excitations, such as errors, clearances, stiffness, rotational speeds, and loads, on the gear transmission system of the height adjuster, and to optimize the vibration and impact generated by these excitations, theoretical modeling, numerical analysis, and simulation verification methods were comprehensively utilized to calculate and analyze the periodic motion characteristics and response amplitudes of the seat height adjuster. The results show that, to prevent the system from entering a chaotic state, the input gear speed should avoid the speed ranges of 1349 r/min-1359 r/min and 1589 r/min-2060 r/min. This work provides a theoretical basis for the selection of operating conditions for the gear transmission system of the height adjuster, and also offers valuable references and insights for engineers and technicians in related fields.
Highlights
- As the load or input torque increases, the system's motion state transitions from chaotic to quasi-periodic or single-periodic motion. Appropriately increasing the load or torque can improve gear meshing, enhance system stability, reduce vibration, and optimize shock absorption effects.
- An appropriate backlash value can enhance the stability and reliability of the system, avoid chaotic motion, and improve the transmission efficiency of the system.
- As the meshing frequency increases, the natural frequency of the system also increases accordingly, which means that the system's sensitivity to external excitation will increase, potentially exhibiting more complex dynamic behaviors
- Increasing the meshing damping ratio helps to suppress the chaotic behavior of the system and improve its stability. This provides theoretical support for improving system performance by adjusting the meshing damping ratio in practical applications.
1. Introduction
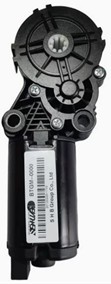
In today’s society, with the diversification of transportation vehicles, people’s demand for comfort is also increasing. Especially for car seats, the comfort of the seat directly affects the feelings of drivers and passengers. However, everyone's body shape and comfort requirements vary. By optimizing the seat adjuster, the comfort of driving and riding can be improved [1]. However, seat adjusters often produce vibration and noise during operation, which not only affects the riding comfort but may also have a negative impact on people’s health. Therefore, studying the vibration and noise problems existing in the operation of seat adjusters has important practical significance. The height adjuster component is shown in Fig. 1.
Fig. 1Height adjuster assembly. Image source: Car seat reclining motor, model: T73GM-0000 12V, Wuyuan Jieyi Automobile Electric Appliance Co., Ltd, China
As an important component of car seats, the design and comfort of seat height adjusters have always been a focal point of research for scholars both domestically and internationally. Jiaxing Zhan conducted an in-depth study on the self-locking gears in seat height adjusters, quantitatively analyzing the effects of torque, tip radius, center-to-center distance error, and misaligned shafts on the self-locking gear pair [2]. Sung-Yuk Kim and Key-Sun Kim delved into the impact of the dynamic characteristics of lead screws. Through modal tests, they studied the vibration characteristics of lead screws under different boundary conditions and applied the test results to mathematical models for numerical analysis. The research revealed that the main causes of resonance noise and unstable vibration in lead screws are related to the constraint method of the front bracket [3-5]. Purnendu Mondal [6] evaluated the vibration levels inside cars for seated human subjects and the seats themselves. His simulation system can predict the ultimate vibration levels inside the seats and human subjects, providing strong support for related research and design. During the operation of the seat height adjustment gear transmission system, internal excitations such as transmission errors, backlash, and time-varying meshing stiffness can induce vibrations, shocks, and chaotic behaviors, leading to fatigue damage, noise pollution, and reduced operational efficiency in the transmission system [7]. Adrien Mélot and others proposed a nonlinear dynamic analysis method that considers the holes on the gear blank and the resulting multi-harmonic internal excitations. By connecting two flexible shafts to a pair of spur gears with holes, time-varying meshing stiffness (TVMS) and load static transmission error (LSTE) are identified as the main sources of vibration in the gear system [8-10]. Song [11] demonstrated a negative correlation between the gears' geometric center distance and meshing stiffness amplitude, and discovered that gear vibration can affect the relative position of the gears. To optimize fuel economy and improve vehicle longitudinal control performance, Lyu [12] proposed a gear planning strategy considering traffic light information and velocity tracking control. Takes into account various nonlinear factors such as nonlinear oil film force, time-varying meshing stiffness, and tooth-side clearance, Gao [13] analyzed the impact of nonlinear oil film force on the system's dynamic characteristics, for a plain bearing-secondary helical gear planetary system.
Based on the literature review above, it is evident that the vibration and impact phenomena in gear transmission systems have garnered extensive research attention both domestically and internationally. While existing literature has explored the vibration and impact phenomena caused by internal excitation in gear transmission systems, there is a lack of theoretical construction and optimization analysis specifically targeting the vibration and impact behavior of seat height adjusters, given their unique structure and load characteristics
Fig. 23D model diagram of the height adjuster transmission system and its basic parameters
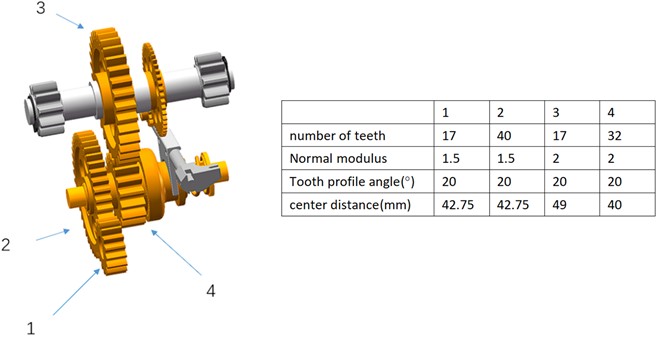
This study focuses on the gear transmission system of the car seat lifting mechanism. Fig. 2 depicts the three-dimensional simplified model of the research object: the transmission system of the car seat height adjuster. The model data is derived from a small electric mechanism developed by Xiangyang Hangli Electromechanical Technology Development Co., Ltd. (Patent No.: CN 217029719 U). By combining theoretical modeling with simulation verification, an in-depth analysis of the system's vibration and impact phenomena is conducted. Firstly, a nonlinear dynamic model is constructed, which fully considers the translational and torsional degrees of freedom of all components. Based on this, corresponding differential equations are derived. Numerical analysis is used to analyze the periodic response patterns, seeking the periodic response characteristics of the system. Based on this, the harmonic balance method is applied to reveal the system's vibration and impact phenomena. Finally, a multi-factor analysis model for vibration and impact is established using the Taguchi method, identifying and optimizing the most critical excitation factors affecting vibration and impact behavior. The optimization effect is verified through the simulation model.
2. Theoretical modeling research on the gear transmission system for automobile seat height adjustment
In the seat height adjuster transmission system, errors are inevitably present in the processing and installation of various components. These errors not only exist in individual components but may also accumulate and amplify during the coordination and assembly of components, thereby significantly affecting the overall performance of the gear transmission system [14]. This is manifested in multiple aspects. Firstly, when assembling components into a complete transmission system, various factors such as fit clearance and pre-tightening force can lead to deviations in the relative position and angle of components. Secondly, the runout error of the gear's pitch circle is also an important factor affecting system performance. Furthermore, during the processing and assembly process, the measurement of component dimensions and shapes is also influenced by the accuracy of measuring tools and the skill level of operators, resulting in measurement deviations. These factors collectively constitute the dynamic excitation sources of the gear transmission system, which may cause problems such as vibration, impact, and noise during system operation [15].
2.1. Backlash
During the gear transmission process, to ensure that a lubricating oil film can effectively form between the meshing tooth profiles, and to prevent the phenomena of seizure and expansion caused by heat generated from inter-tooth friction, a certain gap, namely the tooth flank clearance or simply referred to as side clearance [16], needs to be maintained between the tooth profiles. Its expression is as follows:
where represents the measurement value of the tooth clearance converted to the meshing line.
2.2. Meshing damping
The energy dissipation during gear meshing is a complex phenomenon, involving multiple physical mechanisms and factors. Plastic deformation, inter-tooth friction, lubricating oil film, as well as the material and structural characteristics of gear teeth, all have an impact on this process. These factors not only act individually but also have alternating and coupled effects on each other, making precise modeling of meshing damping very challenging.
Currently, the quantitative description of meshing damping typically relies on empirical formulas. These formulas are often based on experimental data and observed phenomena, attempting to capture the relationship between meshing damping and key parameters such as damping ratio, meshing stiffness, and gear quality [17]. Generally, the empirical formula for meshing damping can be expressed as:
where, represents the damping ratio; represents the average value of time-varying meshing stiffness; and represent the masses of gears 1 and 2, respectively.
2.3. Meshing stiffness
During gear operation, a phenomenon of periodic meshing between single and double teeth occurs, leading to periodic changes in the elastic deformation and stiffness excitation of the gear teeth. This, in turn, produces periodic impacts on the transmission system. As shown in Fig. 6, this stiffness variation caused by the transition from single to double tooth meshing is referred to as “time-varying meshing stiffness”.
Fig. 3Meshing stiffness variation
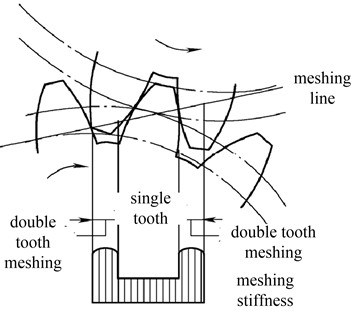
Fig. 4Cantilever beam model
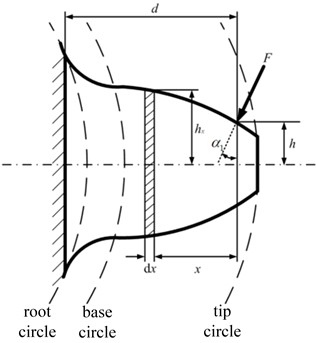
The analytical calculation model for solving gear meshing stiffness using the potential energy method is shown in Fig. 3. The comprehensive elastic deformation energy of the meshing gear in this model is composed of multiple parts, including the Hertzian contact energy, bending potential energy, radial compression deformation energy, shear deformation energy, and matrix energy of the cantilever beam, and energy changes occur during the meshing process [18]. These five types of potential energy can be represented as follows:
where, represents the meshing force exerted on the gear; , , , , and respectively represent the Hertzian stiffness, bending stiffness, radial compressive stiffness, shear stiffness, and matrix stiffness produced by a single gear under meshing conditions. As can be seen from Fig. 4, the meshing force exerted on the gear can be decomposed into horizontal and vertical forces . According to the parallelogram rule, it can be deduced that:
Based on the principles of elastic mechanics, the relationship between relative displacement and load, influenced by the geometric shape of the tooth surface and material properties, defines the Hertzian contact stiffness as described in [19]:
where, represents the elastic modulus of the material; is the width of the gear tooth; is Poisson’s ratio.
Based on the beam deformation principle in material mechanics, when subjected to meshing force , corresponding bending potential energy will be generated [19]. In addition, radial compression deformation energy and shear deformation energy are as follows:
where, represents the area of the cross-section at point where the meshing force acts; denotes the moment of inertia; and stands for the shear modulus. The expression for the time-varying meshing stiffness of the gear pair in the single tooth meshing state is as follows:
The parameters of the seat height adjustment system are shown in Table 1. Using Maple software and the aforementioned formula, the time-varying meshing stiffness of a pair of gears was calculated, and the results are presented in Fig. 8.
Table 1Main parameters of gear pairs
Number of teeth | 17 | 40 | 17 | 32 |
Modulus | 1.5 mm | 1.5 mm | 2 mm | 2 mm |
Pressure angle | 20° | 20° | 20° | 20° |
Full tooth height | 3.375 mm | 3.375 mm | 4.5mm | 4.5 mm |
Base circle radius | 11.98 mm | 28.19 mm | 15.97 mm | 30.07 mm |
Moment of inertia | 3.13×10⁻⁶ kg·mm2 | 5.5485×10⁻⁵ kg·mm2 | 1.4921×10⁻⁵ kg·mm2 | 9.370×10⁻⁵ kg·mm2 |
Young’s modulus | 2.05×10¹¹ N/m2 | 2.05×10¹¹ N/m2 | 2.05×10¹¹ N/m2 | 2.05×10¹¹ N/m2 |
Poisson’s ratio | 0.269 | 0.269 | 0.269 | 0.269 |
Tooth width | 10 mm | 8 mm | 12 mm | 10 mm |
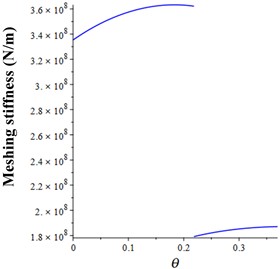
As can be seen from Fig. 5, the time-varying meshing stiffness of the gear pair exhibits alternating changes due to the periodic variation of contact ratio. This alternating variation divides the comprehensive stiffness into two distinct regions: the single tooth meshing region and the double tooth meshing region. In these two regions, the comprehensive stiffness exhibits different characteristics, which have a significant impact on the transmission performance of the gear pair. At the boundary between the two regions, there is a significant jump in stiffness. This alternating meshing characteristic induces sudden changes in load, generating dynamic excitation. Similarly, Fig. 6 shows the comprehensive meshing stiffness of gear pair , which is consistent with the results in reference [20].
Fig. 5Meshing stiffness of gear pair P12
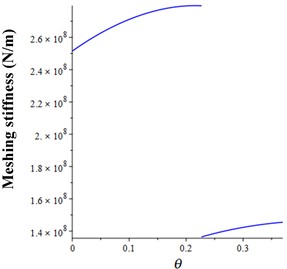
Fig. 6Meshing stiffness of gear pair P34
2.4. Kinetic model and equations
This article constructs a dynamic model of the height adjuster transmission system based on a two-dimensional plane. Considering the translational vibration and torsional vibration () of each gear in the system, it aims to more comprehensively reflect the dynamic behavior of the system. By employing the lumped mass method to build the dynamic model and using the second-order Lagrange equation to derive the corresponding set of nonlinear dynamic differential equations, a solid theoretical foundation is provided for subsequent analysis and research, based on the following assumptions:
1) The meshing force always acts along the direction of the meshing line. A spring damping unit is used to describe the dynamic characteristics of the meshing pair, including its meshing stiffness that varies with time, damping effect, tooth backlash, and possible errors that may occur during the transmission process.
2) Assume that the meshing force generated by all gear pairs is completely confined within the meshing plane, without considering the force components outside the plane.
3) The friction impact of each component at the support point is ignored, as well as the friction force generated during the meshing process of gear teeth.
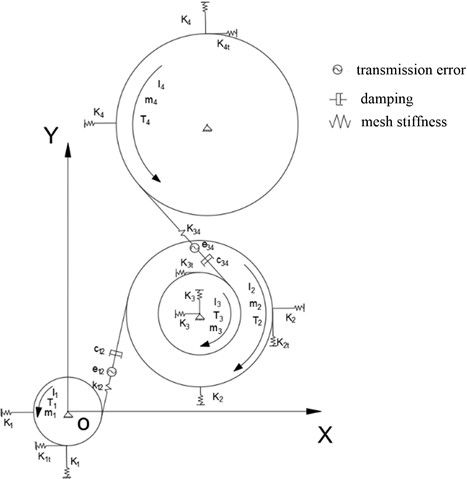
Based on the above assumptions, a “translation-torsion” dynamic model of the seat lifting mechanism transmission system is established, as shown in Fig. 7.
In Fig. 7, and represent the equivalent meshing stiffness of gear 1 and gear 2, as well as gear 3 and gear 4; and represent the axial and tangential support stiffness of the gears, respectively; , , and represent the rotational inertia, load, and mass, respectively; and represent damping and transmission error, with counterclockwise rotation taken as the positive direction.
By introducing eccentricity error, clearance piecewise function, and clearance influence coefficient into the differential equation, the precise dynamic equation for the height adjuster is ultimately obtained:
(1) The revised nonlinear motion differential equation for input gear :
(2) The revised nonlinear motion differential equation for gear :
(3) The revised nonlinear motion differential equation for gear :
(4) The modified nonlinear motion differential equation for output gear :
Among them, meshing damping: , , 1, 2, 3, 4.
Fig. 7“Translation-Torsion” dynamic model of the seat lifting mechanism transmission system
2.5. Non-dimensional equations
In this work, the gear transmission system of the seat height adjuster exhibits distinct characteristics in its parameter performance under the international standard unit system. The magnitude of the stiffness coefficient is roughly distributed between 107 and 109, while the magnitude of the damping coefficient is located in the range of 10-2 to 10-1. Correspondingly, the magnitude of the vibration displacement that needs to be solved is between 10-6 and 10-4. To effectively avoid such problems and improve the accuracy and efficiency of the solution, it is particularly important to perform dimensionless processing on Eqs. (14-15). The time dimensionless representation is as follows:
where, represents the nominal time scale:
where, represents the average meshing stiffness; is the radius of the base circle; is the moment of inertia.
1) Dimensionless nonlinear motion differential equation of input gear :
2) Dimensionless nonlinear motion differential equation of gear :
3) Dimensionless nonlinear motion differential equation of gear :
4) Dimensionless nonlinear motion differential equation of output gear :
2.6. Numerical calculation by Runge-Kutta
The fourth-order Runge-Kutta method is renowned for its high-precision characteristics. Compared with lower-order methods, it can provide more accurate calculation results under the same conditions, thus meeting more stringent requirements for calculation accuracy [21]. The formula of the fourth-order Runge-Kutta method is as follows:
where, represents the value of the next discrete point, and is the value from the previous iteration. is the time step, and , , , are four intermediate variables, which are calculated using the following formulas:
In each iteration, based on the value of the previous iteration and the time step , the next discrete point’s value is calculated using the above formula. The deviation between the two calculated results is then checked, that is:
Define an allowable error as the criterion for judging the calculation accuracy. When the difference between the current result and the previous result is greater than , it is considered that the current result has not yet met the required precision requirement. Therefore, the iterative calculation will continue, usually using the halving method to narrow the calculation range. This process will repeat until the obtained in a certain iteration is less than .
3. Numerical analysis
3.1. The influence of meshing frequency on the periodic motion
Set the backlash parameter of the adjuster transmission system to 20 um, with a meshing damping ratio of 0.07. The bifurcation diagram of the meshing pair within the interval [0.1, 2.01] is shown in Fig. 8.
Fig. 8Bifurcation diagram of the response of the meshing pair Ps1s2 with respect to the meshing frequency Ωm
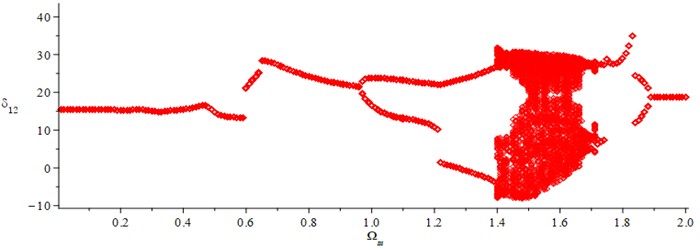
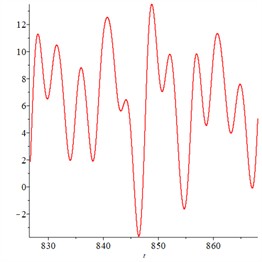
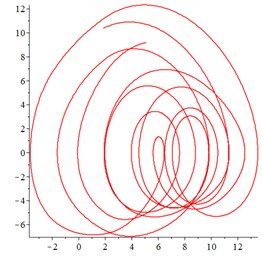
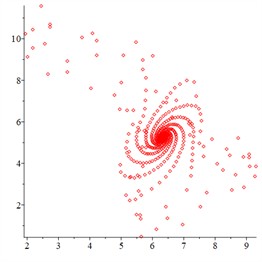
Through in-depth analysis of Fig. 3, it can be observed that when the system’s dimensionless meshing frequency is within the interval [0.1, 0.69], the system exhibits a single-period motion pattern, which is predictable. When the dimensionless meshing frequency exceeds a certain specific value, the motion state of the system begins to transition to quasi-periodic motion. When the meshing frequency reaches 0.7, as shown in Fig. 9, under certain specific conditions, the system will fall into a chaotic state. The time history curve of the system will no longer exhibit periodic characteristics, but will instead present a non-periodic complex pattern. This reflects the complexity and uncertainty of the system's internal dynamic behavior. At the same time, the phase trajectory exhibits an unclosed state, which further confirms the instability of the system dynamics. On the Poincaré section, many irregular points can be observed scattered among them, which reflect the complex and disorderly motion pattern of the system in the chaotic state.
Fig. 9Pseudo 3-cycle response of the system with meshing frequency 1.98, a) in which the x-axis represents non-dimensional time τ and the y-axis represents non-dimensional penetration depth, while in b)-c), the x-axis represents non-dimensional penetration depth of the meshing pair and the y-axis represents non-dimensional penetration speed
a) Time history curve
b) Phase trajectory
c) Poincaré section
Under the condition of 1.98, the transmission system transitions from a chaotic state to a quasi-periodic state, as illustrated in Fig. 10. The time history curve exhibits a periodic motion characteristic, with a clear periodicity of 3. Simultaneously, the phase trajectory forms a closed state after circling three times, displaying a certain degree of repeatability and forming a specific curve band. On the Poincaré section, three dotted lines spiraling according to the same pattern can be observed, further confirming that the system has entered a quasi-3-periodic motion state.
Fig. 10Pseudo 3-cycle response of the system with meshing frequency 1.98, a) in which the x-axis represents non-dimensional time τ and the y-axis represents non-dimensional penetration depth, while in b)-c), the x-axis represents non-dimensional penetration depth of the meshing pair and the y-axis represents non-dimensional penetration speed
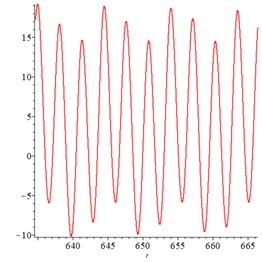
a) Time history curve
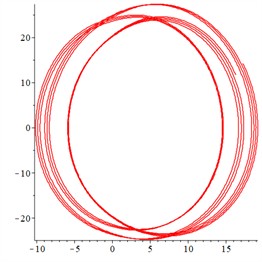
b) Phase trajectory
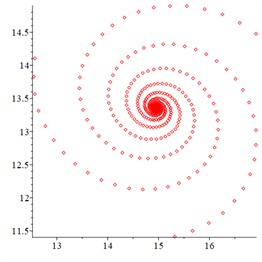
c) Poincaré section
The gear meshing frequency represents the rotational speed of the gear. To optimize the vibration performance of the height adjuster during operation, chaotic states should be avoided. When the output load is 600 N·M, the dimensionless meshing frequency should avoid the two specific intervals of [1.29-1.30] and [1.52, 1.97]. Converted to the rotational speed of the input wheel s1, it falls within the ranges of 1349 r/min to 1359 r/min and 1589 r/min to 2060 r/min. By avoiding these speed intervals, it can ensure that the gear system maintains a stable periodic motion state, thereby effectively reducing the vibration noise of the height adjuster transmission system and improving the overall smoothness and reliability of operation.
3.2. The influence of meshing damping ratio on the periodic motion
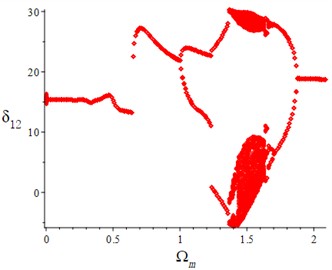
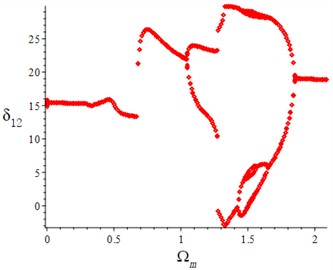
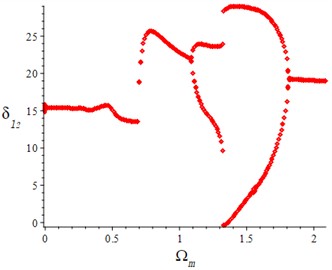
When the meshing damping ratio is set to 0.07, 0.09, 0.11, and 0.13, corresponding bifurcation diagrams of the system’s periodic response with respect to the meshing frequency are plotted, as shown in Fig. 11. The stability region of the system expands as the meshing damping ratio increases. This implies that a higher damping ratio aids in suppressing the system’s unstable behavior, allowing the system to maintain periodic response across a broader range of meshing frequencies. Furthermore, as the damping ratio increases, the bifurcation points shift towards higher meshing frequencies. This suggests that increasing the damping ratio can elevate the threshold for system bifurcation, enabling the system to maintain stable periodic response even at higher excitation frequencies.
Fig. 11Bifurcation diagrams with different meshing damping ratios
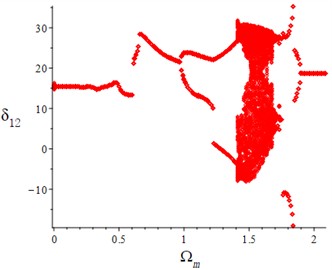
a)0.07
b)0.09
c)0.11
d)0.13
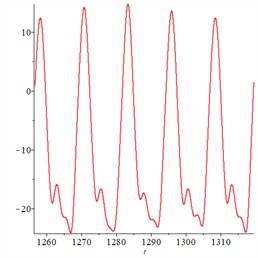
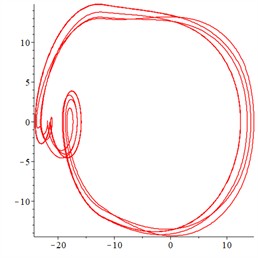
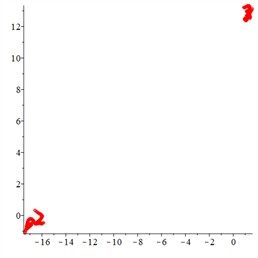
By analyzing the bifurcation diagram of the system dynamic response with respect to the meshing damping ratio ξ and combining it with the bifurcation diagram of the system periodic response with respect to the meshing frequency under different meshing damping ratios, we can draw the following conclusion: at lower damping ratios, the system is prone to entering a chaotic state and experiencing more complex bifurcation paths. At higher damping ratios, the dynamic behavior of the system becomes simpler and more predictable, but an excessively high damping ratio may lead to an overly sluggish system response. Therefore, when designing a gear transmission system, an appropriate damping ratio can be selected based on the required dynamic performance. As shown in Fig. 12, when 0.03, the system transitions to a four-periodic motion.
Fig. 12Pseudo 4-cycle response of system with meshing damping ratio 0.03. In a), the x-axis represents dimensionless time τ, and the y-axis represents dimensionless penetration depth. In b)-c), the x-axis represents the dimensionless penetration depth of the meshing pair, and the y-axis represents the dimensionless penetration speed
a) Time history curve
b) Phase trajectory
c) Poincaré section
By analyzing the bifurcation diagram of the system dynamic response with respect to the meshing damping ratio and combining the bifurcation diagram of the system periodic response with respect to the meshing frequency under different meshing damping ratios, it can be concluded that at lower damping ratios, the system is prone to entering a chaotic state and experiencing more complex bifurcation paths. At higher damping ratios, the dynamic behavior of the system becomes simpler and more predictable, but an excessively high damping ratio may lead to an overly sluggish system response. Therefore, when designing a gear transmission system, an appropriate damping ratio can be selected based on the required dynamic performance.
3.3. The influence of backlash on the periodic motion
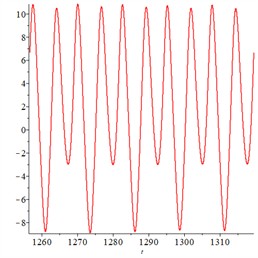
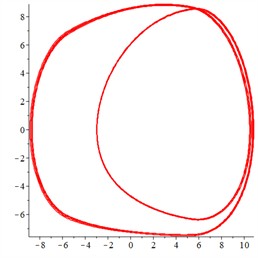
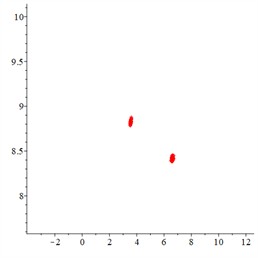
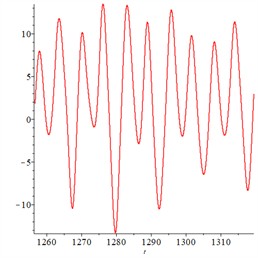
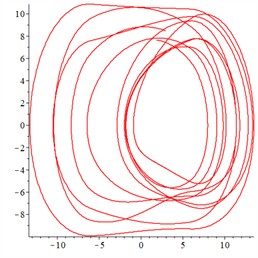
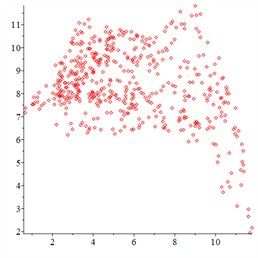
As shown in Fig. 13, the system exhibits a quasi-2-period state. In this state, although the time history curve resembles a 2-period cycle, there are still subtle differences. The phase trajectory appears as a closed curve band that circles twice and has a certain width, further revealing the complexity of the system’s motion. Meanwhile, the two closed loops on the Poincaré section also indicate the instability of the system's dynamic behavior. As the dimensionless backlash of the gear continues to increase, the dynamic behavior of the system undergoes significant changes. For example, in 6.0 a certain state, the system enters a chaotic state, as shown in Fig. 14. This is because excessive backlash leads to impact and noise, exacerbating system vibration and wear, and reducing the transmission efficiency of the equipment, thereby affecting the stability of the equipment.
Based on the above conclusions, it can be inferred that under light load conditions 100 N∙m the selection of the dimensionless tooth side clearance should fall within the range of 2 to 5. An excessively small clearance can lead to issues such as inflexible meshing, significant tooth surface wear, and tooth jamming, while an excessively large clearance can result in significant energy loss during transmission and affect system stability. Therefore, when designing the body height adjuster, it is necessary to reasonably control the size of the tooth side clearance to achieve optimal transmission efficiency and equipment stability.
Fig. 13Quasi-2-cycle response of a system with a dimensionless flank clearance of 5.5. In a) the x-axis represents the dimensionless time τ, and the y-axis represents the dimensionless penetration depth. In b)-c) the x-axis represents the dimensionless penetration depth of the meshing pair, and the y-axis represents the dimensionless penetration speed
a) Time history curve
b) Phase trajectory
c) Poincaré section
Fig. 14Chaotic response of the system with a dimensionless tooth side clearance of 6, where a) shows the x-axis representing dimensionless time τ and the y-axis representing dimensionless penetration depth, while b)-c) show the x-axis representing the dimensionless penetration depth of the meshing pair and the y-axis representing the dimensionless penetration speed
a) Time history curve
b) Phase trajectory
c) Poincaré section
3.4. The influence of load on the periodic motion
Under the conditions of maintaining a dimensionless meshing frequency of 1, a meshing damping ratio of 0.07, and a tooth backlash set at 20 um, a bifurcation diagram of the system with respect to the change in load is plotted, as shown in Fig. 18. This diagram specifically presents the calculation results of the meshing pair .
Fig. 15Bifurcation diagram about load torque T4
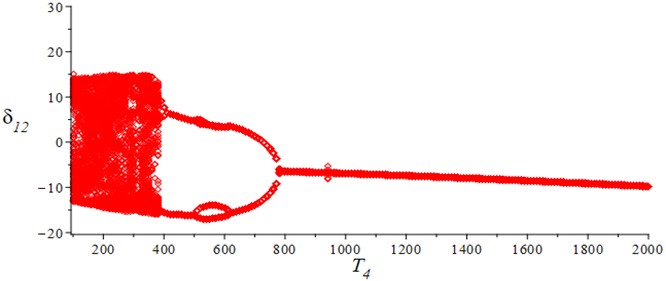
As can be seen from Fig. 15, when the torque is less than 420 N·m, the system exhibits chaotic motion, with dynamic behavior that is difficult to predict and lacks obvious periodicity. However, as the torque gradually increases, the motion characteristics of the system begin to change. When the torque increases to a certain level, the system transitions from chaotic state to quasi-three-period motion. In this state, although the system still exhibits a certain degree of complexity and uncertainty, it begins to show a periodic trend, that is, its motion state cycles between three different periods. As the torque continues to increase, the system eventually evolves from quasi-three-period motion to stable single-period motion. At this point, the motion of the system becomes highly regular and predictable, repeating in a fixed cycle. This stable single-period motion state indicates that the system has reached a certain equilibrium, and its response to external disturbances is relatively stable. Therefore, under heavy load conditions, appropriately increasing the torque can help reduce the vibration response of the system and improve its shock absorption effect. However, it should be noted that excessive torque can lead to excessive stress, causing fatigue damage to the gears. Therefore, in practical operations, the torque needs to be appropriately increased according to the working conditions and system characteristics to achieve the best shock absorption effect and system stability.
4. Simulation verification
The simulation experiment requires the use of computers and related software, which can be conducted quickly and at a low cost in a virtual environment. Moreover, in the simulation environment, the adjustment and optimization of parameters become extremely convenient, allowing for the easy observation of the impact of various parameter changes on the system performance.
Fig. 16Three-dimensional dynamic model of the gear transmission system of the height adjustment device based by ADAMS
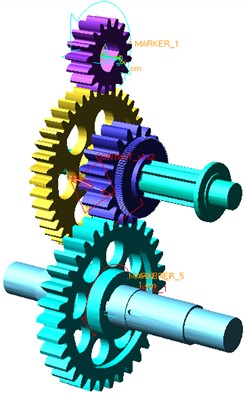
This work uses the SolidWorks 3D software to establish the parametric model of the gear and conduct interference-free assembly. The basic geometric parameters of the studied height adjustment device are shown in Table 2. Based on the basic geometric parameters of the two pairs of gear pairs in the table, the 3D modeling is carried out using the SolidWorks software, as shown in Fig. 16. The generated files are imported into the ADAMS software, and the material properties of each component are defined. The software will automatically calculate the mass and moment of inertia of each component.
There is a close relationship between the vibration of the gear transmission system and the dynamic meshing force. The dynamic meshing force is the main excitation source causing the vibration of the gears, and its variation directly affects the vibration response of the gears. By analyzing the fluctuations of the dynamic meshing force, the vibration condition of the system can be indicated. By changing parameters such as the tooth side clearance, eccentricity error, and load, the vibration condition of the gears can be understood, and the obtained conclusions can be compared with the theoretical results. Based on the parameters set in the Table 2, 11 different working conditions were simulated, and the results are shown in Table 3.
Table 2Parameter settings of simulation model
Running time (s) | 5 |
Material | Steel |
Average value of time-varying meshing stiffness of gear pair (N/m) | 2.234×10⁸ 3.097×10⁸ |
Contact stiffness (N/m) | 4.529×10⁸ N/m 5.051×10⁸N/m |
Dynamic damping | 2.2645E+05 2.526E+06 |
Penetration depth coefficient | 1×10⁻⁴ |
Static friction coefficient | 0.23 |
Dynamic damping coefficient | 0.16 |
Table 3Display of 11 working conditions
Eccentricity error (μm) | Backlash (μm) | Load (N·m) | Speed (r/min) | |
Condition 1 | 0 | 0 | 300 | 132 |
Condition 2 | 20 | 0 | 300 | 132 |
Condition 3 | 40 | 0 | 300 | 132 |
Condition 4 | 0 | 0 | 300 | 132 |
Condition 5 | 0 | 10 | 300 | 132 |
Condition 6 | 0 | 30 | 300 | 132 |
Condition 7 | 20 | 30 | 100 | 132 |
Condition 8 | 20 | 30 | 300 | 132 |
Condition 9 | 20 | 30 | 600 | 132 |
Condition 10 | 0 | 30 | 300 | 60 |
Condition 11 | 0 | 30 | 300 | 300 |
4.1. The influence of backlash on the periodic motion
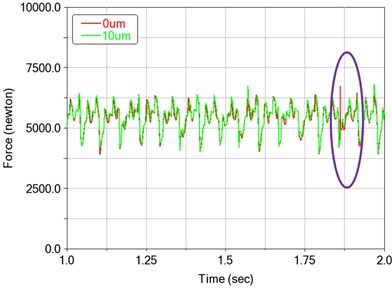
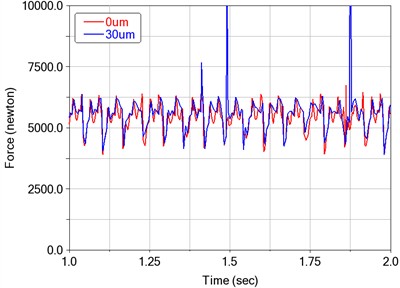
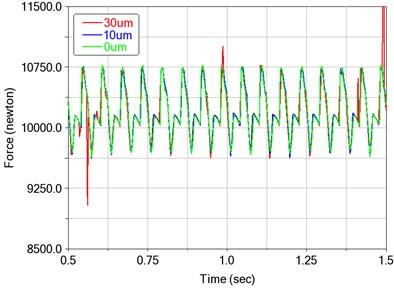
To study the influence of the tooth side clearance on the dynamic tooth contact force, only the tooth side clearance of the input gear s1 was added to the model (conditions 4, 5, and 6). Without changing the torque and rotational speed, the size of the tooth side clearance was controlled by changing the center distance of the gear engagement. The changes in the contact force between the meshing pairs were analyzed, as shown in Fig. 17.
By comparing the working conditions 4 and 5, it was found that when the tooth side clearance was 0 um, the contact force reached a peak, indicating that the system experienced vibration at that moment. However, when a 10 um tooth side clearance was introduced, the dynamic contact force of the meshing pair showed small-amplitude sinusoidal fluctuations within the range of approximately 5000 N, which indicated that the system was running smoothly without any meshing shock phenomenon. This is because the presence of the tooth side clearance helps absorb deformations caused by manufacturing errors, thermal expansion, etc., and avoids excessive compression between the gear teeth, thereby reducing friction and stress concentration.
When the backlash reached 30 um, the gear meshing shock gradually increased, and the fluctuation amplitude became more obvious. Compared with a 10 um clearance, the meshing shock increased significantly. This is because an excessively large backlash would cause the gears to lose their continuous meshing state during the transmission process, leading to axial movement. This shock and vibration would cause significant fluctuations in the contact force, thereby increasing the contact force. Moreover, the larger clearance on the gear pair 12 would also have an adverse effect on the smooth operation of the next gear. Through the above analysis, it was found that either an excessively large backlash or no backlash at all would have an adverse impact on the stability of the system. Choosing an appropriate backlash value is necessary to balance the performance and stability of the gear transmission, which is consistent with the results of theoretical analysis.
Fig. 17Effect of tooth side clearance on dynamic meshing force
a) Gear1-2 in the condition 4-5
b) Gear1-2 in the condition 4-6
c) Gear 3-4 in the condition 4-5-6
Table 4The influence of tooth side clearance of gear pair 12 on dynamic meshing force
Min (μm) | Max (μm) | Avg (μm) | Rms (μm) | |
Condition 4 | 3890 | 6752 | 5395 | 5424 |
Condition 5 | 3894 | 6823 | 5459 | 5488 |
Condition 6 | 3888 | 21480 | 5655 | 5826 |
4.2. The influence of load on the periodic motion
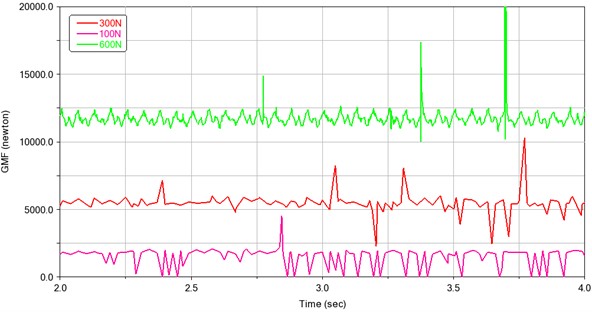
When the eccentric error and the input speed remain unchanged, apply loads of 100 N, 300 N, and 600 N respectively to the output gear (conditions 7, 8, and 9), observe the changes of the dynamic meshing force of the gears over time, and the calculation results are shown in Fig. 18.
As shown in Fig. 18, as the load on the gear increases, the dynamic meshing force also increases accordingly. This indicates that the load has a significant impact on the dynamic meshing force. When the load is 100 N, there is a significant fluctuation in the gear meshing force and a situation where the meshing force is zero (teeth separation) occurs, indicating that there is a vibration and impact phenomenon in the system with a high frequency. When the load is increased to 300 N, it is observed that the frequency of the gear's impact phenomenon significantly decreases, and when the load is 600 N, the dynamic meshing force tends to be stable. This shows that the vibration and impact phenomena of the gear system are alleviated within a certain range as the load increases. This is because a larger load causes the gear tooth surfaces to have a more closely contact, reducing vibrations and impacts caused by manufacturing errors or improper assembly. However, when the load is too large, it may lead to overload damage, bearing jamming, and other phenomena. The simulation results is consistent with the results of theoretical analysis.
Fig. 18Effect of load on dynamic meshing force
5. Conclusions
This work primarily investigates the periodic motion characteristics of the gear transmission system of a seat adjuster under different parameters. By establishing a “translation-torsion” dynamic model and employing numerical solution methods, the study delves into the effects of meshing frequency, damping, load, and backlash on the system's bifurcation and chaotic characteristics. In the research, tools such as time history curves, phase space trajectories, and Poincaré sections were comprehensively utilized for analysis. The computational results indicate that:
1) As the meshing frequency increases, the natural frequency of the system also increases accordingly, which means that the system's sensitivity to external excitation will increase, potentially exhibiting more complex dynamic behaviors. As the meshing frequency continues to increase, the system may undergo quasi-periodic motion and eventually enter a stable single-period motion state. When the meshing damping ratio 0.07, tooth backlash 20 μm, and load torque of all meshing pairs in the system are 600 N·m. To prevent the system from entering a chaotic state, the input gear speed should avoid the speed ranges of 1349 r/min-1359 r/min and 1589 r/min-2060 r/min.
2) Increasing the meshing damping ratio helps to suppress the chaotic behavior of the system and improve its stability. This provides theoretical support for improving system performance by adjusting the meshing damping ratio in practical applications.
3) As the load or input torque increases, the system's motion state transitions from chaotic to quasi-periodic or single-periodic motion. Appropriately increasing the load or torque can improve gear meshing, enhance system stability, reduce vibration, and optimize shock absorption effects. However, excessive torque may lead to excessive stress, causing issues such as gear fatigue damage.
4) An appropriate backlash value can enhance the stability and reliability of the system, avoid chaotic motion, and improve the transmission efficiency of the system. However, too small a backlash may cause the system to be too rigid, lacking sufficient damping and adaptability, thereby affecting the stability and reliability of the system; too large a backlash can cause chaotic motion in the system, which can be suppressed by loading.
5) The trend of simulation results is similar to that of numerical analysis, which verify the effectiveness of theoretical models.
The currently employed centralized parameter method for constructing the translation-rotation model neglects the mass and moment of inertia of the drive shaft. In the future, to more accurately simulate the dynamic behavior of the actual system, the mass and moment of inertia of the drive shaft can be further incorporated into the model, thereby improving its accuracy.
References
-
Z. Yan, “Analysis of methods for improving automotive seat comfort,” (in Chinese), Auto Driving Maintenance, Vol. 1, pp. 114–116, 2018.
-
J. Zhan, “A fundamental study on self-locking gear and its application in seat height adjuster,” (in Chinese), RMIT University, 2016.
-
S.-Y. Kim and K.-S. Kim, “Dynamic and noise characteristics of lead screw in vehicle power seat adjuster,” in Advanced structured materials, Cham: Springer International Publishing, 2018, pp. 43–54, https://doi.org/10.1007/978-3-319-79005-3_4
-
S. Y. Kim, J. S. Oh, and K. S. Kim, “Sound quality analysis of slide adjuster for automotive power seat using stepwise regression,” Materialwissenschaft Und Werkstofftechnik, Vol. 50, No. 5, pp. 492–501, May 2019, https://doi.org/10.1002/mawe.201900067
-
S. Kim and K. Kim, “Analysis of operating noise characteristics and contribution for automotive seat backrest adjuster,” International Journal of Engineering and Technology, Vol. 7, No. 3.3, p. 336, 2018, https://doi.org/10.14419/ijet.v7i2.33.14181
-
P. Mondal, “Investigation of the dynamic interaction between the human body and car seat using a unique simulation technique,” (in Chinese), University of East London, 2020.
-
X. Liu, “Vibration modelling and fault evolution symptom analysis of a planetary gear train for sun gear wear status assessment,” Mechanical Systems and Signal Processing, Vol. 166, p. 108403, Sep. 2021, https://doi.org/10.1016/j.ymssp.2021.108403
-
M. I. Tametang Meli, D. Yemélé, and G. D. Leutcho, “Dynamical analysis of series hybrid electric vehicle powertrain with torsional vibration: Antimonotonicity and coexisting attractors,” Chaos, Solitons and Fractals, Vol. 150, p. 111174, 2021, https://doi.org/10.1016/j.chaos.2021.111174
-
S. K. Panda, B. Patra, S. K. Panda, and P. K. Mishra, “Static and dynamic analysis of spur gear,” International Journal of Hydromechatronics, Vol. 3, No. 1, pp. 268–280, Jul. 2020, https://doi.org/10.1504/ijhm.2020.10030654
-
A. Mélot, Y. Benaïcha, E. Rigaud, J. Perret-Liaudet, and F. Thouverez, “Effect of gear topology discontinuities on the nonlinear dynamic response of a multi-degree-of-freedom gear train,” Journal of Sound and Vibration, Vol. 516, p. 116495, Sep. 2021, https://doi.org/10.1016/j.jsv.2021.116495
-
J. Song et al., “Nonlinear dynamic modeling of a gear-bearing transmission system based on dynamic meshing parameters,” Machines, Vol. 13, No. 3, p. 230, Mar. 2025, https://doi.org/10.3390/machines13030230
-
Z. Lyu, G. Wu, and Q. Wang, “Speed and gear dynamic planning and velocity tracking control considering traffic light information,” Proceedings of the Institution of Mechanical Engineers, Part D: Journal of Automobile Engineering, Vol. 239, No. 1, pp. 255–275, 2023, https://doi.org/10.1177/09544070231204647
-
D. Gao and Z. Gao, “Nonlinear dynamic characterization of sliding bearing-planetary gear system,” Journal of the Brazilian Society of Mechanical Sciences and Engineering, Vol. 47, No. 1, pp. 1–15, Dec. 2024, https://doi.org/10.1007/s40430-024-05295-x
-
S. Li, “Research on the dynamic characteristics of the milling wheel system of a double wheel groove milling machine,” (in Chinese), Wuhan University, 2014.
-
Q. Zhang, “Dynamic characteristics analysis and experimental study of a certain transmission,” (in Chinese), Chongqing University, 2014.
-
S. Wu, “Impact of mesh errors on dynamic load sharing characteristics of compound planetary gear sets,” (in Chinese), Journal of Mechanical Engineering, Vol. 51, No. 3, p. 29, 2015, https://doi.org/10.3901/jme.2015.03.029
-
H. Zhang, H. Shang, and C. Yang, “Influence of floating support on the dynamic characteristics of compound planetary gear set,” Journal of Vibroengineering, Vol. 24, No. 2, pp. 272–289, Mar. 2022, https://doi.org/10.21595/jve.2021.22206
-
W. L. Zhu, “Research on nonlinear dynamic characteristics of composite planetary gear transmission system considering manufacturing errors,” (in Chinese), Wuhan University, 2017.
-
R. W. Cornell, “Compliance and stress sensitivity of spur gear teeth,” Journal of Mechanical Design, Vol. 103, No. 2, pp. 447–459, Apr. 1981, https://doi.org/10.1115/1.3254939
-
Z. Zhao, “Research on typical fault vibration characteristics of gear transmission system,” (in Chinese), Lanzhou University of Technology, Dec. 2020.
-
H. Shi, “Analysis of dynamic characteristics of rotor with cracks and parameter identification,” Hangzhou Dianzi University, Jan. 2018.
About this article

The author would like to express gratitude to the 2026 Hubei Provincial Science and Technology Plan Project: the 2026 Science and Technology Talent Service Enterprise Project, “Research and Development of Key Technologies for Micro Ball Screw in Humanoid Robot Dextrous Hands” (Project No. RCFWQY202600051)
The authors would like to thank Hubei Provincial Natural Science Foundation Project of China for the financial and technological support given to this study through the project “Micro motion wear mechanism and fatigue prediction of electric vehicle drive connections under complex operating conditions” (Grant numbers 2024AFD031).
This work was supported by Project of the Ministry of Industry and Information Technology of China (Grant numbers 2024ZY02003) and Key Project of Scientific Research Plan of Hubei Provincial Department of Education in 2023 (Grant numbers D20232603)
The authors would like to thank the Key Project of Scientific Research Plan of Hubei Provincial Department of Education of China (Grant numbers D20232603).
The authors would like to thank the Xiangyang City Research and Development Project (Grant numbers 2022ABH006560).
Author Wei Xiong has received research support from Hubei New Torch Technology Co., Ltd.
The datasets generated during and/or analyzed during the current study are available from the corresponding author on reasonable request.
Haibo Zhang mainly contributed in deriving the gear dynamics equation of the seat height adjuster, and Huajian Shang worked to solve the partial differential equations, and Dr. Xiong contributed in modeling the dynamic model of meshing pair, and Qiao Pang mainly contributed in the literature review and numerical calculation methods.
The authors declare that they have no conflict of interest.

