Abstract
Soft rock tunnels excavated under high ground stress are particularly vulnerable to seismic loading due to their low stiffness and complex rock-lining interaction. This study presents a performance-based seismic evaluation of a deep-buried soft-rock tunnel using Incremental Dynamic Analysis (IDA) implemented in MIDAS GTS NX. A two-dimensional numerical model of a semicircular tunnel with a diameter of 10 m and a burial depth of 500 m is subjected to incrementally scaled earthquake records representing moderate and strong seismic excitations. Key engineering demand parameters, including displacement, base shear, and drift ratio are evaluated, and IDA-based fragility curves are developed to quantify damage exceedance probability. Unlike most exciting tunnel seismic studies that rely on linear or single-intensity dynamic analyses, this study integrates IDA with fragility assessment to systematically capture nonlinear response evolution and record-to-record variability of deep-buried soft rock tunnels under high ground stress. The results indicate pronounced nonlinear deformation and amplification of internal forces with increasing seismic intensity, with maximum displacement and base shear increasing by approximately 90 % and 50 %, respectively. The findings demonstrate the effectiveness of IDA as a vibration-based performance evaluation tool for underground structures and provide new insights for the seismic design of tunnels in high-stress and seismically active regions.
Highlights
- IDA revealed strong nonlinear seismic behavior in deep-buried soft rock tunnels, with response transitioning from elastic to yielding as PGA increased, highlighting the limitations of conventional linear seismic analysis.
- Seismic intensity amplification caused major demand growth, with maximum displacement increasing by up to ~90% and base shear by ~50% when PGA rose from 0.15 g to 0.5 g.
- Fragility analysis showed sharply increased damage probability under strong ground motions, indicating earlier yielding and reduced safety margins for tunnels in high ground stress soft rock.
- Results confirm IDA as an effective performance-based tool for capturing record-to-record variability and supporting probabilistic seismic design of underground tunnels in high-stress, seismic regions.
1. Introduction
Soft rock tunneling is difficult especially under high ground stress conditions resulting in possible instability caused by stress variations in the tunnel lining [1, 2]. In addition, tunnels are prone to varying forms of seismic risks that exert greater pressure than otherwise [3, 4]. Hence, the seismic design of soft rock tunnels under high ground stress is important for improving their stability during earthquakes [5, 6].
High ground stress soft rock tunnels are an important topic in the current engineering practice especially in seismically active regions which require seismic investigation [7, 8]. The response of tunnels to ground movement caused by tunnels due to earthquakes is not an easy task. To ensure safety, tunnels should be subjected to seismic investigations to ensure the safety of both the structure and its users [9, 10]. The consequences of tunnel failure can have severe consequences such as loss of lives, property destruction as well as financial loss [3].
To ensure the safety and stability of high ground stress soft rock tunnels under seismic loading, seismic analysis is required for their design and construction [11, 12]. Tunnel linings can be significantly damaged by seismic activity, which can lead to failure and collapse [6, 13]. High ground stress soft rock tunnels are difficult to study because of the complex processes surrounding the interaction of the rock mass and tunnel lining under seismic loading [4]. Soft rock tunnels are particularly vulnerable to seismic damage because of their low stiffness and high ground stress levels [14, 15].
The growing need of transportation systems, water delivery, energy sources, and utility of the urban areas has driven the intensive use of underground buildings, more so tunnels as the most viable infrastructure in the populated and hilly areas [16-19]. Rapid urbanization and the population increase have also contributed to the intensified use of subsurface space where the surface space turns out to be limited and expensive [20, 21]. Seismic safety is a vital design factor in tunnels because of the seismic activity not only in terms of high in-situ ground stresses but also, dynamic loading due to the occurrence of earthquakes in the area [3]. True to their name, the underground tunnels are in direct contact with the surrounding soil or rock mass, which means that their seismic behavior is determined by non-trivial mechanisms of soil-structure interaction, which require special analytical and numerical methods to be able to assess their performance reliably [12, 22].
Similar to any other type of civil engineering design, the goal of seismic design is to offer the structure the ability to withstand the loads, displacements, and deformations that are applied to it [9]. Calculating how a building or other structure will react to earthquakes is called seismic analysis, which is a subset of the structural analysis. Because the initial criteria for seismic engineering were only defined at the start of the 20th century and the majority of key contemporary concepts only emerged in the previous 50 years, seismic engineering is a relatively recent field of structural engineering [10]. Seismic issues with underground structures are frequently disregarded, even though this cannot be used to justify ignoring seismic action [23-26]. This is because the seismic performance of underground structures is generally believed to be superior to that of surface structures.
Although tunnels often outperform aboveground structures during earthquakes, the damage to some significant structures during earthquake events, such as the 1995 Kobe earthquake in Japan, 1999 Chi-Chi earthquake in Taiwan, 1999 Bolu earthquake in Turkey, 2004 Baladeh earthquake in Iran, 2004 Niigata earthquake in Japan and most recently, the 2008 Sichuan earthquake in China, has highlighted the need to account for seismic loads in the design of underground structures [27-30].
In that regard, the current research seeks to assess seismic behavior of high ground stress deep-buried soft rock tunnel by applying Incremental Dynamic Analysis (IDA) framework. A two-dimensional numerical model is constructed in MIDAS GTS NX to examine the nonlinear seismic behavior of the tunnel due to escalating earthquake levels. The analysis targets the primary parameters of engineering demands, such as the displacement, base shear, and drift ratio, and the fragility analysis is used to measure the likelihood of exceeding the damage during moderate and strong seismic motions. The outcomes are aimed to give the evidence of the vulnerability of soft rock tunnels and help the implementation of the performance-based seismic design techniques of underground structures in high-stress and seismically active regions.
The uniqueness of the current study is that the Incremental Dynamic Analysis (IDA) framework is used to address the issue of seismic behaviour of deep-buried soft rock tunnels that are under high ground stress conditions. Contrary to the majority of the known studies that are based on linear or single-level dynamic analysis, this research is a systematic study of the non-linear seismic response and record-to-record variation of tunnel behavior during incrementally scaled ground motions. Moreover, the paper incorporates IDA-based fragility analysis to determine the likelihood of damage exceedance of the important engineering demand parameters, which is a performance-based analysis that is uncommonly done on tunnels through the large burial depths of the soft rocks. The results provide novel understanding of the processes of degradation of stiffness, amplification of deformation, and susceptibility of underground tunnels in weak rock formations, which is added to the development of performance-based seismic design of underground infrastructure.
2. Incremental dynamic analysis
To evaluate the structural performance under seismic stresses, incremental dynamic analysis (IDA) also known as dynamic pushover, has been developed in several forms [31]. One of the best approaches for examining the impacts of different earthquakes on the behavior of structures is incremental dynamic analysis, which is a commonly used technique for evaluating structural performance under earthquake excitations [32-34]. The collection of ground motion data allows for the direct examination of record-to-record variability in structural response [35]. Incremental dynamic analysis is the foundation of seismic performance evaluation and seismic risk assessment [36]. The widely used structural performance assessment technique is the Incremental Dynamic Analysis (IDA), which involves the assessment of structures with earthquake ground motions at increasingly higher magnitudes [37, 38].
According to D'Ayala et al. (2015) [39], this method effectively calculates the model’s elastic, yielding, nonlinear elastic and global dynamic stability responses. Incremental dynamic analysis is used to forecast the seismic behavior under incrementally scaled ground movements [40, 41].
The most crucial step in conducting an incremental dynamic analysis is to choose an appropriate intensity measure and engineering demand parameter. This analysis represents the relationship between the intensity measure (IM) and the engineering demand parameter (EDP) for the structure. A collection of earthquakes was selected and applied to the structures using the IDA approach [42].
The maximum seismic response of a structure depends strongly on the characteristics of the ground motion used in dynamic analysis. For a given structural system with fixed properties, each earthquake record applied as base excitation can produce a different peak response because of variations in amplitude, frequency content, duration, and phasing. When only a single ground motion is used, the resulting maximum response reflects the behavior under that specific record and cannot be considered representative of the overall seismic demand.
As additional ground motions are considered, a range of response values emerges, revealing the inherent record-to-record variability of seismic demand. With each new input motion, the governing response may increase or decrease, indicating that the critical demand is not known in advance and cannot be reliably captured by a small number of analyses. When a sufficiently large set of ground motions is used, the collection of peak responses forms a stable distribution or envelope, and the identified maximum demand becomes a more reliable estimate of the true extreme response for the chosen hazard level.
According to Soysal and Arici (2014) [43], the intensity measure (IM) is a positive scalar that depends on the strength of the ground motion and increases gradually with the scaling factor. By plotting a judicially selected peak structural response quantity or “engineering demand parameter” (EDP) versus a gradually increasing seismic “intensity measure” (IM), accounting for the uncertainty of the strong ground motion, IDA aims to map the inelastic behavior of yielding structures subjected to strong ground motions [44]. According to Marsed (2017) [31], incremental dynamic analysis considers a structural model as it is affected by one or more ground motion records, each scaled to different degrees of intensity measures.
To carry out an incremental dynamic analysis, the proper values for parameters such as the intensity measure (IM) of ground movements and the damage measure (DM) must be selected.
Intensity Measure (IM) – The most fundamental metrics for the intensity measure are the peak ground acceleration (PGA) and reaction acceleration Sa(Ti, ξ%). As far as possible, a good IM should not be dependent on earthquake data; however certain factors, particularly the PGA, are. According to the growth or reduction of the accelerogram, this number is a function of the initial accelerogram [45]:
where is a function of a scaled ground motion record, is the accelerogram (ground motion time history), and is the scale factor.
Damage Measure (DM) – Positive numerical values of the damage index indicate that a structure is responding to seismic stresses. In other words, according to Hassanieh et al. (2012) [46], the DM value is a determined number that may reflect a structure's reaction in a dynamics study.
In the elastic region, where it is directly proportional to IM-DM, the IDA curve starts as a straight line [38]. The line begins to curve at larger scaling factors when the seismic loading is sufficient to trigger the nonlinear yielding of the structure. The reaction of a structure to various earthquake intensities is represented by a single IDA curve. Several IDA curves can be displayed on the same graph, each depicting how the structure responds to various seismic events. The different responses of the structure demonstrate the importance of using several IDAs.
Structural response to seismic loading becomes non-linear with increase in intensity of ground motion and this non-linearity depends on the response measure chosen as well as the intensity measure chosen. At low seismic intensity, the structure is largely elastic in behavior, and the correlation between seismic intensity and structural response is monotonic and smooth and predictable. Various response measures within this range have a tendency to show low variations and as the intensity increases, the response also increases proportionately.
Beyond the elastic threshold, inelastic behavior occurs and the intensity response association becomes more complicated. The processes of yielding, loss of stiffness, loss of strength, and redistribution of the internal forces are nonlinear and provide a great level of dispersion to the observed responses. Multiple response values can be met at the same seismic intensity, which is sensitive to the nature of the ground movements and nonlinear nature of the structure. This dispersion grows as the demand becomes more inelastic and it is the characteristic of nonlinear seismic response.
The measures of structural response could display different trends with the increase of intensity. Certain response measures continue to increase monotonically with decreasing slope owing to energy dissipation and yielding, whereas others can be monotonic owing to alteration in dominant response modes, damage localization, or interaction between structural parts. Subsequently, the appearance of a smooth, variability, and explainable relationship between intensity and response depends on the nature of the response measure.
On the same note, measurement of intensity can result in varying degrees of dispersion and efficiency in prediction of structural response. Some of the measures of intensity are more strongly related to particular quantities of response, giving smaller scatter and tighter relationships, others more widely spread, especially in the inelastic range. This tendency shows the need to utilize suitable combinations of the measures of intensity and engineering demand parameters in the context of conducting seismic performance assessment, fragility analysis, or performance-based design because such decisions have a direct impact on the reliability and robustness of the predicted structural demands.
3. Numerical simulation methodology
3.1. Model development
The numerical model creation process is fundamental for determining the true effects of seismic activity on tunnels built within soft rock formations under high ground stresses. The complete numerical model combines the necessary information about geological features with material data, boundary constraints, and seismic force conditions. The study was based on the use of Midas GTS NX in a simulation model to investigate the tunnel response to seismic forces.
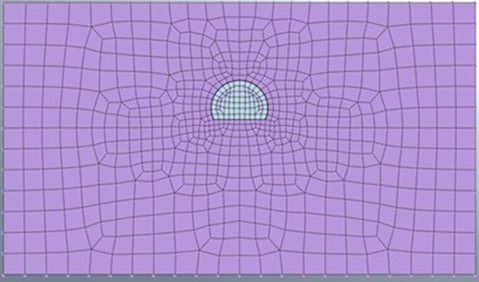
The simulation domain contained a semicircular tunnel with a diameter of 10 m and an underground depth of 500 m in the soft rock strata. The choice of the semicircular tunnel section located at a depth of 500 m is justified based on the precedents of the implementation of large-scale underground infrastructure projects in high-stress soft rock environments. An example is the Songshan Lake Tunnel in China, which is a part of the South-to-North Water Diversion Project and has a deep tunnel with a burial depth of up to 400 m or higher in weak surrounding rock, such as mudstone and shale [2]. Similarly, some sections of the Dahuofang Water Conveyance Tunnel in Liaoning Province have depths of more than 500 m and are dominated by soft rock formations with high-stress geometries, preferably circular, as they tend to apply uniform stress and are stable with load excitation [1]. According to geological explorations of these projects, the depth of burial to the rock formation is rated softer, such as weathered sandstone, mudstone, and siltstone which are high in mountainous seismic regions. This supports the realism of the 500 m depth adopted in the current model. Although horseshoe-shaped profiles are typical of transport tunnels, circular profiles are commonly developed in water conveyance tunnels and water mechanical high-pressure systems because they are much more advantageous in stress distribution with high ground pressures. Seismic waves cause rock masses to exhibit low strength and high deformability, along with time-dependent characteristics that affect their response. The numerical model domain requires ample dimensions to reduce boundary effects; thus, it extends five times beyond the tunnel diameter on all sides and reaches twice the depth of the tunnel. Fig. 1 shows the two-dimensional dimensions used in the numerical simulations.
The numerical model assumes that the surrounding soft rock mass behaves as an isotropic continuum, meaning that its mechanical properties are identical in all directions. This assumption is consistent with commonly adopted approaches in preliminary seismic tunnel analyses where large-scale heterogeneity is averaged out for stability and convergence.
Fig. 1Two-dimensional geometry of the numerical model developed in MIDAS GTS NX
The developed numerical model was bounded by boundary conditions intended to resemble real-life geomechanical constraints and seismic loading patterns.
The side boundaries were set along the sides to represent the restriction of the surrounding rock mass. The bottom layer was fixed in all directions, which were related to a fixed bedrock or bottom layer that was immovable. The nature of the top free surface served as a model to allow free deformation and uplift caused by seismic forces. The loading due to seismic activity was simulated by placing time-history ground motion loads at the base of the model in both the horizontal () and vertical () directions. This develops multidirectional ground movements that may occur in real earthquake situations.
The numerical model used the material properties presented in Table 1, including the density, Young’s modulus, Poisson’s ratio, cohesion, friction angle, and damping parameters.
3.2. Seismic input
The seismic performance of buildings exposed to earthquakes of various intensities is assessed using highly accurate and computationally expensive Incremental Dynamic Analysis (IDA) seismic analysis. Incremental dynamic analysis is a crucial method for analyzing the response of buildings to earthquakes. To obtain the global collapse capacity of the structure, an incremental dynamic analysis entails performing a number of nonlinear dynamic studies, during which the intensity of the ground motion exhibited for the assessment is progressively increased. Two separate peak ground accelerations were used for the IDA. A set of three ground movements was used to select the IDA recordings. The MIDAS GTS NX program was used to perform incremental dynamic analysis. The results from the IDA were produced by adding 0.1 g to the nonlinear dynamic analyses. The IDA curves in a 2D graph are represented as the intensity and damage measurements on the vertical and horizontal axes respectively. The definition of earthquake data that will be utilized in numerical model computations is crucial for the incremental dynamic analysis. According to the recommendations of GB50111-06, three earthquake recordings were selected for this analysis.
Table 1Material properties of the soft rock used in the numerical model
Material properties | Value |
Young’s modulus | 10 GPa |
Poisson’s ratio | 0.25 |
Density | 2.5 t/m3 |
Cohesion | 10 kPa |
Friction angle | 30° |
Damping ratio | 0.05 |
Note: The soft rock is assumed to behave as a homogeneous and isotropic continuum. Material parameters are representative values commonly adopted for weak rock formations in deep-buried tunnel analyses | |
Two sets of data were examined for the two potential seismic regions. The analysis was performed on peak ground accelerations of 0.5 and 0.15 g. The selected sets of earthquake recordings are defined in the program SeismoSoft and are displayed in Fig. 2.
Fig. 2Selected earthquake ground motion records for incremental dynamic analysis with peak ground accelerations of 0.5 g and 0.15 g
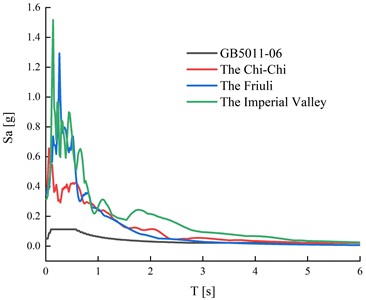
a) 0.5 g
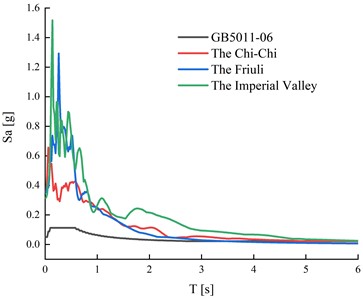
b) 0.15 g
4. Numerical results and discussion
Incremental Dynamic Analysis (IDA) implemented in MIDAS GTS NX is used to evaluate the seismic performance of the soft rock tunnel under peak ground accelerations (PGAs) of 0.15 g and 0.5 g, representing moderate and strong earthquake scenarios, respectively. Three sets of ground motion records (EQ1, EQ2, and EQ3) were applied to the 2D tunnel model to capture record-to-record variability in the seismic response. The key engineering demand parameters (EDPs) discussed in the analysis were the maximum displacement, base shear, and drift ratio; these parameters are suitable for indicating the deformation demand, internal force response, and overall ductility of the structure effectively.
4.1. Displacement response
The time-history response of the two displacement responses of the PGA is illustrated in Fig. 3. All earthquake records also indicated much greater displacements under a more vigorous 0.5 g excitation. For example, for EQ1, the maximum displacement reaches 0.1348 m at 0.5 g, representing an increase of approximately 90 % compared to the response at 0.15 g (0.0709 m). Likewise, EQ2 yielded a maximum displacement of 0.1455 m (66.48 per cent higher than 0.0874 m at 0.15 g), whereas EQ3 yielded 0.1536 m, or approximately 90.81 per cent higher than 0.0805 m at 0.15 g.
This nonlinear increase in displacement indicates that tunnel deformation becomes highly sensitive to PGA once the elastic capacity is exceeded. As shown in Fig. 4, this transition is also confirmed by the fact that the first straight line of the IDA curves corresponds to the elastic region, and beyond that, a curvature is observed as the structure passes to the yielding stage. The nonlinear branch signifies wear-off of the lining and rock interface by progressive stiffness degradation due to plastic deformation. Such findings emphasize the ductile design nature, especially in deep-buried tunnels that are highly prone to seismic excitation in areas where the confinement pressure is high and the stiffness of the soft rock is low.
Fig. 3Time-history displacement responses under peak ground accelerations of 0.5 g and 0.15 g
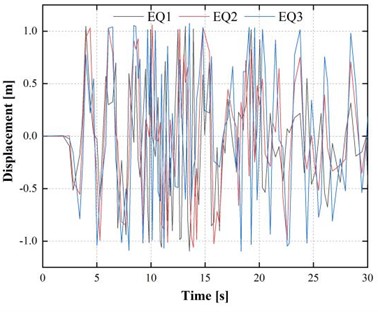
a) 0.5 g
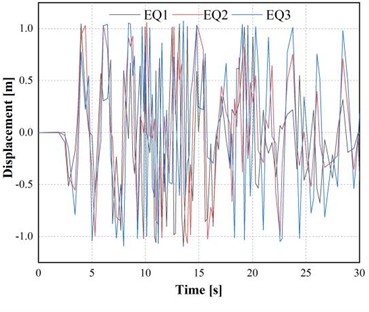
b) 0.15 g
Fig. 4Incremental dynamic analysis (IDA) curves for maximum displacement under peak ground accelerations of 0.5 g and 0.15 g
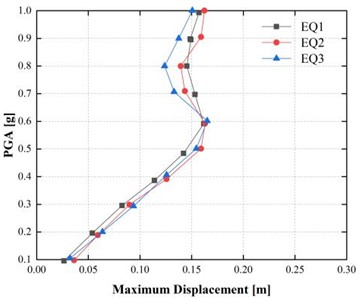
a) 0.5 g
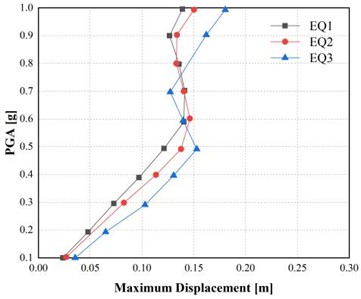
b) 0.15 g
4.2. Base shear response
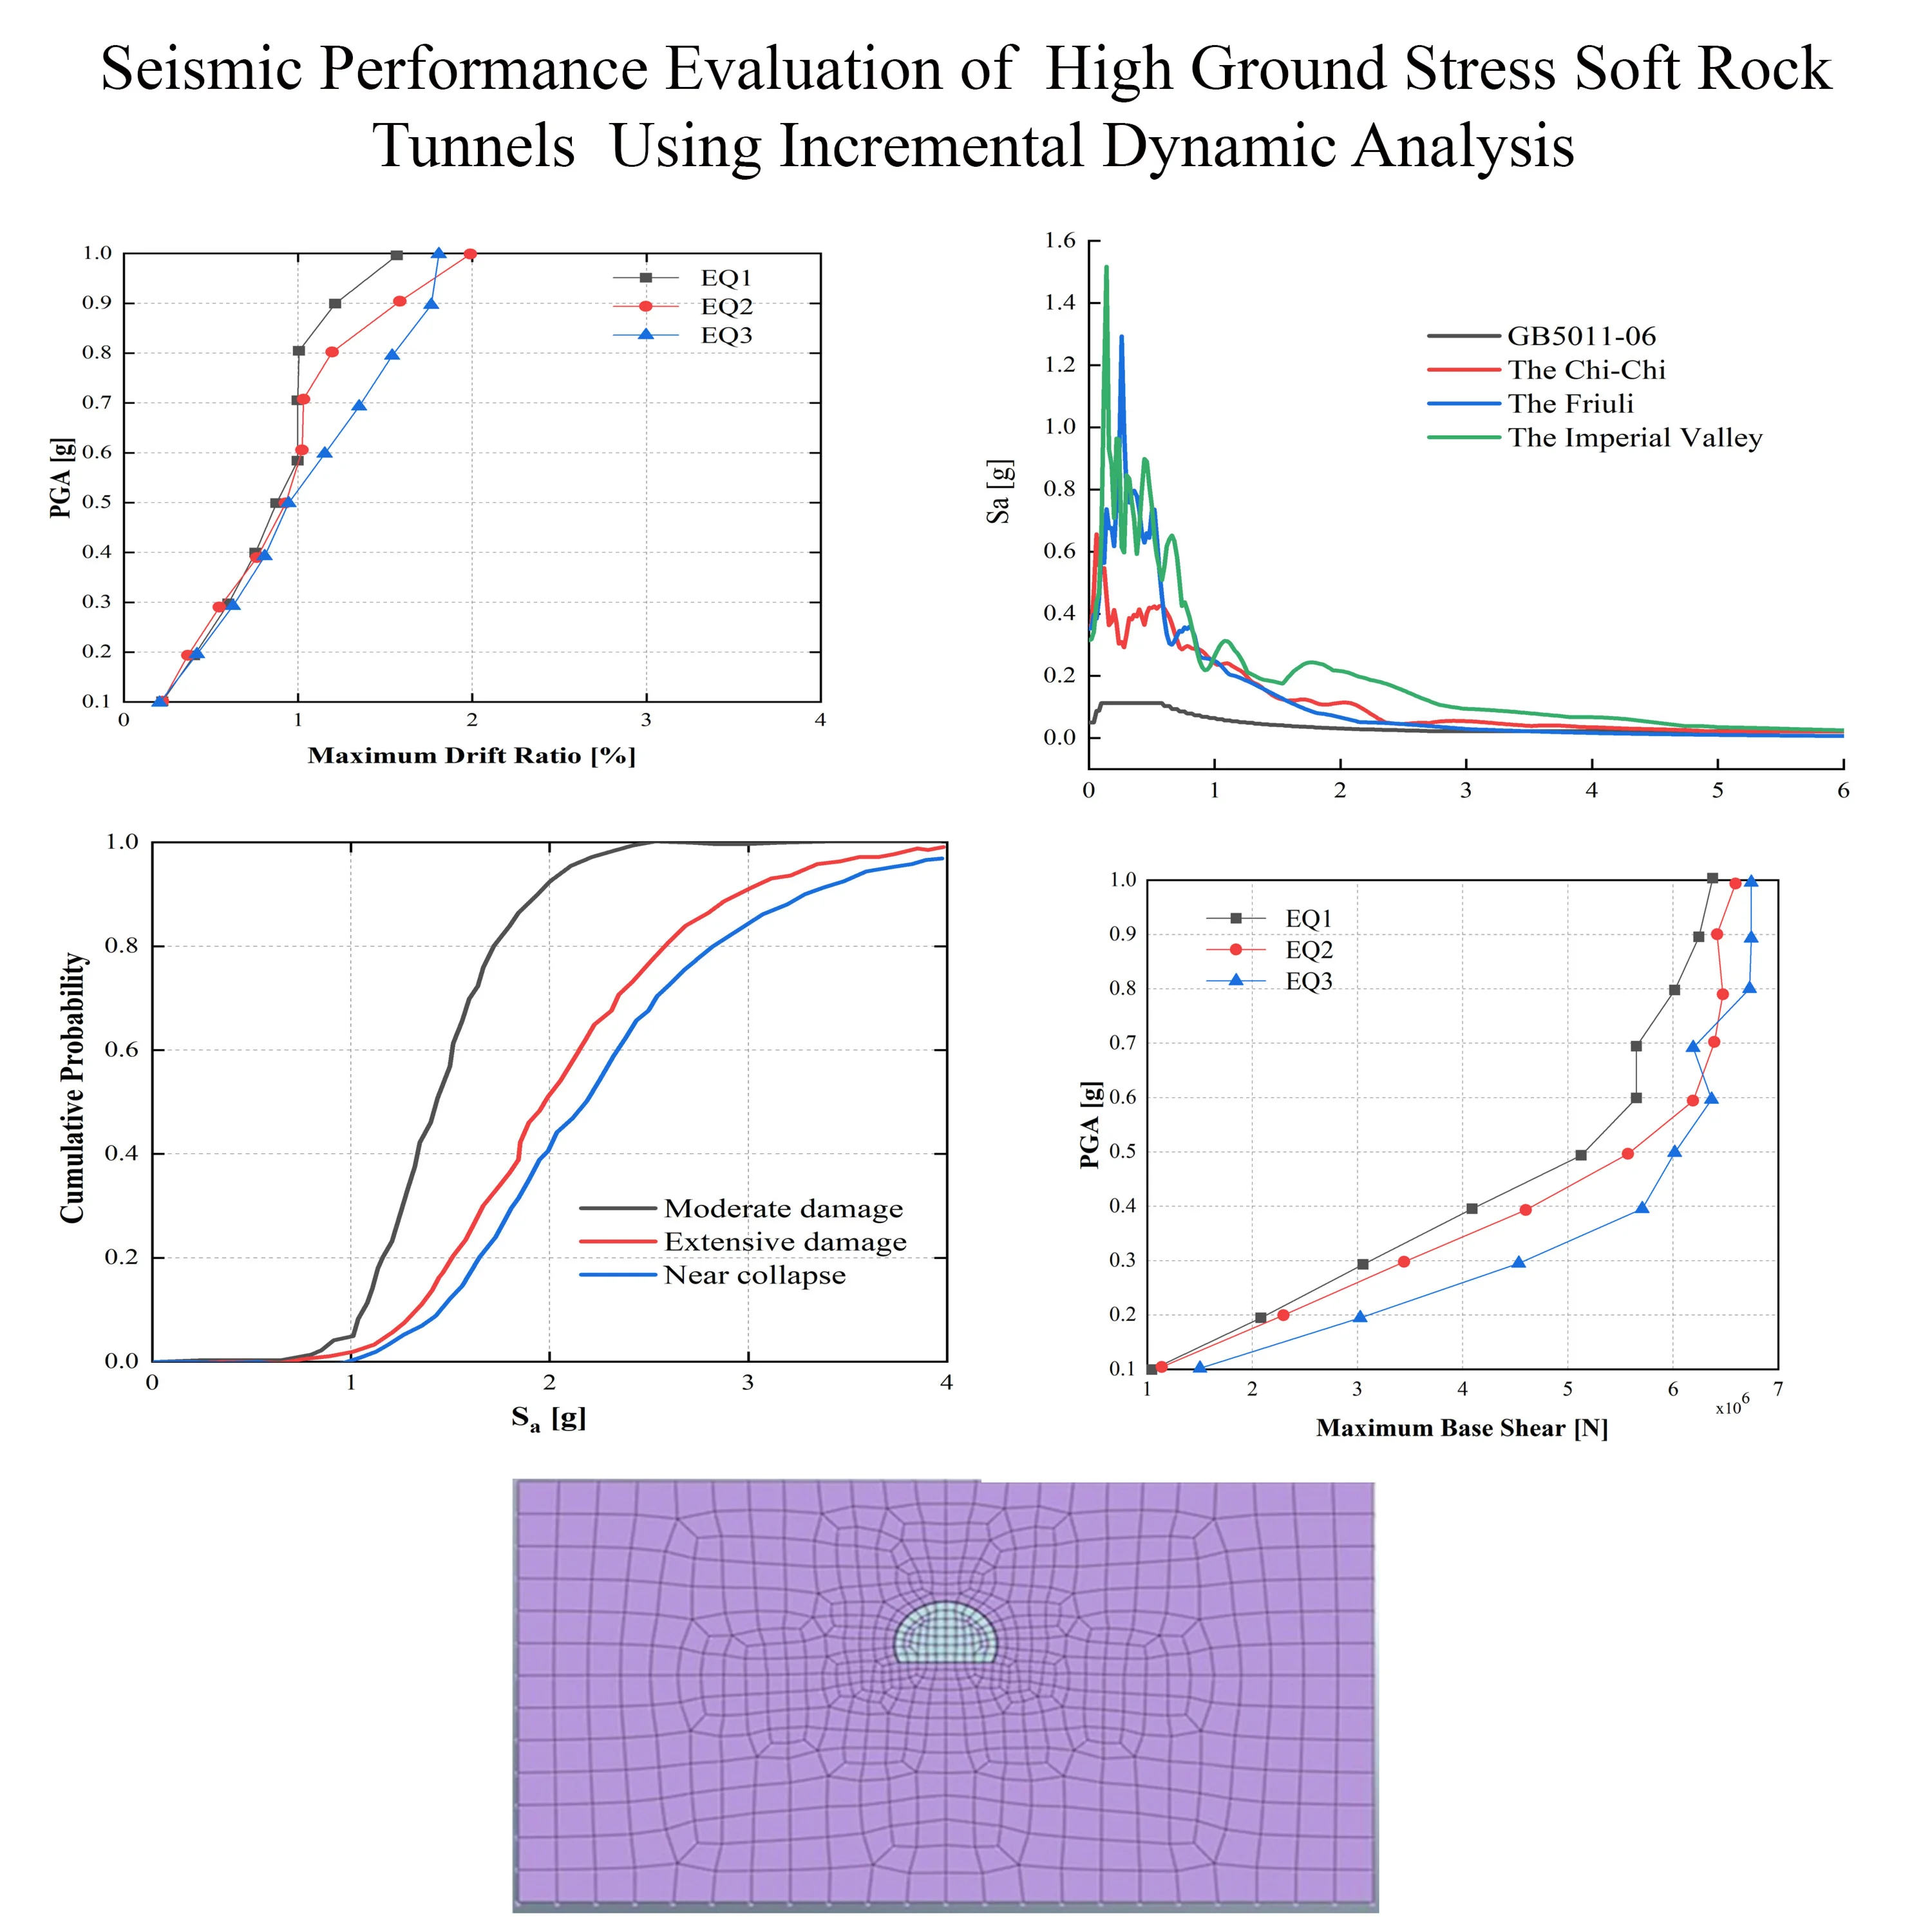
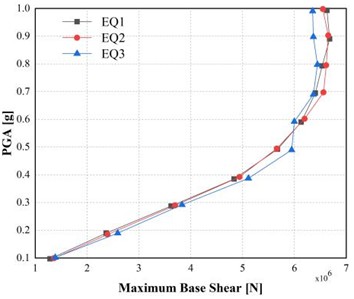
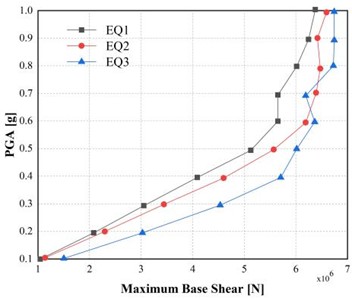
Fig. 5 shows the variation of maximum base shear under the two PGA levels. The shear force response adhered to a comparable nonlinear escalation rate to that of the displacement. For EQ1, the maximum base shear reached 2.33×10⁶ N, which was 46.54 % higher than the 1.59×10⁶ N corresponding to 0.15 g. For EQ2, the maximum base shear increases to 2.12×10⁶ N at 0.5 g, corresponding to an increase of approximately 46 % compared to the response at 0.15 g, and EQ3, 2.75×10⁶ N, which is 51.10 percent more than the 1.82×10⁶ N at 0.15 g.
This increase in base shear indicates that stronger seismic excitation significantly amplifies internal stresses in the tunnel lining and surrounding rock mass. The results also indicate that local zones of stress concentration occur around the tunnel crown and invert as the PGAs increase, which is consistent with earlier research on the seismic behavior of tunnels [11, 6, 4]. The base shear response under the condition of increasing accelerations increased, which implies the necessity to provide stronger support systems or composite linings that can ensure effective redistribution of the shear demands over the circumference of the tunnel.
Fig. 5Incremental dynamic analysis (IDA) curves for maximum base shear under peak ground accelerations of 0.5 g and 0.15 g
a) 0.5 g
b) 0.15 g
4.3. Drift ratio behavior
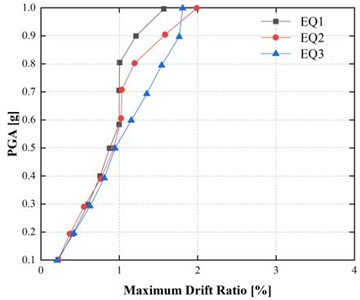
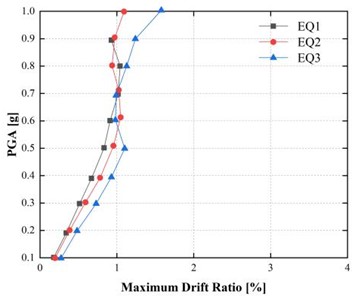
The maximum drift ratio, which is a key indicator of the deformation demand relative to the structural height, is presented in Fig. 6. The findings indicate that the drift ratio gradually and consistently increased as the ground acceleration increased. For EQ1, the drift ratio increased from 1.85 % at 0.15 g to 2.04 % at 0.5 g (a 10.27 % increase). For EQ2, it increased by 18.90 % (from 1.27 % to 1.51 %), and for EQ3, it increased by 22.29 % (from 1.36 % to 1.75 %).
Fig. 6Incremental dynamic analysis (IDA) curves for maximum drift ratio under peak ground accelerations of 0.5 g and 0.15 g
a) 0.5 g
b) 0.15 g
The smaller relative increase in drift ratio compared to displacement and base shear indicates the onset of nonlinear deformation in the tunnel lining. Drift ratios approaching or exceeding 2 % may lead to cracking and joint opening in the tunnel lining particularly in soft rock where tensile strength is limited. This highlights the role of flexible jointing and secondary lining reinforcement of tunnels built in high seismic areas.
4.4. Fragility analysis and damage probability
Fragility curves are developed to quantify the probability of exceeding specific damage states. There are several ways to determine this likelihood, but incremental dynamic analysis is one of the most promising. For each limit state, the cumulative fragility curves were expressed as a lognormal function of the average reaction to earthquakes from the IDA curves. Fragility analysis was performed by processing the IDA results into cumulative probability curves, as shown in Fig. 7. These fragility curves represent the probability of the structure exceeding various damage limit conditions as a measure of the intensity of the ground motion (PGA). In both cases, at 0.15 g and 0.5 g, the fragility curves show a distinct movement in the direction of high probabilities of damage increasing with intensity.
Fig. 7Fragility curves representing damage exceedance probability under peak ground accelerations of 0.5 g and 0.15 g
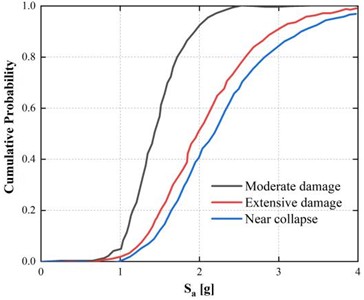
a) 0.5 g
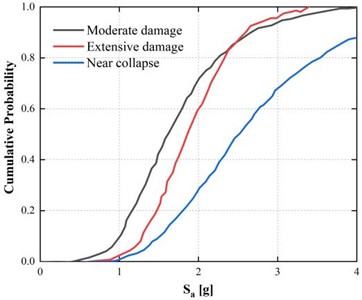
b) 0.15 g
Fig. 7(a) shows that at a PGA of 0.5 g, the fragility curve shifts leftward, indicating earlier yielding and a reduced elastic response range. The steeper gradient of the curve suggests that when yielding commences, the structure rapidly increases the damage states and has limited ductility when subjected to strong excitation. In contrast, in the case of 0.15 g PGA (Fig. 7(b)), the flatter curve implies a wider range of elastic response and a lower likelihood of exceeding the damage limits.
These findings affirm that when the ground stress is high and the rocks are soft, the tunnel lining undergoes a brittle-ductile change as the seismic pressure increases. The obtained fragility functions agree with the results of Liu et al. (2021) [36] and Antoniou et al. (2020) [13] which show that tunnels buried deep underground with low masses of surrounding rocks are likely to experience high rates of stiffness deterioration during repeated seismic cycles.
4.5. Engineering implications
The trends in the responses of displacement, shear, and drift indicate several important engineering insights. The behavior of tunnels during seismic loading is extremely nonlinear, and the elastic design technique is insufficient to ensure safety, even under high PGA conditions. Second, the enclosing soft rock, which is advantageous to the stability of the entire mass in quiescent circumstances, may increase shear strains in the case of seismic shaking as a result of its weakness to dissipate energy. Third, the vulnerability is demonstrated, which makes it important to introduce performance-based design frameworks, where design thresholds are formulated in probabilistic form (e.g., the probability of specific damage states occurring).
Overall, the results confirm that Incremental Dynamic Analysis provides a rigorous and efficient framework for quantifying the seismic vulnerability of tunnels excavated in soft rock under high ground stress. IDA captures record-to-record variability and nonlinear response development, making it possible for engineers to discover the critical acceleration thresholds of structural and serviceability limit states.
Overall, the results demonstrate that seismic loading leads to a nonlinear escalation of the deformation and internal force demands in deep-buried soft rock tunnels. An increase in PGA by 0.15-0.5 g almost doubled the displacements, the base shear also increased by approximately 50 %, and the drift ratios also increase by 10-22 %. Fragility analysis has proven that underground structures are more likely to enter the damage states during strong ground motions, and IDA-based design is essential for ensuring the seismic resiliency of underground structures.
4.6. Experimental validation
The current research is grounded on numerical simulations, but the results obtained can be analyzed in a qualitative and quantitative manner by the methods of the experiment described in the literature and by the test programs that can be realized in the future. Shaking table tests on physical model systems at reduced scale (i.e. built using equivalent material methods) provide a feasible alternative to test the nonlinear deformation trends and stiffness deterioration, as well as the progression of damage, trends in the numerical analyses. Similarity laws can be used in such tests to recreate stress conditions and dynamic loading effects that are similar to tunneling in deep-buried soft rock, and therefore, compare displacement amplification with failure under deep-buried tunnels, against the displacement amplification and failure under deep-buried tunnels as predicted by the IDA framework.
Centrifuge modeling also offers a useful experimental research platform to simulate the high in-situ stress conditions and provide the possibility of subjecting tunnel linings in soft ground to scaled seismic excitation. Quantifiable deformations, such as lining deformation, redistribution of stresses and amplification of accelerations could be directly compared to numerical predictions of these deformations at the same level of seismic intensity. Further, field monitoring of instrumented tunnels in areas of seismic activity can also be a useful reference in validating response trends especially when it comes to localizing deformation and damage limits due to strong ground motions.
Although a full examination of the experimental validation of this situation under high ground stress and strong seismic excitation is difficult to undertake, the fact that the characteristics of the numerical response in this study and those reported in the literature of experimental and field studies are quite close convincing the soundness of the numerical framework used. Experimental research specifically aimed at replicating the deep-buried soft rock conditions would be a valuable addition to the current work and would increase the confidence in the relevance of the IDA-based seismic performance assessment of underground tunnels.
5. Conclusions
This study presented a performance-based seismic assessment of a deep-buried soft rock tunnel under high ground stress using an Incremental Dynamic Analysis (IDA) framework. By combining nonlinear dynamic analysis with fragility assessment, the proposed approach provides a systematic method for evaluating tunnel response across a wide range of seismic intensities, overcoming the limitations of traditional linear and single-level seismic analyses.
The results revealed pronounced nonlinear behavior of the tunnel as seismic intensity increased, including significant amplification of displacement, base shear, and drift ratio, indicating progressive stiffness degradation and localized yielding of the tunnel lining and surrounding rock mass. The IDA-based fragility analysis demonstrated that strong ground motions substantially increase the probability of exceeding damage limit states, highlighting the vulnerability of deep-buried tunnels excavated in weak rock formations under high in-situ stress.
The main contribution of this study lies in the application of an IDA-based fragility framework to deep-buried soft rock tunnels, providing a vibration-based, probabilistic assessment of seismic performance that captures nonlinear response evolution and record-to-record variability. The findings support the adoption of performance-based seismic design approaches for underground structures in high-stress and seismically active regions.
Future research should extend the present work to three-dimensional modeling, incorporate advanced constitutive models for rock–lining interaction, and investigate the influence of tunnel geometry and support systems to further enhance the seismic resilience of underground infrastructure.
References
-
L. Chen et al., “Large deformation mechanism and support countermeasures of deep-buried soft rock tunnels under high geostress state,” Buildings, Vol. 15, No. 5, p. 704, Feb. 2025, https://doi.org/10.3390/buildings15050704
-
X. Wu and N. Lv, “Seismic performance of soft rock tunnel under composite support conditions,” Journal of Vibroengineering, Vol. 26, No. 3, pp. 643–656, May 2024, https://doi.org/10.21595/jve.2023.23565
-
Y. M. A. Hashash, J. J. Hook, B. Schmidt, and J. I.-Chiang Yao, “Seismic design and analysis of underground structures,” Tunnelling and Underground Space Technology, Vol. 16, No. 4, pp. 247–293, Oct. 2001, https://doi.org/10.1016/s0886-7798(01)00051-7
-
G. Tsinidis et al., “Seismic behaviour of tunnels: From experiments to analysis,” Tunnelling and Underground Space Technology, Vol. 99, p. 103334, May 2020, https://doi.org/10.1016/j.tust.2020.103334
-
H. Yu, Y. Yuan, and A. Bobet, “Seismic analysis of long tunnels: A review of simplified and unified methods,” Underground Space, Vol. 2, No. 2, pp. 73–87, Jun. 2017, https://doi.org/10.1016/j.undsp.2017.05.003
-
D. Singh, S. Karumanchi, A. Mandal, Y. Katpatal, and A. Usmani, “Effect of earthquake excitation on circular tunnels: Numerical and experimental study,” Measurement and Control, Vol. 52, No. 7-8, pp. 740–757, May 2019, https://doi.org/10.1177/0020294019847705
-
P. Psarropoulos, “Impact of tunnels and underground spaces on the seismic response of overlying structures,” in Tunnel Engineering – Selected Topics, IntechOpen, 2020, https://doi.org/10.5772/intechopen.89338
-
M. Corigliano, L. Scandella, C. G. Lai, and R. Paolucci, “Seismic analysis of deep tunnels in near fault conditions: a case study in Southern Italy,” Bulletin of Earthquake Engineering, Vol. 9, No. 4, pp. 975–995, Mar. 2011, https://doi.org/10.1007/s10518-011-9249-3
-
J.-N. Wang, Seismic Design of Tunnels: A State-Of-The-Art Approach. New York: Parsons Brinckerhoff Quade and Douglas, 1993.
-
V. Gioncu and F. M. Mazzolani, Earthquake Engineering for Structural Design. Spon Press, Taylor and Francis Group, 2011.
-
N. A. Do, D. Dias, and P. Oreste, “2D seismic numerical analysis of segmental tunnel lining behaviour,” Bulletin of the New Zealand Society for Earthquake Engineering, Vol. 47, No. 3, pp. 206–216, Sep. 2014, https://doi.org/10.5459/bnzsee.47.3.206-216
-
B. Liu, D. Zhang, X. Li, and J. Li, “Seismic response of underground structure-soil-aboveground structure coupling system: Current status and future prospects,” Tunnelling and Underground Space Technology, Vol. 122, p. 104372, Apr. 2022, https://doi.org/10.1016/j.tust.2022.104372
-
M. Antoniou, N. Nikitas, I. Anastasopoulos, and R. Fuentes, “Scaling laws for shaking table testing of reinforced concrete tunnels accounting for post-cracking lining response,” Tunnelling and Underground Space Technology, Vol. 101, p. 103353, Jul. 2020, https://doi.org/10.1016/j.tust.2020.103353
-
Z.-Y. Yu, H.-R. Zhang, C.-Q. Huang, and C.-S. Qiao, “Seismic response and damage mechanism of underground structure of subway transfer stations,” in 16th European Conference on Earthquake Engineering, 2018.
-
Z. Gao, M. Zhao, X. Du, and Z. Zhong, “A generalized response spectrum method for seismic response analysis of underground structure combined with viscous-spring artificial boundary,” Soil Dynamics and Earthquake Engineering, Vol. 140, p. 106451, Jan. 2021, https://doi.org/10.1016/j.soildyn.2020.106451
-
A. Franza, A. M. Marshall, and B. Zhou, “Greenfield tunnelling in sands: the effects of soil density and relative depth,” Géotechnique, Vol. 69, No. 4, pp. 297–307, Apr. 2019, https://doi.org/10.1680/jgeot.17.p.091
-
L. M. Massone and F. Nazar, “Analytical and experimental evaluation of the use of fibers as partial reinforcement in shotcrete for tunnels in Chile,” Tunnelling and Underground Space Technology, Vol. 77, pp. 13–25, Jul. 2018, https://doi.org/10.1016/j.tust.2018.03.027
-
N. Efron and M. Road, “Analysing International Tunnel Costs,” Worcester Polytechnic Institute, 2012.
-
M. Ghorbani, M. Sharifzadeh, S. Yasrobi, and M. Daiyan, “Geotechnical, structural and geodetic measurements for conventional tunnelling hazards in urban areas – The case of Niayesh road tunnel project,” Tunnelling and Underground Space Technology, Vol. 31, pp. 1–8, Sep. 2012, https://doi.org/10.1016/j.tust.2012.02.009
-
C. Chanvanichskul, “Fundamental study on design and stability of tunnel structures,” Kyoto University, 2006.
-
N. Kumar, P. Kumar, and S. Saharan, “Time history analysis of underground tunnel,” International Journal of Technical Innovation in Modern Engineering and Science, Vol. 4, No. 11, 2018.
-
P. Mahan and V. Shahram, “Performance-based seismic assessment of shallow tunnels using pushover analysis,” Journal of Tunnelling and Underground Space Engineering (TUSE), Vol. 7, No. 1, pp. 63–81, 2018.
-
F. Sun, G.-B. Wang, X.-J. Peng, Z.-Z. Jin, X.-C. Li, and J.-L. Zhao, “Seismic response study of tunnels running underneath a subway station in parallel,” Shock and Vibration, Vol. 2020, pp. 1–15, Jul. 2020, https://doi.org/10.1155/2020/8822981
-
M. Singh, M. N. Viladkar, and N. K. Samadhiya, “Seismic analysis of Delhi metro underground tunnels,” Indian Geotechnical Journal, Vol. 47, No. 1, pp. 67–83, Aug. 2016, https://doi.org/10.1007/s40098-016-0203-9
-
M. M. F. T. Diogo, “Seismic behaviour of shallow tunnels in stratified ground,” Técnico, Technical University of Lisbon, 2010.
-
A. Alonso-Rodriguez, N. Nikitas, J. Knappett, G. Kampas, I. Anastasopoulos, and R. Fuentes, “System identification of tunnel response to ground motion considering a simplified model,” Frontiers in Built Environment, Vol. 4, No. 39, Jul. 2018, https://doi.org/10.3389/fbuil.2018.00039
-
K. Xu, L. Jing, X. Cheng, H. Liang, and J. Bin, “Laboratory tests for subgrade reaction coefficient in seismic design of underground engineering domain,” Advances in Civil Engineering, Vol. 2020, No. 1, Jun. 2020, https://doi.org/10.1155/2020/6958642
-
Z. Bao, Y. Yuan, and H. Yu, “Multi-scale physical model of shield tunnels applied in shaking table test,” Soil Dynamics and Earthquake Engineering, Vol. 100, pp. 465–479, Sep. 2017, https://doi.org/10.1016/j.soildyn.2017.06.021
-
S. Afraei, K. Shahriar, and S. H. Madani, “Developing intelligent classification models for rock burst prediction after recognizing significant predictor variables, Section 1: Literature review and data preprocessing procedure,” Tunnelling and Underground Space Technology, Vol. 83, pp. 324–353, Jan. 2019, https://doi.org/10.1016/j.tust.2018.09.022
-
A. Golshani and M. Rezaeibadashiani, “A numerical study on parameters affecting seismic behavior of cut and cover tunnel,” Geotechnical and Geological Engineering, Vol. 38, No. 2, pp. 2039–2060, Dec. 2019, https://doi.org/10.1007/s10706-019-01147-x
-
L. Marsed, “Estimation of the seismic demand and capacity of RC buildings through incremental dynamic analysis,” Epoka University, 2017.
-
A. Hamed, “An overview on the concepts and methodologies of incremental dynamic analysis IDA (with a single record and multiple records),” in The World Congress on the Structures Congress, Aug. 2016.
-
Y. B. Ho, “Seismic vulnerability assessment of tall buildings with transfer storeys,” The Hong Kong University of Science and Technology Library, Aug. 2025, https://doi.org/10.14711/thesis-b1070736
-
G. Bahar and K. N. Bahar, “Incremental dynamic analysis of structural performance under earthquake excitations,” Journal of Earthquake Engineering, Vol. 24, No. 5, pp. 843–860, 2020.
-
A. Azarbakht and M. Dolšek, “Progressive incremental dynamic analysis for first-mode dominated structures,” Journal of Structural Engineering, Vol. 137, No. 3, pp. 445–455, Mar. 2011, https://doi.org/10.1061/(asce)st.1943-541x.0000282
-
T. Liu, F. Xu, Q. Wang, and H. Xu, “Incremental dynamic analysis of underground subway station structure,” in E3S Web of Conferences, Vol. 293, p. 03007, Jul. 2021, https://doi.org/10.1051/e3sconf/202129303007
-
D. Vamvatsikos and M. Fragiadakis, “Incremental dynamic analysis for estimating seismic performance sensitivity and uncertainty,” Earthquake Engineering and Structural Dynamics, Vol. 39, No. 2, pp. 1–16, 2009.
-
S. T. Kalman, “Performance based seismic design of masonry in-filled frames,” Faculty of Civil Engineering Osijek, Osijek, 2013.
-
D. D. ’Ayala, A. Meslem, D. Vamvatsikos, K. Porter, T. Rossetto, and V. Silva, “Guidelines for analytical vulnerability assessment of low mid-rise buildings,” GEM Technical Report 2014-12 V1.0.0, 2015.
-
K. Bakalis and D. Vamvatsikos, “Seismic fragility functions via nonlinear response history analysis,” Journal of Structural Engineering, Vol. 144, No. 10, Oct. 2018, https://doi.org/10.1061/(asce)st.1943-541x.0002141
-
T. Tran, T. Nguyen, J. Park, and D. Kim, “Nonlinear behaviour of reinforced concrete structures using incremental dynamic analysis considering height effects,” in 8th Asia and Pacific Young Researchers and Graduates Symposium (YRGS 2017), pp. 1–6, 2017.
-
M. Dadkhah, R. Kamgar, and H. Heidarzadeh, “Reducing the cost of calculations for incremental dynamic analysis of building structures using the discrete wavelet transform,” Journal of Earthquake Engineering, Vol. 26, No. 7, pp. 3317–3342, May 2022, https://doi.org/10.1080/13632469.2020.1798830
-
B. F. Soysal and Y. Arici, “Incremental dynamic analysis of a gravity dam,” in 10th U.S. National Conference on Earthquake Engineering Frontiers of Earthquake Engineering, 2014.
-
P. Skrekas and A. Giaralis, “On the use of incremental dynamic analysis for evaluating the earthquake-resistant performance of off-shore jack-up platforms,” in 6th International ASRANet Conference for Integrating Structural Analysis, Risk and Reliability, 2012.
-
M. Javanpour and P. Zarfam, “Application of incremental dynamic analysis (IDA) method for studying the dynamic behavior of structures during earthquakes,” Engineering, Technology and Applied Science Research, Vol. 7, No. 1, pp. 1338–1344, Feb. 2017, https://doi.org/10.48084/etasr.902
-
A. H. Hassanieh, P. Zarfam, and M. Mofid, “Assessment of seismic behaviour of 3D asymmetric steel buildings retrofitted with TADAS device based on incremental dynamic analysis (IDA),” in Proceedings of the 12th World Conference on Earthquake Engineering, 2012.
About this article

The authors have not disclosed any funding.
The datasets generated during and/or analyzed during the current study are available from the corresponding author on reasonable request.
The authors declare that they have no conflict of interest.
