Abstract
This article is devoted to the analysis of the public transport systems’ coverage ratio of the central cities of the Republic of Uzbekistan except the capital city. During the research the population density and public transport network have been analysed by comparing the coverage ratio.
Highlights
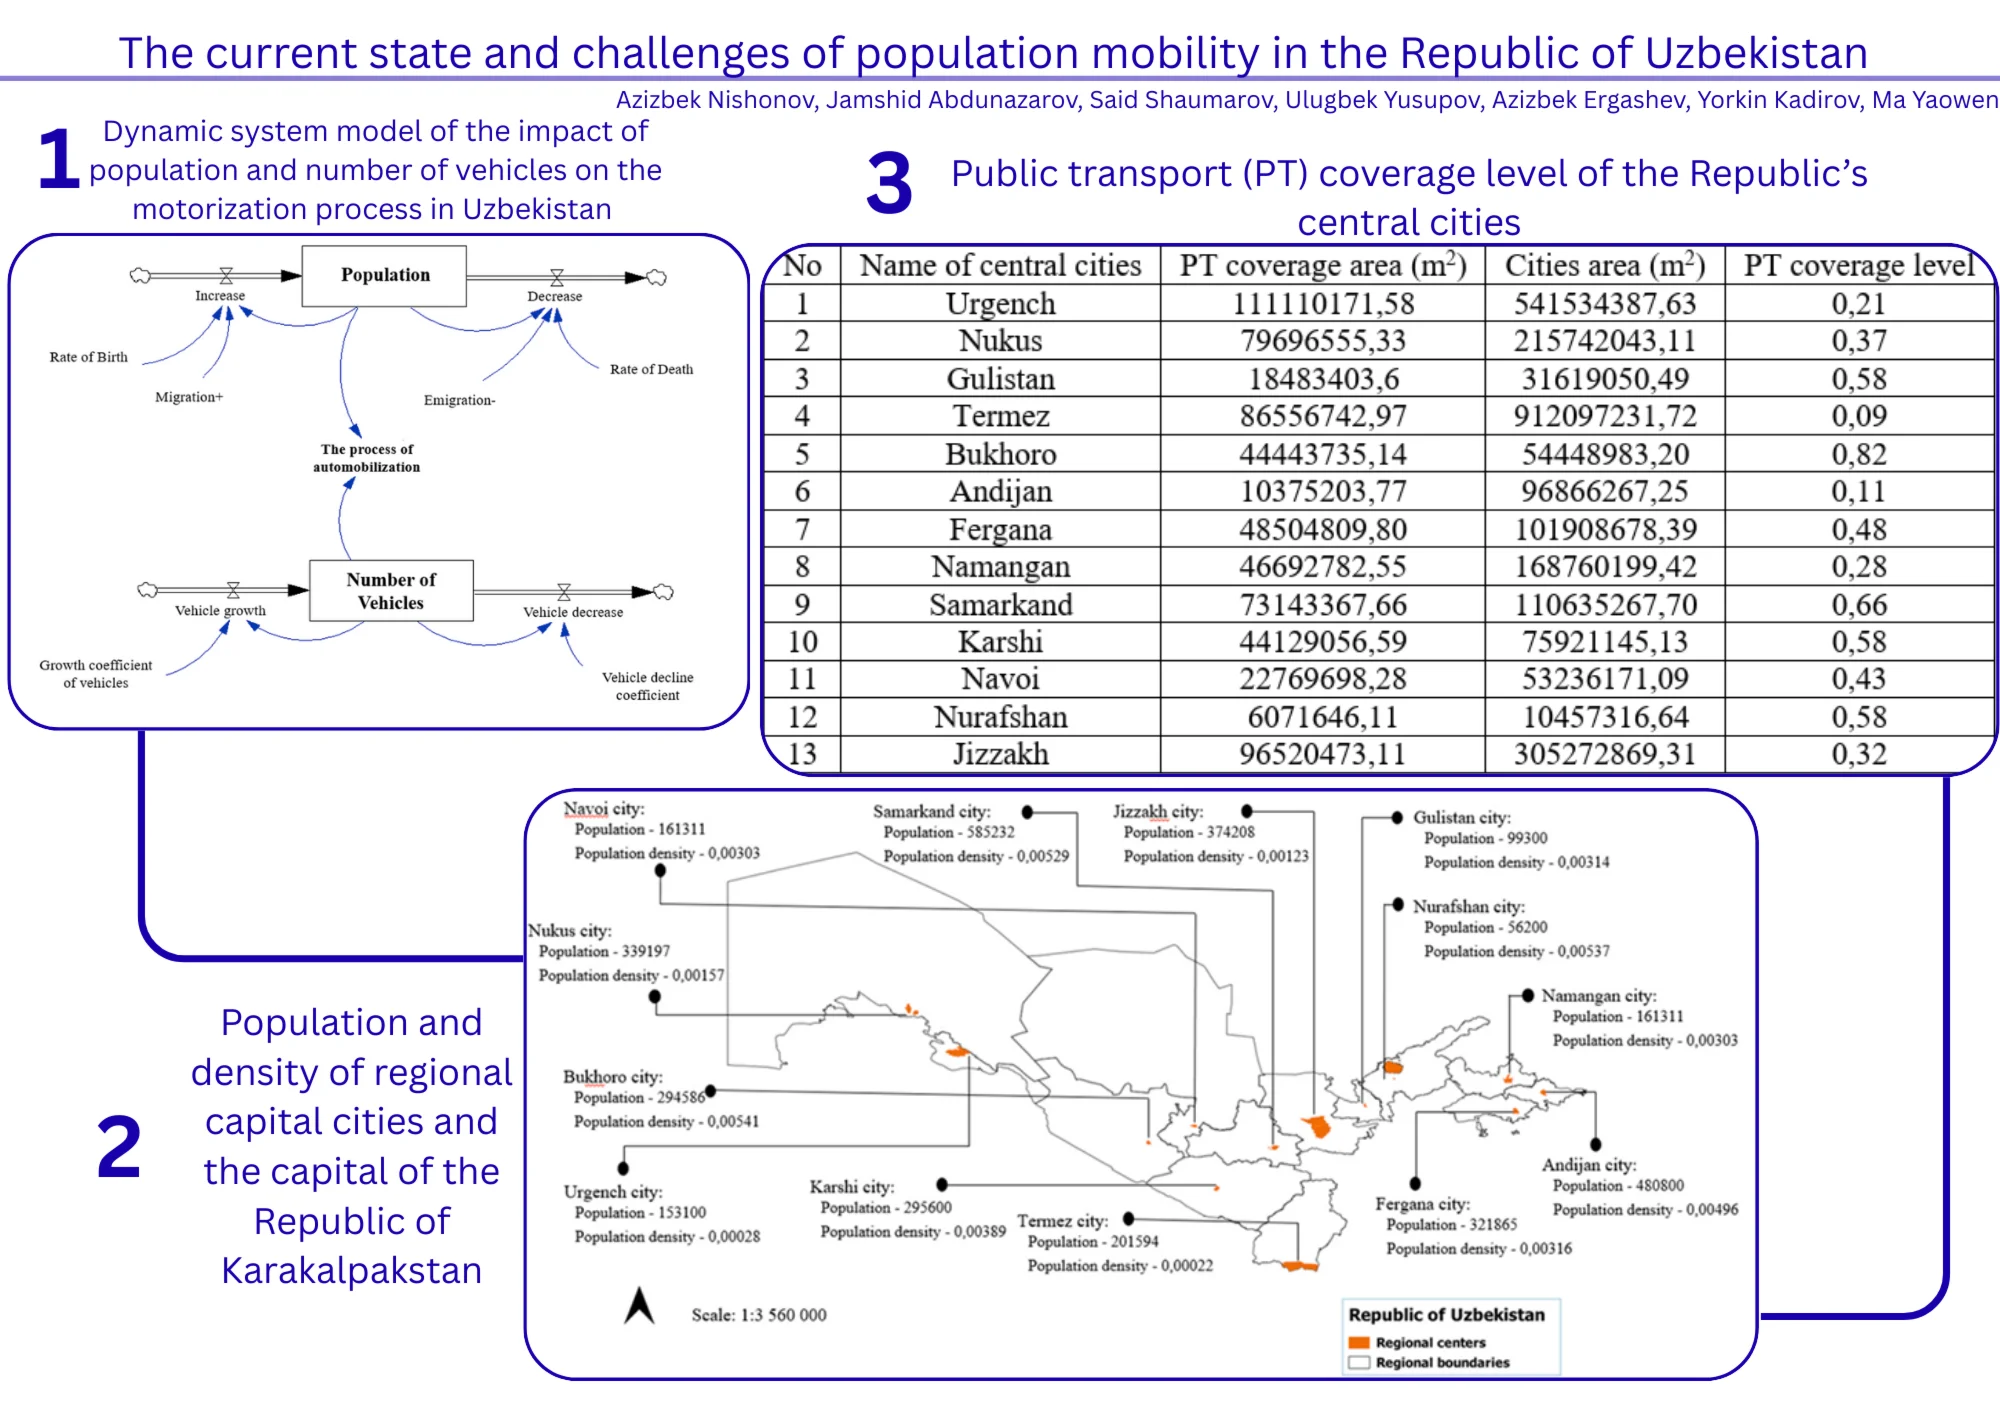
- Dynamic system model of the impact of population and number of vehicles on the motorization process in Uzbekistan.
- Population and density of regional capital cities and the capital of the Republic of Karakalpakstan.
- Public transport (PT) coverage level of the Republic’s central cities.
1. Introduction
At the present stage of the Republic of Uzbekistan’s development, the need has arisen to introduce new approaches to managing economic processes, to implement effective governance policies at both macro and micro levels, and to progressively apply modern mechanisms across all sectors of the economy. Consequently, current economic policy prioritizes “the accelerated modernization and technical re-equipment of existing enterprises, as well as the establishment of new, modern industries operating on the basis of advanced innovative technologies”.
Given that the level of financial and economic stability varies across different sectors, the operational mechanisms governing managerial processes also differ. Therefore, it is essential to apply efficient management mechanisms that take into account the specific characteristics of each sector.
One such sector is the transport system, the development of which facilitates economic cooperation among entities in other branches of the economy, creates the foundation for the emergence of new industries, and supports their subsequent development. Within this sector, road transport occupies a leading position.
With the growth of urban populations, the demand for transport services increases accordingly. In densely populated areas, the effective organization of public transport (PT) operations plays a crucial role in ensuring mobility. Despite sustained efforts to develop the PT sector in Uzbekistan, ongoing population growth continues to intensify the daily demand for transportation.
An examination of demographic changes over the past decade reveals that the population of the Republic increased from 30.4 million as of 1 January 2014 to 36.0 million as of 1 January 2023 [1] – an increase of 5.53 million people, or 15 % (Table 1). Over this period, the average annual growth rate amounted to 1.7 %. This rate allows for the projection of average population growth over the next 5, 10, 20, and 30 years. Identifying these growth indicators enables the forecasting of future transport demand required to sustain the population’s mobility over the projected periods.
Table 1Permanent population – total (at the beginning of the year; thousand persons)
Regions | Years | |||||||||||
2014 | 2015 | 2016 | 2017 | 2018 | 2019 | 2020 | 2021 | 2022 | 2023 | Increase amount | Growth rate, % | |
Republic of Uzbekistan | 30492,8 | 31022,5 | 31575,3 | 32120,5 | 32656,7 | 33255,5 | 33905,2 | 34558,9 | 35271,3 | 36024,9 | 5532,1 | 15,0 |
Republic of Karakalpakstan | 1736,5 | 1763,1 | 1791,1 | 1817,5 | 1842,3 | 1869,8 | 1898,3 | 1923,7 | 1948,5 | 1976,2 | 239,7 | 12,0 |
Andijan | 2805,5 | 2857,3 | 2910,5 | 2962,5 | 3011,7 | 3066,9 | 3127,7 | 3188,1 | 3253,5 | 3322,7 | 517,2 | 15,2 |
Bukhoro | 1756,4 | 1785,4 | 1815,2 | 1843,5 | 1870,2 | 1894,8 | 1923,9 | 1947,1 | 1976,8 | 2009,7 | 253,3 | 12,4 |
Jizzakh | 1226,8 | 1250,1 | 1276,1 | 1301,0 | 1325,0 | 1352,4 | 1382,1 | 1410,5 | 1443,4 | 1475,5 | 248,7 | 16,5 |
Kashkadarya | 2895,3 | 2958,9 | 3025,6 | 3088,8 | 3148,4 | 3213,1 | 3280,4 | 3335,4 | 3408,3 | 3482,3 | 587 | 16,5 |
Navoi | 901,1 | 913,2 | 927,9 | 942,8 | 958,0 | 979,5 | 997,1 | 1013,6 | 1033,9 | 1055,5 | 154,4 | 14,4 |
Namangan | 2504,1 | 2554,2 | 2603,4 | 2652,4 | 2699,6 | 2752,9 | 2810,8 | 2867,5 | 2931,1 | 2997,5 | 493,4 | 16,1 |
Samarkand | 3445,6 | 3514,8 | 3583,9 | 3651,7 | 3720,1 | 3798,9 | 3877,4 | 3947,7 | 4031,3 | 4118,2 | 672,6 | 16,0 |
Surkhandarya | 2308,3 | 2358,3 | 2411,5 | 2462,3 | 2514,2 | 2569,9 | 2629,1 | 2680,8 | 2743,2 | 2806,5 | 498,2 | 17,3 |
Syrdarya | 763,8 | 777,1 | 790,6 | 803,1 | 815,9 | 829,9 | 846,3 | 860,9 | 878,6 | 896,6 | 132,8 | 14,5 |
Tashkent | 2725,9 | 2758,3 | 2794,1 | 2829,3 | 2861,2 | 2898,5 | 2941,9 | 2975,9 | 2939,7 | 2993,4 | 267,5 | 8,8 |
Fergana | 3386,5 | 3444,9 | 3505,3 | 3564,8 | 3620,2 | 3683,3 | 3752,0 | 3820,0 | 3896,4 | 3976,3 | 589,8 | 14,5 |
Khorezm | 1684,1 | 1715,6 | 1746,9 | 1776,7 | 1805,0 | 1835,7 | 1866,5 | 1893,3 | 1924,2 | 1958,1 | 274 | 13,7 |
Tashkent c. | 2352,9 | 2371,3 | 2393,2 | 2424,1 | 2464,9 | 2509,9 | 2571,7 | 2694,4 | 2862,4 | 2956,4 | 5532,1 | 19,8 |
2. Methodology
To determine the expected population size in future years, Doctor of Technical Sciences, Professor J. Abdunazarov, has conducted research and developed a formula that accounts for both projected population growth and the rate of fatalities resulting from road traffic accidents. According to this formula, the expected population in year t is calculated by multiplying the current population by the growth rate for year t, then adding the percentage equivalent of net migration into the country:
where, – the expected population in year ; – current population growth rate; – birth rate. Average percentage of birth rate; – migration number of people migrating to Uzbekistan each year.
However, population growth is directly related not only to factors that increase it but also to those that contribute to its decline. Therefore, in determining the expected population size in future years, the formula has been improved by taking into account both the mortality rate and the volume of emigration. Eq. (2) presents a method for forecasting and calculating the expected population in the coming years, through which future growth indicators are estimated based on the current population size:
where, – expected population in year ; – current population when calculating population growth rate; – birth rate. Average percentage of birth rate; – death rate. Average percentage of death rate; – migration number of people migrating to Uzbekistan each year; – emigration number of people emigrating from Uzbekistan each year.
As of January 1, 2023, the population of the Republic amounted to 36.02 million, and taking into account the average annual growth rate of 1.7 %, it is projected that over the next 5, 10, 20, and 30 years, the population will reach approximately 37.38 million, 39.62 million, 44.50 million, and 50.05 million, respectively.
Correspondingly, as population growth drives an increase in transport demand to ensure urban mobility, the use of Formula 1 to forecast the future population together with current transport volume indicators makes it possible to estimate the potential demand and number of transport vehicles in the future. The process of motorization is simultaneously dependent on both the population size and the number of vehicles; therefore, forecasting these figures and analyzing their interrelationship allows for determining the level of motorization. As a result, it becomes possible to predict in advance the traffic load that may occur on urban streets in the coming years (Fig. 1) [5-6].
Fig. 1Dynamic system model of the impact of population and number of vehicles on the motorization process in Uzbekistan [2]
![Dynamic system model of the impact of population and number of vehicles on the motorization process in Uzbekistan [2]](https://static-01.extrica.com/articles/25816/25816-img1.jpg)
3. Results and discussion
An analysis of current population mobility reveals that the majority of trips are made using private vehicles. According to data from the State Statistics Committee dated September 24, 2022, there are 90 cars per 1,000 people in Uzbekistan [1]. Over the past ten years, the number of privately owned vehicles in the country has shown a steady increase. As of 2024, the total number of privately owned vehicles reached 4,020,744 units, with an average annual growth rate of 7.5 % (Fig. 2).
Fig. 2Number of vehicles owned by individuals in the Republic of Uzbekistan
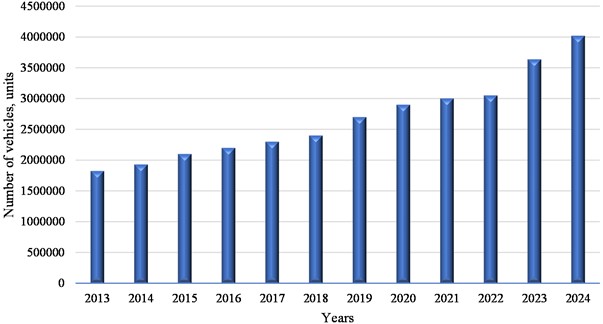
An analysis of the composition of vehicles in the Republic shows that, as of January 1, 2024, the number of cars owned by individuals amounted to 4,020,744 units. The number of buses totaled 6,297 units, while the number of minibuses reached 9,102 units. Consequently, buses accounted for only 0.15 % of the total number of vehicles, and minibuses for just 0.22 % (Table 2).
Table 2Types and number of vehicles owned by individuals in Uzbekistan
Year | Number of total vehicles | Types of vehicles | Annual vehicle growth rate, % | ||||
Passenger cars | Freight trucks | Buses | Minibuses | Special-purpose vehicles | |||
2009 | 1417758 | 1307087 | 81145 | 28121 | – | 1405 | – |
2010 | 1530112 | 1411149 | 88901 | 28462 | – | 1600 | 7,9 |
2011 | 1640918 | 1518009 | 93621 | 27633 | – | 1655 | 7,2 |
2012 | 1728867 | 1612401 | 89357 | 25590 | – | 1519 | 5,4 |
2013 | 1840012 | 1712854 | 98843 | 5752 | 20117 | 2446 | 6,4 |
2014 | 1946130 | 1818713 | 101982 | 5411 | 17352 | 2672 | 5,8 |
2015 | 2109185 | 1974182 | 110164 | 5831 | 16188 | 2820 | 8,4 |
2016 | 2191231 | 2057331 | 111105 | 5415 | 14309 | 3071 | 3,9 |
2017 | 2273419 | 2133507 | 116339 | 5629 | 13982 | 3962 | 3,8 |
2018 | 2440276 | 2272185 | 143442 | 5869 | 14459 | 4321 | 7,3 |
2019 | 2553889 | 2379418 | 150363 | 6160 | 15992 | 4461 | 4,6 |
2020 | 2667502 | 2486651 | 157284 | 6451 | 17525 | 4601 | 4,2 |
2021 | 2781115 | 2593884 | 164205 | 6742 | 18058 | 4741 | 4,2 |
2022 | 3268470 | 3051734 | 1959734 | 6854 | 8946 | 5152 | 17,5 |
2023 | 3637119 | 3396520 | 219628 | 6666 | 8961 | 5344 | 11,2 |
2024 | 4020744 | 3759045 | 240917 | 6297 | 9102 | 5383 | 10,5 |
According to the statistical data presented in Tables 1 and 2, the trends in the permanent population of the Republic and the process of motorization during the specified period can be observed. In recent years, the number of passenger cars has been increasing sharply. However, given that the growth rate of public transport vehicles has remained relatively low, it is natural that existing transportation problems in cities will intensify, and population mobility will become increasingly difficult.
To provide the population with fast and convenient mobility, it is necessary to identify the permanently mobile segment of the population. Once this segment is determined, the corresponding demand for transport can be assessed. Based on the identified transport demand and the size of the mobile population, it becomes possible to determine the needs for public transport (PT). At the same time, by considering the population’s regular destinations, proposals can be developed to plan and improve the operation of PT services.
An analysis of population density in the cities of the Republic shows that the highest densities are concentrated in regional capitals. Considering that most of these cities are developing large urban centers, it is crucial to study mobility trends in advance and to establish a convenient transport infrastructure. For small, medium, and large cities, ensuring the free movement of vehicles within the street-road network and achieving full PT coverage of residential areas play an important role. Within urban areas, the transport infrastructure should accommodate cars, public transport vehicles, and individual mobility devices (such as bicycles, electric scooters, mopeds, and similar modes), with a focus on flexibility and minimizing environmental impact [8].
While private vehicles have an advantage in terms of speed for short-distance urban travel, their growing number increases traffic volumes on the street-road network, exacerbates transport problems, and contributes to harmful emissions. Providing convenient infrastructure for individual mobility devices for short-distance travel can help reduce reliance on private cars. Furthermore, individual mobility devices are generally more environmentally friendly and cause less harm to the environment (Fig. 3) [3-4].
In terms of administrative-territorial structure, the Republic of Uzbekistan consists of the city of Tashkent, 12 regions (Samarkand, Jizzakh, Syrdarya, Tashkent Region, Fergana, Andijan, Namangan, Bukhara, Navoi, Kashkadarya, Surkhandarya, and Khorezm), and the Republic of Karakalpakstan. Tashkent is the capital of the Republic and is the largest city both in terms of area and population. Administratively, the city is divided into 12 districts, with a total area of 631.29 km2 and a population of 3,112.8 thousand. Considering its large population, territorial structure, and land area, Tashkent requires a separate study within the scope of this research.
Fig. 3Interrelation of modes of transport use within the city [3]
![Interrelation of modes of transport use within the city [3]](https://static-01.extrica.com/articles/25816/25816-img3.jpg)
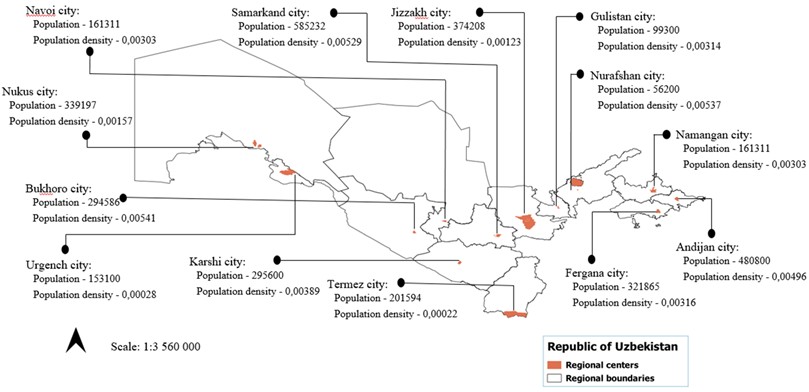
The central cities of the 12 regions and the capital of the Republic of Karakalpakstan have relatively similar statistical indicators in terms of total area and population size. Therefore, their current state of population mobility and the level of public transport (PT) network coverage were studied collectively during the course of the research (Fig. 4) [4].
Fig. 4Population and density of regional capital cities and the capital of the Republic of Karakalpakstan
The central administrative cities of the Republic are provided with a public transport (PT) network, with bus routes passing through densely populated areas and passenger transport services organized to ensure population mobility. In urban areas, the majority of PT routes are laid along roads in high-density zones and are distributed across these areas; however, it can be observed that bus routes are predominantly concentrated along central streets.
Therefore, it is important to redistribute the route network according to residential areas and destinations of public interest, as well as to study the organization of movement by transport modes, the scheduling of mobility throughout the day, and the patterns of movement by age groups [7].
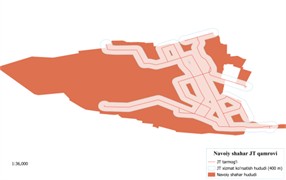
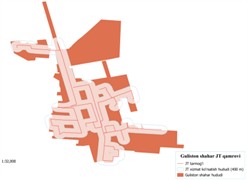
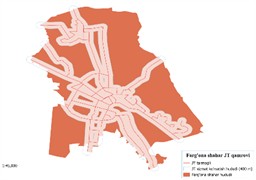
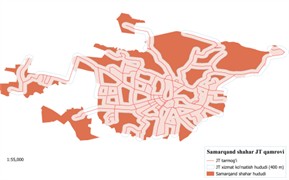
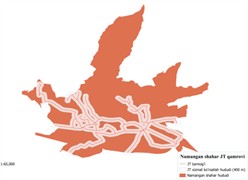
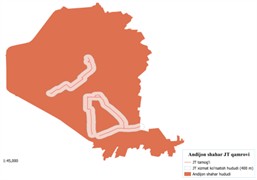
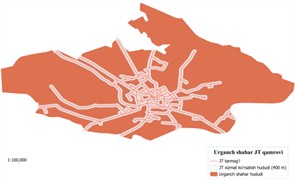
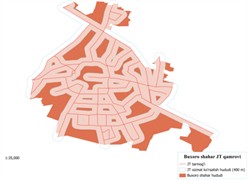
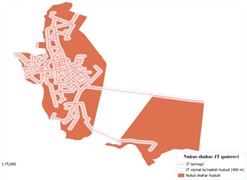
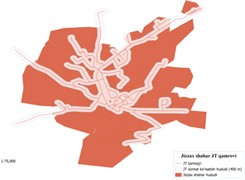
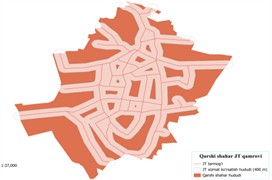
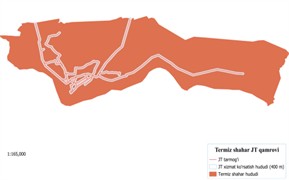
According to State Standard of the Republic of Uzbekistan No. 2.07.01-03, the walking distance from a residential area or workplace to the nearest stop of public passenger transport must not exceed 400 meters. Based on this requirement, the level of bus route coverage defined as the share of residential areas or workplaces located within 400 meters of the nearest bus route was determined (Table 3, Fig. 5) [4].
Fig. 5Coverage level of the public transport network in the central cities of the Republic

4. Conclusions
As the urban population increases, population density in transport zones also rises, which, in turn, accelerates the process of motorization. Consequently, the growing demand for transport in cities necessitates the improvement of urban transport system planning and the search for scientific solutions to ensure population mobility.
Table 3Public transport (PT) coverage level of the Republic’s central cities
No | Name of central cities | PT coverage area (m2) | Cities area (m2) | PT coverage level |
1 | Urgench | 111110171,58 | 541534387,63 | 0,21 |
2 | Nukus | 79696555,33 | 215742043,11 | 0,37 |
3 | Gulistan | 18483403,6 | 31619050,49 | 0,58 |
4 | Termez | 86556742,97 | 912097231,72 | 0,09 |
5 | Bukhoro | 44443735,14 | 54448983,20 | 0,82 |
6 | Andijan | 10375203,77 | 96866267,25 | 0,11 |
7 | Fergana | 48504809,80 | 101908678,39 | 0,48 |
8 | Namangan | 46692782,55 | 168760199,42 | 0,28 |
9 | Samarkand | 73143367,66 | 110635267,70 | 0,66 |
10 | Karshi | 44129056,59 | 75921145,13 | 0,58 |
11 | Navoi | 22769698,28 | 53236171,09 | 0,43 |
12 | Nurafshan | 6071646,11 | 10457316,64 | 0,58 |
13 | Jizzakh | 96520473,11 | 305272869,31 | 0,32 |
Forecasting the growth rates of urban population and motorization in advance makes it possible to simultaneously determine both the demand for vehicles and the traffic load on road networks. This, in turn, enables the planning of urban transport systems over different time horizons. Furthermore, as demographic processes in cities accelerate, the role of the public transport (PT) system in ensuring mobility continues to grow. PT serves as a key tool for reducing and preventing potential transport problems in developing cities, as well as for ensuring traffic safety [6].
Within the framework of this research, the formula for forecasting the demographic situation of cities has been improved for application in enhancing urban transport network planning. The analytical results obtained in this study were applied to the central cities of the Republic, allowing for the determination of the level of PT coverage. For example, the PT coverage in the Jizzakh city agglomeration was found to be 26.23 %. This indicates that nearly 75 % of the city’s population relies on private vehicles, other personal mobility means, or walking to meet their mobility needs.
When planning urban transport systems, separately considering weekdays and weekends for population mobility contributes to improving the efficiency indicators of the planning process.
References
-
National statistics committee of the republic of Uzbekistan, https://stat.uz/uz/.
-
Z. Abdunazarov, “Methodological foundations for ensuring road traffic safety on urban automobile roads,” (in Russian), 2022.
-
I. A. Jasim, S. L. Farhan, and H. M. Hasan, “The impact of transit on sustainable urban form,” in IOP Conference Series: Materials Science and Engineering, Vol. 1058, No. 1, p. 012049, Feb. 2021, https://doi.org/10.1088/1757-899x/1058/1/012049
-
I. A. Jasim, A. A. Al-Jaberi, L. A. Al-Maliki, N. Al-Ansari, and S. K. Al-Mamoori, “Do the population density and coverage rate of transit affect the public transport contribution?,” Cogent Engineering, Vol. 9, No. 1, p. 2143059, Dec. 2022, https://doi.org/10.1080/23311916.2022.2143059
-
V. O. ’Riordan, F. Rogan, B. Ó. Gallachóir, T. Mac Uidhir, and H. Daly, “How and why we travel – Mobility demand and emissions from passenger transport,” Transportation Research Part D: Transport and Environment, Vol. 104, p. 103195, Mar. 2022, https://doi.org/10.1016/j.trd.2022.103195
-
A. D. Marra and F. Corman, “How different network disturbances affect route choice of public transport passengers. A descriptive study based on tracking,” Expert Systems with Applications, Vol. 213, p. 119083, Mar. 2023, https://doi.org/10.1016/j.eswa.2022.119083
-
M. Yakimov and V. Say, “Investigation of the parameters of population mobility on public transport in cities,” Transportation Research Procedia, Vol. 61, pp. 83–89, Jan. 2022, https://doi.org/10.1016/j.trpro.2022.01.015
-
R. Okraszewska et al., “Sustainable urban mobility plans: implementation process and indicators to evaluate effects on physical activity,” European Journal of Public Health, Vol. 32, No. Supplement_4, Nov. 2022, https://doi.org/10.1093/eurpub/ckac069
About this article

The authors have not disclosed any funding.
The datasets generated during and/or analyzed during the current study are available from the corresponding author on reasonable request.
A. Nishonov: technical review, conceptualization and methodology. J. Abdunazarov: supervision and model formulation. S. Shaumarov: data validation and analysis. U. Yusupov: QGIS modeling and visualization. A. Ergashev: data collection. Y. Kadirov: translation. M. Yaowen: international coordination and manuscript editing.
The authors declare that they have no conflict of interest.
