Abstract
The vibration signal of the operating mechanism during the operation of high-voltage circuit breaker (HVCB) contains a large amount of information, which can be used to reflect the mechanical status of circuit breakers and thus carry out early warning and diagnosis of potential faults. However, the complex operating environment of the circuit breaker contains a large number of noise signals, which makes the vibration signals obscured and thus difficult to extract the feature values accurately and easily. In order to solve this problem, this paper proposes a new denoising method based on Dual-Tree Complex Wavelet Transform (DT-CWT), which is specifically used for the feature extraction of mechanical vibration signals from HVCB. Real vibration signals are first simulated and full-band random noise is injected to replicate the field noise conditions. Various decomposition layers and denoising methods within the DT-CWT framework were tested on these simulated signals to assess their effectiveness. The performance of the proposed methods was further validated using actual acquired HVCB vibration signals. The results show that DT-CWT is a powerful tool for denoising mechanical vibration signals, improving the clarity of the signals and maintaining the integrity of the signals in the presence of noise, providing a significant improvement over conventional wavelet method. This study provides a robust solution for reducing noise in circuit breaker vibration signals and an effective reference method for improving mechanical status diagnosis.
1. Introduction
High-voltage circuit breaker (HVCB) plays a crucial role in ensuring the safe and stable operation of the electrical grid [1-4]. As circuit breakers are subjected to increasing numbers of operations over time, their performance inevitably deteriorates, leading to a higher risk of faults. The consequences of circuit breaker failures extend far beyond their replacement costs, potentially jeopardizing the safety and reliability of entire power supply lines [5-7]. Mechanical failures within the operating mechanisms are the primary cause of HVCB faults, accounting for approximately 61 % of major faults and 54 % of minor faults [8]. Current diagnostic approaches for mechanical faults in circuit breakers typically involve analyzing data such as closing and opening current signals, trip coil travel curves, and the mechanical vibration signals of the operating mechanisms. Among these, current signals mainly reflect the condition of the coil and nearby mechanical faults during operation but fail to provide a comprehensive view of the circuit breaker's overall health. Travel curve signals are more suitable for assessing performance degradation and are less effective in detecting early-stage mechanical faults [9, 10]. On the other hand, vibration signals generated by the operating mechanism during opening and closing actions contain rich state information, making them a valuable resource for diagnosing mechanical faults in circuit breakers [11, 12].
Vibration signals from circuit breakers are inherently nonperiodic and nonstationary, with significant state features concentrated during specific phases of operation. However, the acquisition of these signals is often compromised by various factors, such as environmental noise, base mounting conditions, and sensor configurations. These factors introduce noise that can obscure critical diagnostic information, making it essential to preprocess the vibration signals for noise reduction before performing any diagnosis. Effective denoising is critical to enhance the accuracy of subsequent diagnostic processes [13-17].
Despite the importance of denoising in circuit breaker vibration signal analysis, most existing research has focused on feature extraction and classification, with relatively few studies addressing the denoising aspect. Traditional denoising methods, such as wavelet transforms and filtering techniques, have been widely used, but they come with limitations. For instance, wavelet denoising and wavelet packet denoising are challenged by the need to select appropriate wavelet bases and decomposition layers, while band-pass and morphological filtering methods may lead to the loss of valuable signal information. Specifically, band-pass filters will truncate out-of-band transient high-frequency details (which may contain high-frequency characteristic signatures of minor mechanical faults) or critical low-frequency trends, while morphological filters are highly prone to eliminating the valid edges and high-frequency details that represent real mechanical impacts during the denoising process. More advanced methods, such as sparse decomposition, variational mode decomposition (VMD) and so on [18, 19], offer improved denoising performance but at the cost of increased computational complexity and potential signal distortion during reconstruction [20-22]. For instance, during each functional iteration of the VMD algorithm, it must sequentially update the complete frequency spectra of all modes, their corresponding center frequencies, and the associated Lagrange multipliers, and its reconstruction performance is heavily dependent on the selection of parameters such as the number of modes.
Given these challenges, there is a clear need for further research into more effective denoising methods for circuit breaker vibration signals. Improved denoising techniques are essential for extracting meaningful features from the signals and enhancing the accuracy of fault diagnosis. To address these needs, this paper proposes a denoising method based on the Dual-Tree Complex Wavelet Transform (DT-CWT), which is particularly well-suited to the characteristics of circuit breaker vibration signals. DT-CWT offers superior directional selectivity and symmetry by using two parallel wavelet transform trees to approximate the real and imaginary parts of the signal. This structure allows for the capture of more detailed directional information, enabling more effective differentiation between noise and signal components. Additionally, DT-CWT's dual-tree structure mitigates frequency aliasing, thereby improving signal reconstruction quality while preserving the signal's original features. Furthermore, DT-CWT's fine time-frequency localization properties make it easier to identify and separate signal features across different scales, demonstrating its strong performance in processing nonstationary, multifrequency vibration signals.
This paper introduces a simulation model for circuit breaker vibration signals and evaluates the denoising effectiveness of DT-CWT using three key metrics, including Signal-to-Noise Ratio (SNR). The study involves injecting uniformly distributed white noise into the spectrum to simulate realistic noise conditions. The results demonstrate the superiority of DT-CWT in denoising, particularly when compared to traditional wavelet transform methods. Finally, the practicality of the proposed denoising method is validated through experiments using vibration signals measured on-site from SF6 circuit breakers. This research provides a robust solution for circuit breaker vibration signal noise reduction and offers a valuable reference for future studies in this field.
2. Dual-tree complex wavelet transform
2.1. Algorithm introduction
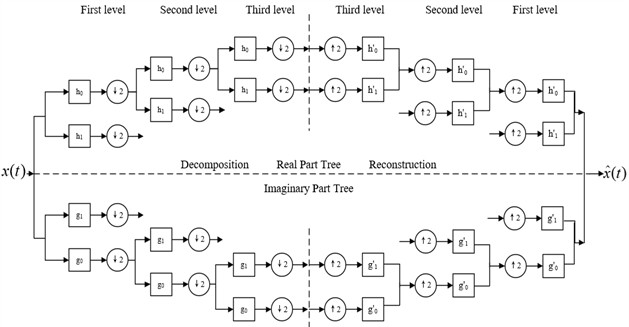
DT-CWT uses a two-way filter group with a binary tree structure to decompose and reconstruct the signal. It is divided into a real tree and an imaginary tree. The low-pass filters of the real and imaginary trees are reasonably designed to meet the half-sampling delay condition and have approximate translation invariance [23, 24]. The sampling frequency of the filters in the two trees is the same, but the delay between them is exactly one sampling interval. In this way, the binary extraction of the first layer in the imaginary tree just samples the sample values lost by the binary extraction in the real tree. While obtaining the translation invariance of the complex wavelet transform, it avoids a lot of calculations and has the advantage of being easy to implement.
The schematic diagram of the DT-CWT process is shown in Fig. 1. In the diagram, the upper part represents the real part tree, and the lower part represents the imaginary part tree. The target signal is transformed simultaneously by both trees, and ultimately, band signals with the original characteristics of the signal are reconstructed.
Fig. 1Decomposition and reconstruction process using dual-tree complex wavelet transform
In the Dual-Tree Complex Wavelet Transform (DT-CWT), the complex wavelet can be represented as:
where is the complex wavelet, is the real part of the wavelet is the imaginary part of the wavelet, and is the imaginary unit.
In the DT-CWT, the wavelet coefficients and scale coefficients of the real part tree can be calculated using Eq. (2):
where is the scale factor, and is the number of decomposition levels.
Similarly, the wavelet coefficients and scale coefficients of the imaginary part tree can be calculated using Eq. (3):
Through the joint calculation of Eq. (2-3), the wavelet coefficients and scale coefficients of the DT-CWT can be obtained:
where is the scale factor, is the number of decomposition levels , represents the real detail coefficient, represents the imaginary detail coefficient, represents the real approximate coefficient, represents the imaginary approximate coefficient, and the coefficients obtained by overall grading are respectively combined by the calculation results of the two trees.
Finally, the wavelet coefficients and scaling coefficients of DT-CWT can be reconstructed using Eq. (5-6):
The reconstructed signal can be expressed as Eq. (7):
In the DT-CWT decomposition, the real and imaginary parts are parallel to each other, and are composed of discrete wavelet transforms using two different low-pass and high-pass filters. The two independently operate on the input signal without data interaction. When decomposing and reconstructing the signal, the sampling position of the imaginary tree should always be kept in the middle of the real tree, so as to comprehensively utilize the wavelet decomposition coefficients of the two trees to achieve information complementarity. DT-CWT uses a dual-tree approach to provide accurate local features, directional selectivity, and reduced modal aliasing. DT-CWT processes the input signal using two parallel dual trees, extracting trend features (the low-frequency part of the signal) through a combination of two wavelet transforms on the low-pass coefficients, while extracting detail features on the high-pass coefficients to analyze the high-frequency components. Initially developed for processing two-dimensional signals, DT-CWT excels in time-frequency characteristics, with edge-preserving and low-distortion properties, making it effective for one-dimensional signal processing as well. Moreover, DT-CWT can suppress the pseudo-Gibbs phenomenon, which helps avoid local oscillations in the decomposed signal when there is an abrupt change in the original signal. Therefore, this section introduces DT-CWT for denoising experiments on circuit breaker simulated signals [25-27].
2.2. Denoising of vibration signals based on DT-CWT
Early fault diagnosis of circuit breaker operating mechanisms relies heavily on the analysis of vibration and acoustic signal features. These signals exhibit strong nonperiodic and nonstationary characteristics, with the critical features concentrated during the operation phase. However, the complex operating conditions often result in noise being present in the collected signals, which interferes with the extraction of meaningful features. Therefore, it is necessary to perform denoising preprocessing on the data before feature extraction to prevent noise from affecting the accuracy of subsequent diagnosis. In this section, a simulation model for circuit breaker vibration and acoustic signals is introduced. White noise, uniformly distributed across the frequency spectrum, is injected to simulate noise components. The effectiveness of the denoising process is evaluated using three indicators: Signal-to-Noise Ratio (SNR), Correlation Coefficient (R), and Mean Square Error (MSE).
2.2.1. Vibration signal simulation
The circuit breaker vibration is regarded as the superposition of a series of exponentially decaying sine waves [28, 29], and its formula is described as Eq. (8):
where represents the signal amplitude, μ represents the attenuation factor. This paper refers to the simulation setting of fitting the real signal based on this exponential sine wave method.
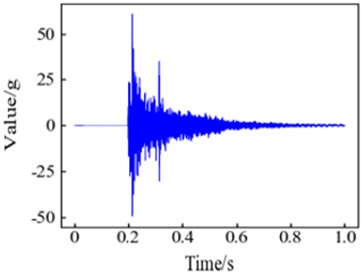
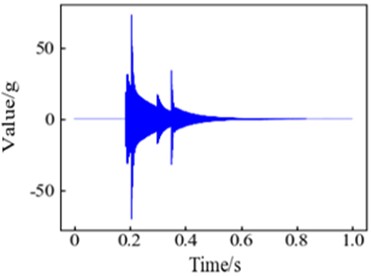
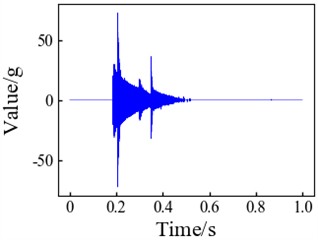
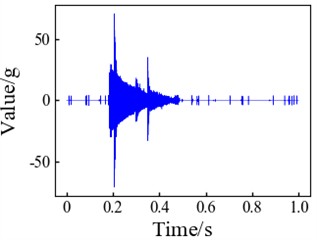
A set of closing vibration signals with relatively low noise from a 40.5 kV circuit breaker under normal conditions was selected for denoising simulation experiments, as shown in Fig. 2(a). The simulated signal was fitted based on the original signal, as shown in Fig. 2(b).
Table 1Simulation parameters for 40.5 kV circuit breaker vibration signal
Component number | A | / Hz | / s | |
1 | 20 | 160 | 7000 | 0.185 |
2 | 25 | 10 | 2200 | 0.19 |
3 | 60 | 200 | 6000 | 0.205 |
4 | 10 | 75 | 5500 | 0.3 |
5 | 30 | 295 | 4500 | 0.35 |
6 | 5 | 16 | 1000 | 0.35 |
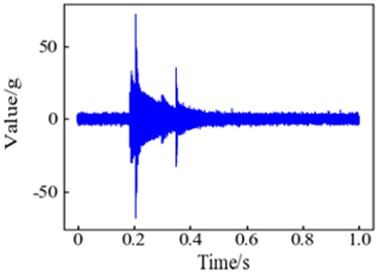
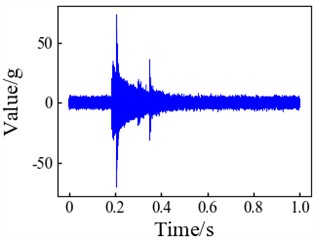
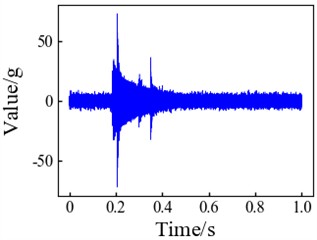
Vibration signals from HVCB are typically corrupted by broadband electromagnetic interference, mechanical resonance noise from adjacent operating equipment, and ambient acoustic noise, all of which are uniformly distributed across the entire frequency spectrum. Therefore, full-band random noise was injected into the original signal to adjust the signal-to-noise ratio (SNR) to 10 and 5, thereby simulating the noise present in actual measured signals, as shown in Fig. 2(c) and Fig. 2(d). The parameter settings for the simulated signal are listed in Table 1. The SNR represents the ratio of the signal energy to the energy of the added noise, and its calculation formula is Eq. (9):
where, and represent the signal power and noise power, respectively. The calculation formulas are Eq. (10):
where, , represent the reference noise-free signal and the noisy signal, respectively. After calculating the power of the original signal, the noise power can be obtained based on the desired SNR level. By acquiring the noise signal in this way, the noisy signal is further obtained by superimposing the noise signal onto the original signal.
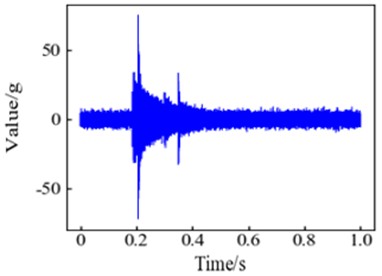
Fig. 2The waveform of original signal and simulated signal injected with different levels of noise: a) measured signal; b) simulated signal; c) simulated signal with SNR = 10; d) simulated signal with SNR = 5
a)
b)
c)
d)
From Fig. 2(c) and Fig. 2(d), it can be observed that the noise content in the measured signal of the 40.5 kV circuit breaker is close to that of the simulated signal with SNR = 10 and is less than that of the simulated signal with SNR = 5. However, the measured dataset contains data with higher noise levels than the selected signal. Therefore, in the denoising experiment setup, the simulated signal with SNR = 5 is used to represent signals with high noise levels in reality, while the simulated signal with SNR = 10 is used to represent signals with low noise levels.
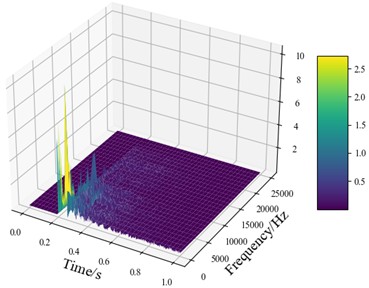
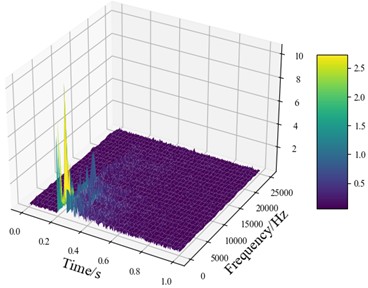
In order to verify whether the method of injecting full-band random noise can simulate the noise contained in the original signal, the signal is fast Fourier transformed to obtain the time-frequency spectrum as shown in Fig. 3. By observing the time-frequency spectrum before and after the noise is injected, it can be found that the noise signal component that can be observed locally has spread to the entire spectrum, and the distribution of random noise in the spectrum is close to the low-energy component in the original signal spectrum, which shows that the characteristics of the injected full-band random noise are similar to those of the noise in the original signal. Therefore, the noise reduction effect on the simulated signal can be considered to have an actual simulation effect.
In this paper, the common threshold denoising method is selected to conduct denoising experiments on the simulation signal. The main steps are: first, decompose the signal; second, perform threshold shrinkage on the decomposed wavelet coefficients or modal components; finally, perform inverse transformation on the components after threshold processing to obtain the reconstructed denoised signal.
Fig. 3Comparison of the frequency spectrum of the trip vibration signal before and after the introduction of noise: a) original signal; b) signal after noise injection
a)
b)
2.2.2. Noise reduction performance evaluation index
In this paper, the common threshold denoising method was selected for denoising experiments on the simulated signal. The main steps of threshold denoising are as follows: first, the signal is decomposed; second, the wavelet coefficients or modal components of the decomposed signal are subjected to threshold shrinkage; and finally, the components after threshold processing are inverse-transformed to obtain the reconstructed denoised signal. The threshold modes mainly include soft thresholding, hard thresholding, and other improved types. In this study, soft and hard thresholds were chosen to test the denoising effectiveness. In the case of soft thresholding, components with absolute values smaller than the threshold are directly set to zero, while components larger than the threshold have the threshold value subtracted. This method allows for smooth processing of the signal but may introduce bias. In the case of hard thresholding, only components with absolute values greater than the threshold are retained, with the rest set to zero. This method preserves more signal details but may lead to signal discontinuity.
Common threshold selection criteria include the minimum mean square error (MSE), unbiased risk estimation, and hypothesis testing. In practical applications, the choice of threshold depends on the specific task requirements, the characteristics of the signal, and the nature of the noise. It usually requires experimental comparisons of different threshold methods to select the most appropriate threshold setting, achieving the best balance between denoising effectiveness and signal distortion. In this study, the basic threshold was set to MSE, and the threshold was multiplied by a threshold coefficient. The denoising performance of each algorithm under different threshold sizes was compared through experiments.
For the selection of denoising metrics, signal-to-noise ratio (SNR), correlation coefficient (), and mean square error (MSE) were used as evaluation metrics. Besides these three metrics, some researchers also use power spectral density, SNR gain, and class separability to compare the effectiveness of different denoising algorithms. In practice, the choice of denoising metrics also needs to be determined based on the specific scenario.
(1) Signal-to-Noise Ratio (SNR).
The calculation method is shown in Eq. (9). The larger the SNR, the lower the noise content in the signal, indicating a better denoising effect.
(2) Correlation Coefficient ().
The SNR primarily demonstrates the overall similarity between the signal and the reference, but it may not sufficiently reflect the degree of local fitting. In this regard, the correlation coefficient can serve as a supplementary metric for evaluating the effectiveness of signal denoising. The calculation formula for the correlation coefficient is:
where represents the signal standard deviation, represents the signal covariance, and the range of the correlation coefficient is [–1, 1]. The closer it is to 1, the higher the signal correlation and the better the noise reduction effect.
(3) Mean Square Error (MSE).
Compared to the SNR, the smaller the MSE, the less noise there is in an absolute sense:
In the following denoising experiment, the denoising performance of different decomposition layers, threshold coefficients, and denoising modes under two noise levels was tested. SNR was used as the main denoising effect indicator, and and MSE were used as auxiliary judgment indicators.
3. Results and discussion
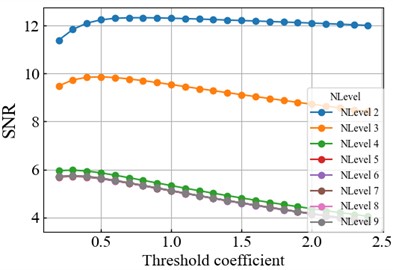
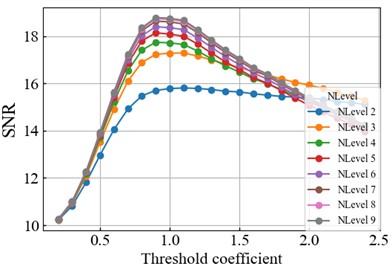
This section introduces DT-CWT for denoising experiments on circuit breaker simulated signals. Experiments were also conducted to compare the denoising performance under different threshold modes, decomposition levels, and threshold coefficients using the dual-tree complex wavelet decomposition. The changes in denoising effectiveness are shown in Fig. 4.
Fig. 4DT-CWT denoising experimental results: a) Soft threshold denoising; b) Hard threshold denoising
a)
b)
As shown in Fig. 4, the denoising effect of the hard threshold under DT-CWT decomposition is much better than that of the soft threshold denoising. In fact, the soft threshold denoising cannot play a positive denoising role in most cases, but introduces noise. In the hard threshold mode, DT-CWT can increase the signal-to-noise ratio of the signal with a signal-to-noise ratio of 10 to nearly 19 under the optimal number of denoising parameters.
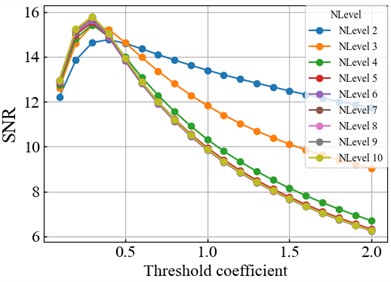
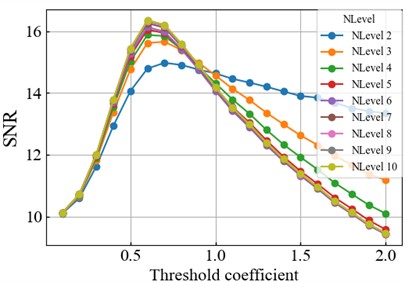
The wavelet threshold method is the most commonly used signal denoising method. The same experiment is conducted to compare the denoising effect changes brought by the number of decomposition layers and threshold coefficients under different thresholds modes in wavelet decomposition, as shown in Fig. 4. In the wavelet decomposition experiment, the signal-to-noise ratio is set to 10, and the basis function used is the commonly used db4 wavelet basis, which has good time-frequency localization characteristics and is widely used in signal denoising processing.
As can be seen from the Fig. 5, wavelet decomposition can achieve a good denoising effect when the decomposition layer is more than three layers. The threshold mode hardly affects the optimal denoising level, but the threshold coefficient value is inconsistent under different threshold modes. When the injected signal-to-noise ratio is 5, the optimal parameter for denoising shows a signal-to-noise ratio of 12 after denoising. When the injected signal-to-noise ratio is 10, the optimal parameter for denoising shows a signal-to-noise ratio of 16 after denoising.
Fig. 5Experimental results of wavelet decomposition denoising: a) soft threshold denoising; b) hard threshold denoising
a)
b)
Ensemble Empirical Mode Decomposition (EEMD) can effectively suppress the mode mixing problem inherent in Empirical Mode Decomposition (EMD). Its denoising principle involves introducing noise with a normal probability distribution and a constant power spectrum into the original vibration signal. The signal is then subjected to EMD decomposition multiple times, and the intrinsic mode functions (IMFs) obtained from each decomposition are averaged to cancel out the contained noise, thereby achieving signal denoising.
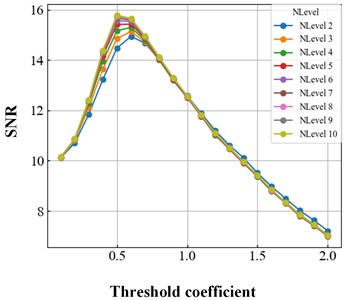
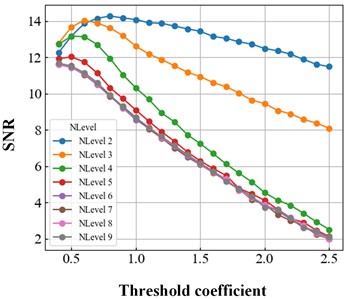
The experimental settings are identical to those of DT-CWT. Fig. 6 shows the denoising performance of EEMD under different threshold modes, decomposition levels, and threshold coefficients.
Fig. 6Experimental results of ensemble empirical mode decomposition: a) soft threshold denoising; b) hard threshold denoising
a)
b)
It can be seen from the Fig. 6 that EEMD achieves relatively better denoising performance under soft thresholding, which can improve the signal-to-noise ratio of a signal with an initial SNR of 10 to approximately 16, and its denoising effect is slightly inferior to that of traditional wavelet decomposition. Under the soft threshold mode, the number of decomposition layers has almost no significant impact on the denoising effect of EEMD, and increasing the number of decomposition layers beyond 5 provides negligible improvement in denoising performance. Meanwhile, EEMD suffers from excessively high computational time consumption, especially when processing long data sequences, where the time cost is very significant. Therefore, EEMD does not demonstrate ideal denoising performance on the simulated data used in this paper.
A comparison of the denoising performance of these methods reveals that DT-CWT achieves significantly better results than both traditional wavelet transform denoising and ensemble empirical mode decomposition denoising when applied to circuit breaker vibration signals.
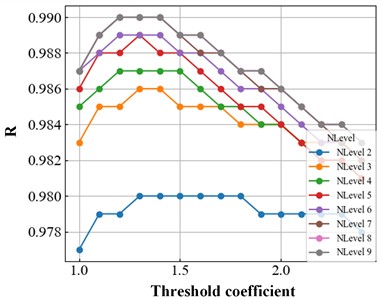
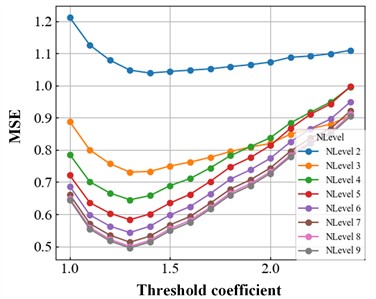
In order to further verify the effectiveness of DT-CWT denoising, the changes in the two evaluation indicators of correlation coefficient in the DT-CWT hard threshold denoising experiment are calculated as shown in Fig. 7.
Fig. 7Results indicators in the DT-CWT hard threshold denoising experiment: a) R change result; b) MSE change result
a)
b)
The experiment in Fig. 7 shows that DT-CWT also shows a good level of noise reduction in terms of correlation coefficient and mean square error. In the noise reduction of simulated noise signals, the correlation coefficient can reach up to 0.99, and the mean square error can reach as low as 0.5. The optimal threshold coefficient of the SNR indicator on simulated noise is around 1.0, while the threshold coefficients of the R and MSR indicators are as high as around 1.3. Under high noise levels, the threshold coefficient needs to be appropriately increased, and the difference between 1.5 and 2.0 is not large. At the same time, it can be found that after the number of decomposition layers increases to 7 layers, the improvement level of the noise reduction effect becomes very small, so there is no need to perform too deep decomposition to increase the computational burden.
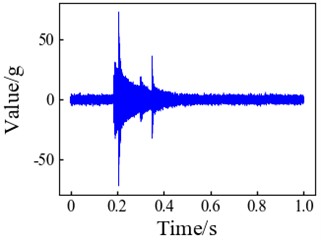
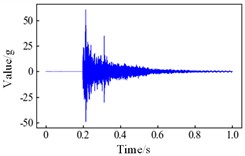
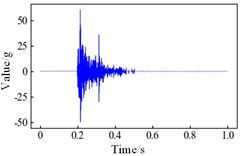
In summary, DT-CWT hard threshold denoising is a good denoising scheme among the algorithms attempted in this paper. For signals with low noise levels, the optimal thresholds of the three indicators of SNR, , and MSE are taken as the middle value, the threshold coefficient is set to 1.2, and the number of decomposition layers is selected as 7-layer denoising. Under this parameter, the optimal denoising effect of DT-CWT under low-level noise can be approximately achieved. Different levels of noise are injected into the simulation signal to verify the denoising effect at this time, as shown in Fig. 7. It can be found that the signal can be approximately restored to a noise-free state under SNR = 10 and SNR = 7 noise conditions, but the denoising effect will still be affected if the noise level continues to increase. At SNR = 5, the noise effect cannot be completely eliminated after denoising, which indicates that the algorithm has limited processing capability for signals with high noise levels. The results of DT-CWT processing on signals with different noise levels are shown in Fig. 8.
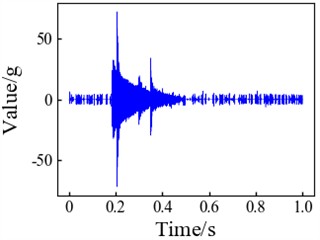
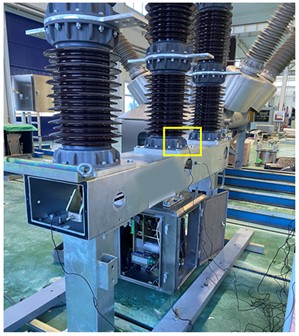
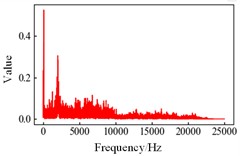
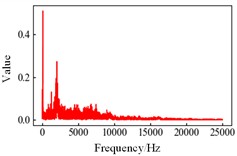
We placed the vibration sensor at the top of the beam at the location of the fastening screws as shown in Fig. 9(a). The DT-CWT hard threshold mode is further used to perform noise reduction on the measured signal. The experiment found that the noise reduction parameters with a threshold coefficient of 1.2 and a decomposition layer number of 7 achieved a good noise reduction effect on the real gate opening vibration signal. The time domain and frequency domain waveforms of the signal before and after noise reduction are shown in Fig. 9(b)-(e). As shown in Fig. 9(b) and Fig. 9(c), after noise reduction, the signal has an attenuation trend similar to the simulated signal in the time domain waveform. It can be seen that the signal is closer to the ideal waveform of the superposition of exponentially decaying sine waves after decomposition. Observing the high-frequency components of the spectrum before and after noise reduction in Fig. 9(d) and Fig. 9(e), it can be found that the high-frequency noise above 10 kHz is significantly suppressed. It can be judged that DT-CWT plays an effective role in noise reduction of the measured vibration signal.
Fig. 8DT-CWT processing signals with different noise levels: a) signal with SNR = 10; b) SNR = 10 after noise reduction; c) signal with SNR = 7; d) SNR = 7 after noise reduction; e) signal with SNR = 5, f) SNR = 5 after noise reduction
a)
b)
c)
d)
e)
f)
4. Conclusions
This study establishes the superior efficacy of the Dual-Tree Complex Wavelet Transform in denoising vibration signals from high-voltage circuit breakers compared to traditional wavelet methods. Through comprehensive experimentation, several key findings emerged regarding signal enhancement and parameter optimization.
Fig. 9Denoising effect of circuit breaker vibration signal: a) installation position of the vibration sensor; b) time domain signal before noise reduction; c) time domain signal after noise reduction; d) signal spectrum before noise reduction; e) signal spectrum after noise reduction. Photo 9(a) was taken by the authors during a circuit breaker fault simulation experiment, on 04.16.2025, at Shandong Taikai High Voltage Switchgear Co., Ltd. in the city of Taian
a)
b)
c)
d)
e)
Simulation results demonstrated that DT-CWT utilizing hard thresholding significantly outperforms soft thresholding. Under optimal conditions, this approach improved the Signal-to-Noise Ratio (SNR) from 10 to nearly 19, effectively distinguishing signal components from noise without introducing artifacts. Quantitative evaluations further confirmed high signal fidelity, achieving a correlation coefficient of 0.99 and a Mean Square Error (MSE) of 0.5.
Regarding parameter optimization, the study suggests a practical limit of seven decomposition layers to balance performance with computational complexity. Additionally, specific threshold coefficients were identified for varying noise environments, with a coefficient of 1.2 proving optimal for low-noise conditions.
Finally, experimental validation on actual circuit breaker data confirmed the method's practical utility. DT-CWT successfully suppressed high-frequency interference (particularly above 10 kHz) in both time and frequency domains. In summary, DT-CWT provides a robust, high-accuracy solution for mechanical signal processing, offering a solid foundation for advanced fault diagnosis in industrial settings.
References
-
S. Ma, Y. Yuan, J. Wu, Y. Jiang, B. Jia, and W. Li, “Multisensor decision approach for HVCB fault detection based on the vibration information,” IEEE Sensors Journal, Vol. 21, No. 2, pp. 985–994, Jan. 2021, https://doi.org/10.1109/jsen.2020.2980081
-
R. Zhuo et al., “Basing on vibration signal and improved neural network research on contact state recognition model of SF6 high voltage circuit breaker,” in 2023 International Conference on Power System Technology (PowerCon), pp. 1–6, Sep. 2023, https://doi.org/10.1109/powercon58120.2023.10331146
-
A. Janssen, D. Makareinis, and C.-E. Solver, “International surveys on circuit-breaker reliability data for substation and system studies,” IEEE Transactions on Power Delivery, Vol. 29, No. 2, pp. 808–814, Oct. 2013, https://doi.org/10.1109/tpwrd.2013.2274750
-
X. Zhang, E. Gockenbach, Z. Liu, H. Chen, and L. Yang, “Reliability estimation of high voltage SF6 circuit breakers by statistical analysis on the basis of the field data,” Electric Power Systems Research, Vol. 103, pp. 105–113, Jun. 2013, https://doi.org/10.1016/j.epsr.2013.04.014
-
Q. Yang et al., “Parameter adaptive noise reduction method for mechanical vibration signals of high-voltage circuit breakers,” (in Chinese), High Voltage Engineering, Vol. 47, pp. 4274–4287, Oct. 2021, https://doi.org/10.13336/j.1003-6520.hve.20201244
-
S. Wang, Y. Zhou, and Z. Ma, “Research on fault identification of high-voltage circuit breakers with characteristics of voiceprint information,” Scientific Reports, Vol. 14, No. 1, p. 9340, Apr. 2024, https://doi.org/10.1038/s41598-024-59999-0
-
S. Chen, Y. Feng, Y. Jiang, Y. Zheng, J. Huang, and L. Yu, “Simulation of fault analysis model for high-voltage circuit breaker spring mechanism based on decision tree algorithm,” in 3rd International Conference on Electrical Engineering and Control Science (IC2ECS), pp. 1313–1316, Dec. 2023, https://doi.org/10.1109/ic2ecs60824.2023.10493421
-
J. Wang, Z. He, Y. Ji, L. Zhao, and Y. Wu, “Fault diagnosis algorithm on spring operating mechanism for high voltage circuit breaker and load switch based on motor current,” (in Chinese), High Voltage Apparatus, Vol. 60, No. 5, pp. 39–45, May 2024, https://doi.org/10.13296/j.1001-1609.hva.2024.05.005
-
Q. Liu, Y. Wang, X. Liu, D. Yang, and G. Du, “Mechanical defect diagnosis of high voltage circuit breakers based on the combination of stroke curve and current signal,” Electrical Engineering, Vol. 106, No. 1, pp. 1093–1103, Oct. 2023, https://doi.org/10.1007/s00202-023-02045-5
-
S. Sun, L. Sun, J. Wang, and H. Gao, “Fault diagnosis of conventional circuit breaker accessories based on grayscale image of current signal and improved ZFNet-DRN,” IEEE Sensors Journal, Vol. 23, No. 2, pp. 1343–1356, Jan. 2023, https://doi.org/10.1109/jsen.2022.3225189
-
J. O. D. Reis et al., “On the use of vibration analysis for contact fault detection in high-voltage HVCBs,” Brazilian Archives of Biology and Technology, Vol. 66, p. e23230286, Jul. 2023, https://doi.org/10.1590/1678-4324-2023230286
-
M. Al-Farouni, A. V. V. Sudhakar, D. G., B. D. V., and G. Shivakanth, “Machinery fault diagnoses in high-voltage circuit breakers using empirical mode decomposition-support vector machine model,” in 2024 Third International Conference on Distributed Computing and Electrical Circuits and Electronics (ICDCECE), pp. 1–4, Apr. 2024, https://doi.org/10.1109/icdcece60827.2024.10549320
-
Q. Yang, Z. Wang, Y. Liu, Y. Cai, and P. Zhai, “A feature enhancement method for operating sound signal of high voltage circuit breaker based on VMD-wavelet threshold,” in Lecture Notes in Electrical Engineering, Singapore: Springer Nature Singapore, 2024, pp. 90–98, https://doi.org/10.1007/978-981-97-1068-3_10
-
S. Zhao, E. Wang, and J. Hao, “Fault diagnosis method for energy storage mechanism of high voltage circuit breaker based on CNN characteristic matrix constructed by sound-vibration signal,” Journal of Vibroengineering, Vol. 21, No. 6, pp. 1665–1678, Sep. 2019, https://doi.org/10.21595/jve.2019.20781
-
L. Mu, Z. Sun, Y. Zhao, N. Wei, Y. Wang, and C. Liu, “Research on the extraction method of high-voltage circuit breaker vibration signal based on IVMD,” in 2021 International Conference on Advanced Electrical Equipment and Reliable Operation (AEERO), pp. 1–6, Oct. 2021, https://doi.org/10.1109/aeero52475.2021.9708267
-
Q. Yang, J. Ruan, Z. Zhuang, D. Huang, and Z. Qiu, “A new vibration analysis approach for detecting mechanical anomalies on power circuit breakers,” IEEE Access, Vol. 7, pp. 14070–14080, Jan. 2019, https://doi.org/10.1109/access.2019.2893922
-
Y. Pan, F. Mei, H. Miao, J. Zheng, K. Zhu, and H. Sha, “An approach for HVCB mechanical fault diagnosis based on a deep belief network and a transfer learning strategy,” Journal of Electrical Engineering and Technology, Vol. 14, No. 1, pp. 407–419, Jan. 2019, https://doi.org/10.1007/s42835-018-00048-y
-
S. Chauhan, G. Vashishtha, and P. Kaur, “An effective approach to rotatory fault diagnosis combining CEEMDAN and feature-level integration,” Algorithms, Vol. 18, No. 10, p. 644, Oct. 2025, https://doi.org/10.3390/a18100644
-
G. Vashishtha and R. Kumar, “An effective health indicator for the Pelton wheel using a Levy flight mutated genetic algorithm,” Measurement Science and Technology, Vol. 32, No. 9, p. 094003, Sep. 2021, https://doi.org/10.1088/1361-6501/abeea7
-
K. Obarcanin, B. Lacevic, and M. Ermidoro, “A high-voltage circuit breaker condition assessment method using the vibration fingerprint based on VMD-EM method,” in IEEE International Instrumentation and Measurement Technology Conference (I2MTC), pp. 1–6, Jun. 2020, https://doi.org/10.1109/i2mtc43012.2020.9128669
-
N. Charbkaew, T. Suwanasri, T. Bunyagul, and A. Schnettler, “Vibration signal analysis for condition monitoring of puffer-type high-voltage circuit breakers using wavelet transform,” IEEJ Transactions on Electrical and Electronic Engineering, Vol. 7, No. 1, pp. 13–22, Jan. 2011, https://doi.org/10.1002/tee.21690
-
Z. Yu, S. Du, Y. Song, and R. Zhang, “Construction of intelligent automation control system for high voltage circuit breakers based on wavelet transform,” in International Conference on Electrical Drives, Power Electronics and Engineering (EDPEE), pp. 124–128, Jun. 2024, https://doi.org/10.1109/edpee61724.2024.00030
-
I. W. Selesnick, R. G. Baraniuk, and N. C. Kingsbury, “The dual-tree complex wavelet transform,” IEEE Signal Processing Magazine, Vol. 22, No. 6, pp. 123–151, Dec. 2005, https://doi.org/10.1109/msp.2005.1550194
-
F. Yu and Y. Zhu, “Fault diagnosis of reducer based on dual-tree complex wavelet packet and morphology,” in 2023 Global Reliability and Prognostics and Health Management Conference (PHM-Hangzhou), pp. 1–4, Oct. 2023, https://doi.org/10.1109/phm-hangzhou58797.2023.10482765
-
K. Zhao, Y. Zhang, T. Sun, and Z. Wang, “Study on denoising of vibration signals based on improved DT-CWPT,” in 3rd International Conference on Computer Science and Blockchain (CCSB), pp. 48–52, Nov. 2023, https://doi.org/10.1109/ccsb60789.2023.10398800
-
G. Y. Chen and A. Krzyzak, “Wavelet-based 3D data cube denoising using three scales of dependency,” Circuits, Systems, and Signal Processing, Vol. 43, No. 6, pp. 4010–4020, Jun. 2024, https://doi.org/10.1007/s00034-024-02638-w
-
Z. Lu et al., “Partial discharge signal denoising based on DualTree complex wavelet transform combined with thresholding,” in 2019 IEEE 3rd International Electrical and Energy Conference (CIEEC), pp. 1450–1453, Sep. 2020, https://doi.org/10.1109/cieec47146.2019.cieec-2019529
-
N. Huang, H. Chen, G. Cai, L. Fang, and Y. Wang, “Mechanical fault diagnosis of high voltage circuit breakers based on variational mode decomposition and multi-layer classifier,” Sensors, Vol. 16, No. 11, p. 1887, Nov. 2016, https://doi.org/10.3390/s16111887
-
Y. Meng, S. Jia, Z. Shi, and M. Rong, “The detection of the closing moments of a vacuum circuit breaker by vibration analysis,” IEEE Transactions on Power Delivery, Vol. 21, No. 2, pp. 652–658, Apr. 2006, https://doi.org/10.1109/tpwrd.2005.855475
About this article

This work was supported by the State Grid Zhenjiang Power Supply Company Science and Technology Project Funding (Project No. J2024055).
The datasets generated during and/or analyzed during the current study are available from the corresponding author on reasonable request.
Youjia Tang: investigation, methodology. Miao Qi: writing-original draft. Biao Cai: supervision. Fuqun Zhang: writing-review and editing.
The authors declare that they have no conflict of interest.

