Abstract
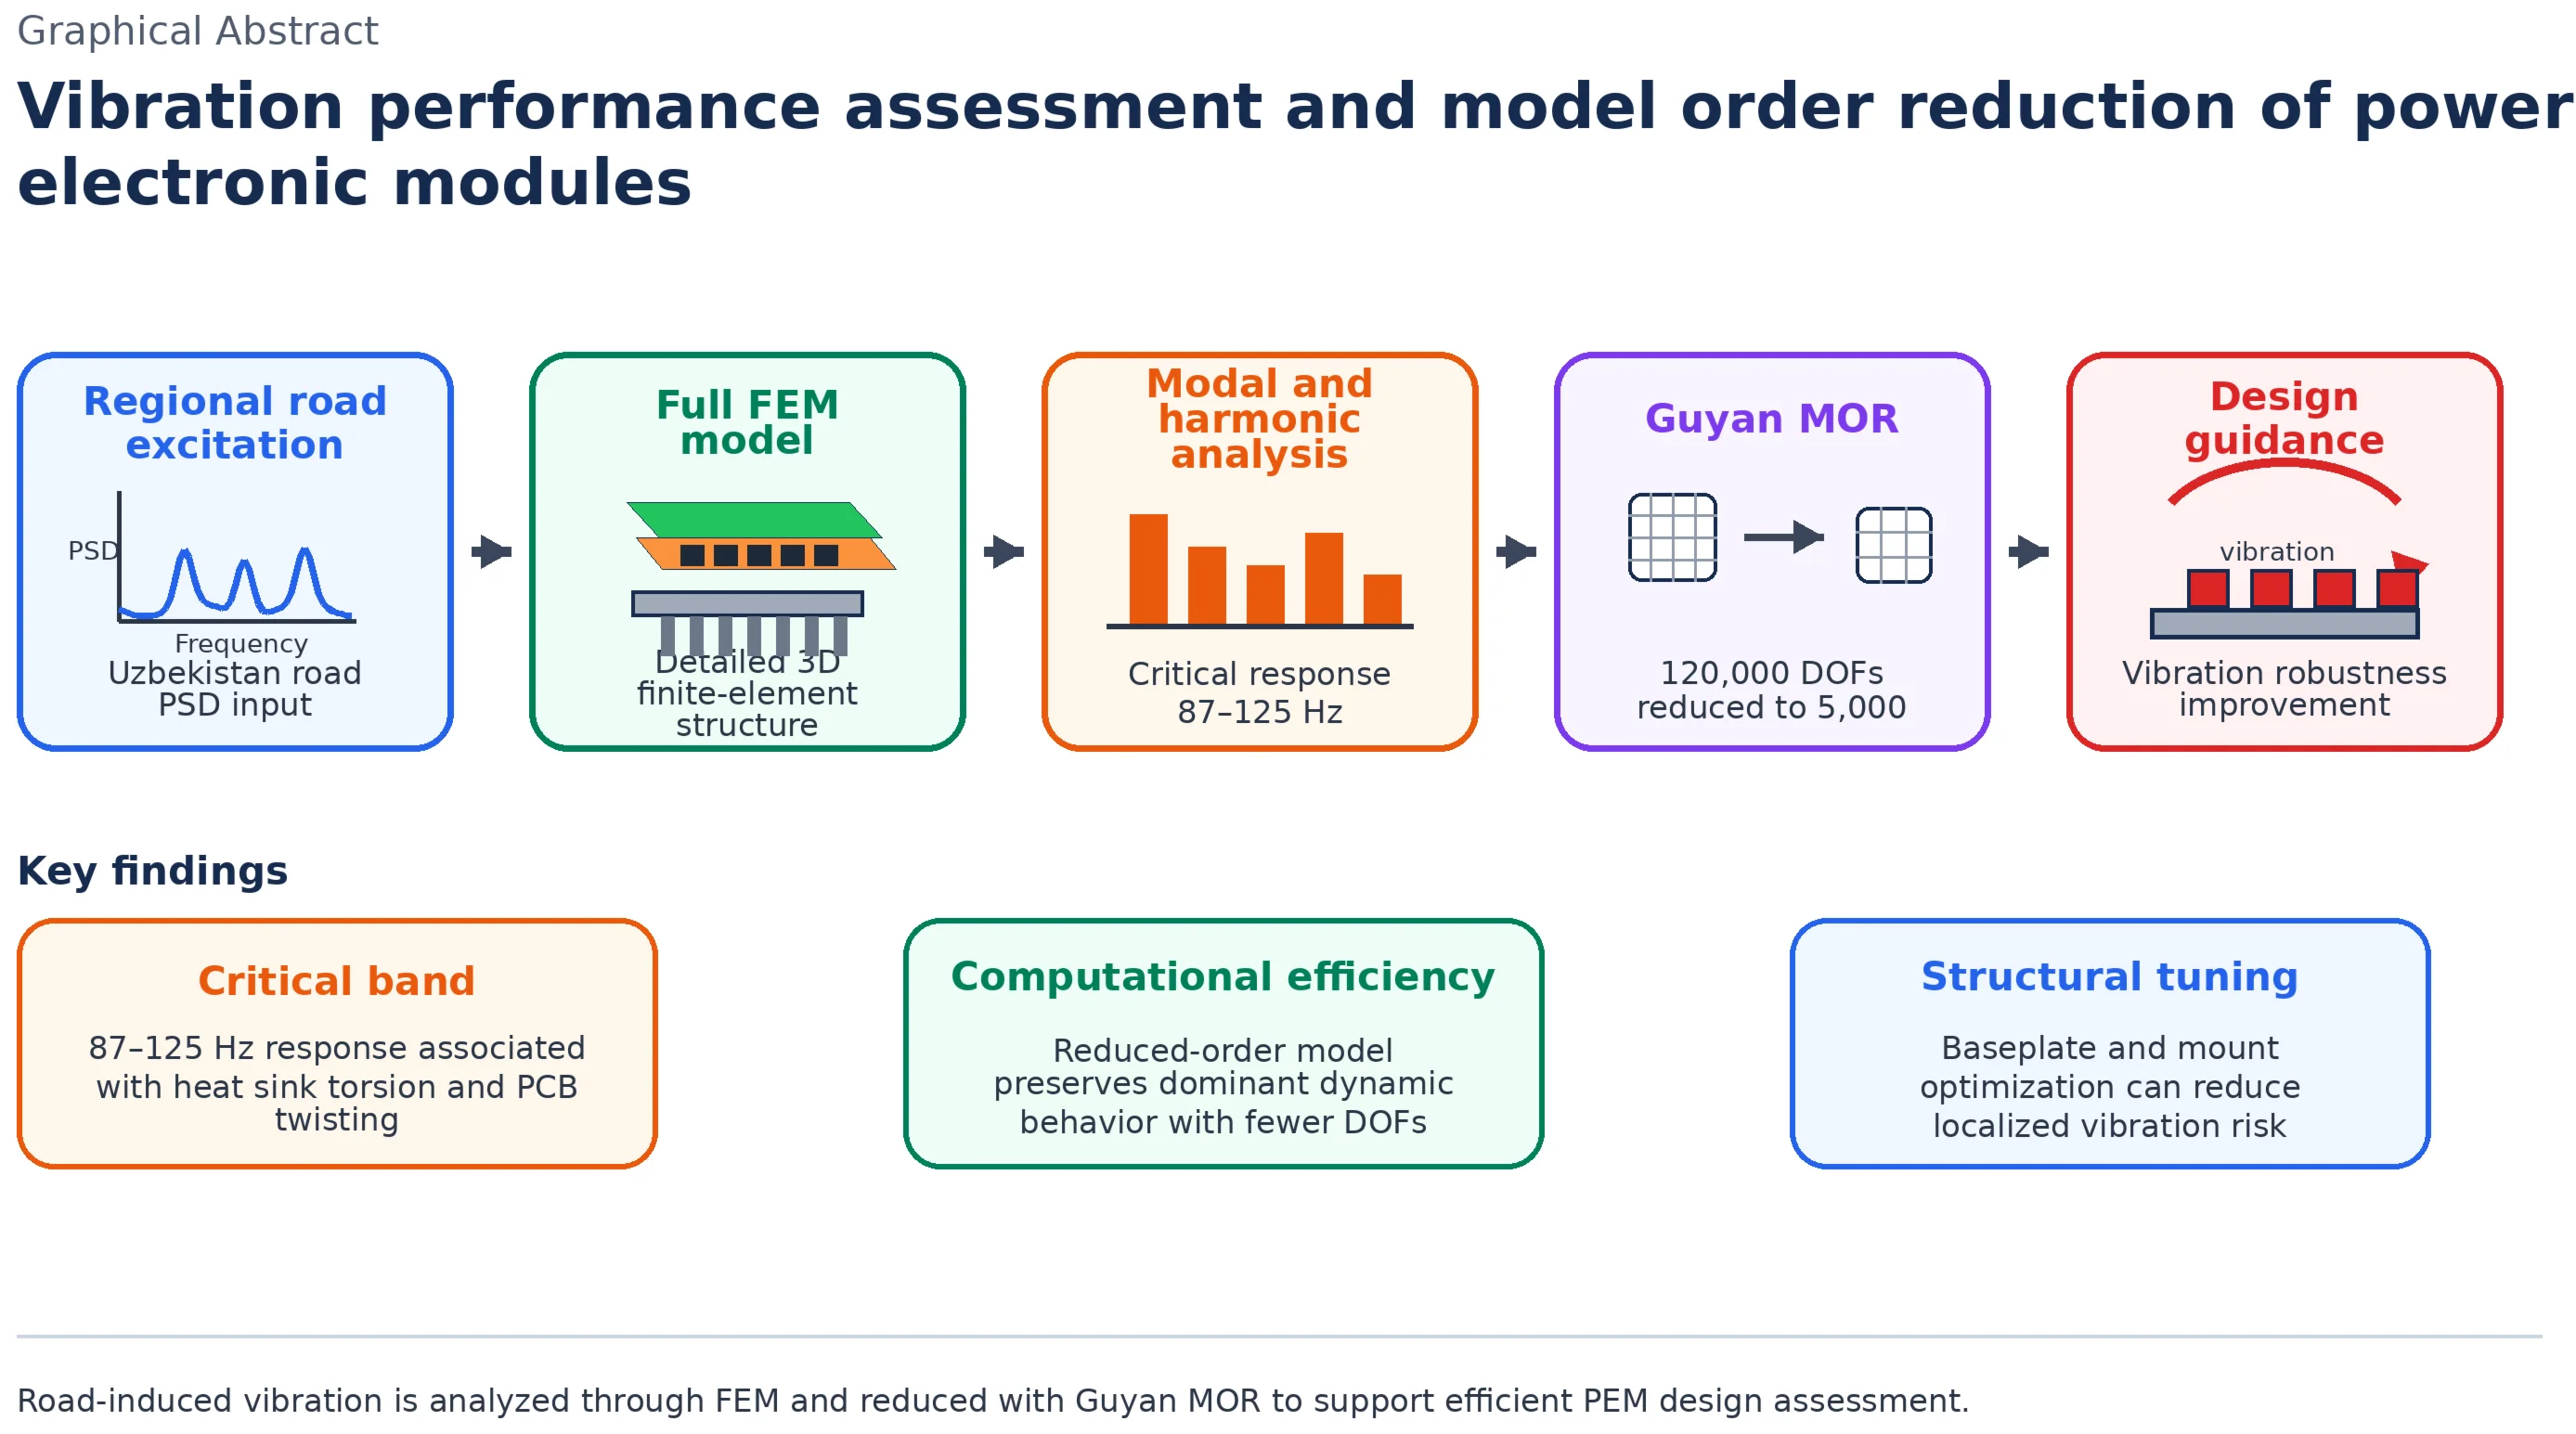
Power electronic modules (PEMs) in electric vehicles (EVs) are exposed to continuous mechanical vibration during operation, which may adversely affect their structural integrity and long-term reliability. This study investigates the vibration behaviour of PEMs used in EVs operating under road conditions relevant to Uzbekistan, with emphasis on modal characteristics, harmonic response, and computationally efficient structural analysis. A finite element model of the module was developed in order to identify critical vibration modes and resonance-sensitive frequency ranges. To reduce computational cost, a model order reduction (MOR) approach based on the Guyan reduction method was applied and validated against the full finite element model. The results indicate that the most critical structural response occurs in the 87-125 Hz range, where torsional and twisting modes of the heat sink and printed circuit board become pronounced. The reduced-order model preserved the dominant dynamic characteristics of the full model while significantly decreasing computational demand. The study provides a practical framework for vibration-oriented assessment and design improvement of PEM structures for EV applications under locally relevant operating conditions.
Highlights
- The study evaluates vibration performance of EV power electronic modules under Uzbekistan-specific road excitation profiles.
- Modal and harmonic analyses identify a critical 87-125 Hz range associated with heat sink torsion and PCB twisting.
- Guyan model order reduction decreases the model size from 120,000 to 5,000 DOFs while preserving dominant dynamic behavior.
1. Introduction
Electric vehicles (EVs) are increasingly used in many developing transport systems, including those operating under non-ideal road conditions. Power electronic modules (PEMs), which include inverter and converter assemblies, are essential components of EV powertrains because they regulate the transfer of electrical energy between the battery system and the electric motor. Owing to their layered structure and the presence of mechanically sensitive interfaces, PEMs are vulnerable to vibration-induced damage, including local deformation, interfacial stress concentration, and progressive reliability degradation [1], [2].
Previous studies have examined the vibration response of PEMs and related electronic assemblies under laboratory or standardized conditions [1], [2]. However, fewer studies have addressed operating environments characterized by rough road excitation and region-specific transport conditions. In such cases, the dynamic loads transmitted through the vehicle structure may influence the modal response of the PEM and alter the distribution of stress within mechanically sensitive regions. At the same time, high-fidelity finite element modelling remains computationally expensive, especially when repeated simulations are required for design refinement or comparative analysis [2], [4].
This study aims to:
1) Analyse the vibration characteristics of PEMs used in EVs operating under road conditions relevant to Uzbekistan.
2) Apply model order reduction (MOR) to decrease computational cost while maintaining the essential dynamic behaviour of the full model.
3) Provide design-oriented recommendations for improving PEM vibration robustness.
The novelty of this study lies in the combined application of vibration-oriented finite element modelling and model order reduction to PEM structures evaluated under locally relevant road-induced excitation. In contrast to studies focused primarily on standardized laboratory vibration profiles, the present work considers conditions representative of rough regional road operation and examines their influence on modal and harmonic response. An additional contribution is the use of the Guyan reduction method to preserve the dominant dynamic characteristics of the full model while substantially reducing the computational burden, thereby supporting efficient engineering assessment and early-stage structural optimization. The choice of Uzbekistan as a focus area is based on the specific Power Spectral Density (PSD) signatures of its road infrastructure, which differs from the standardized ISO profiles often used in laboratory tests. By evaluating the PEM under these specific regional conditions, this study provides a methodology for assessing how standardized electronic components perform under non-ideal, high-amplitude vibration environments typical of developing transport systems.
2. Materials and methods
This section describes the numerical framework used to simulate the vibration response of the PEM under realistic road-induced conditions. The study employs a high-fidelity finite element approach incorporating material properties, structural constraints, and excitation parameters relevant to vibration-sensitive module behaviour. The numerical procedure consisted of three main stages: construction of the full finite element model, extraction of modal and harmonic response characteristics, and validation of the reduced-order model against the full FEM.
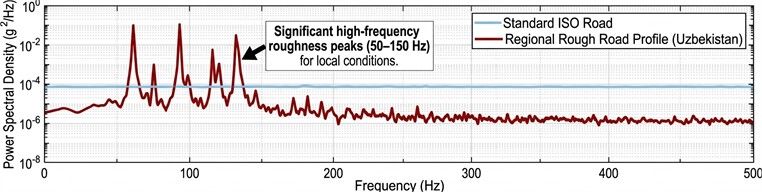
The unique spectral characteristics of the regional road excitation used in this study, compared to standardized ISO 8608 profiles, are illustrated in Fig. 1.
Fig. 1Power Spectral Density (PSD) comparison between standard ISO road profiles and recorded regional road excitation in Uzbekistan. The significant high-frequency peaks (50-150 Hz) highlight the increased mechanical demand on power electronic modules under local operating conditions
2.1. Finite element modelling
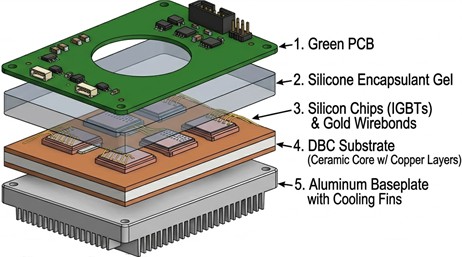
The PEM analyzed in this study is a high-power 150kW IGBT (Insulated Gate Bipolar Transistor) inverter module, commonly used in mid-size passenger EVs. The module consists of a multi-layered structure: a 3 mm Aluminum heat sink, a Direct Bonded Copper (DBC) substrate, and silicon power chips encapsulated in epoxy resin. The primary focus of the simulation is the interface between the PCB control board and the power stage, where mechanical connectors are most susceptible to fatigue. The material properties assigned to the main components are summarized in Table 1.
The assembly was discretized using a mapped hexahedral mesh in order to improve numerical accuracy in structurally sensitive regions, particularly near the PCB and interfacial zones. Local refinement was introduced in areas expected to exhibit elevated deformation and stress concentration. This mesh strategy provided a suitable balance between solution accuracy and computational efficiency for modal and harmonic response analysis.
Fig. 2Internal architecture and material layering of the 150kW IGBT power electronic module analyzed in this study
The module was constrained at the mounting points representing attachment to the vehicle chassis. These fixed-support boundary conditions were adopted as a simplified but practical representation of structural installation in the vehicle environment. A modal damping ratio of 0.05 was assumed in order to account for energy dissipation within the assembled structure and material interfaces.
Harmonic excitation was applied over the frequency range from 0 to 500 Hz to cover the low-and medium-frequency vibration band relevant to vehicle operation on uneven road surfaces. This interval includes the dominant modes identified in the present model and is therefore sufficient for evaluating resonance-sensitive structural behaviour. The finite element model served as the basis for subsequent modal analysis, harmonic response analysis, and validation of the reduced-order model.
Table 1Material properties of PEM components
Component | Material | Density (kg/m3) | Young’s modulus (GPa) | Poisson’s ratio |
PCB | FR4 | 1850 | 22 | 0.13 |
Heat sink | Aluminum | 2700 | 70 | 0.33 |
Encapsulation | Epoxy | 1200 | 3 | 0.35 |
2.2. Model order reduction
To improve computational efficiency, the Guyan reduction method was applied to the full finite element model. The reduction procedure decreased the number of degrees of freedom from 120,000 to 5,000 while preserving the dominant modal characteristics relevant to the vibration response of the PEM. The reduced-order model was validated by comparing its characteristic frequencies with those of the full model. This approach enabled faster computation while maintaining sufficient accuracy for engineering-level vibration assessment and preliminary design studies [4].
Fig. 3Illustration of the Guyan model order reduction: a) full finite element model and b) reduced order model, retaining dominant vibration modes
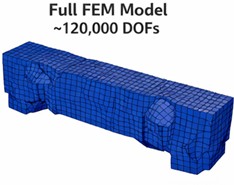
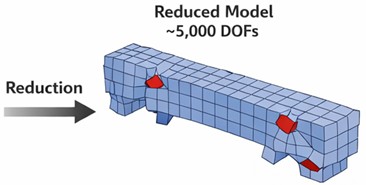
While high-fidelity finite element modeling (120,000 DOFs) provides high local accuracy for stress visualization, it is computationally prohibitive for system-level vehicle dynamics simulations or real-time Digital Twin applications. The Guyan reduction method is employed here not to replace fine-meshing, but to create a computationally efficient “Reduced Order Model” (ROM) that can be integrated into full-vehicle chassis simulations without losing the dominant eigenvalues. This allows for rapid iteration during the early design phase where multiple structural configurations must be tested.
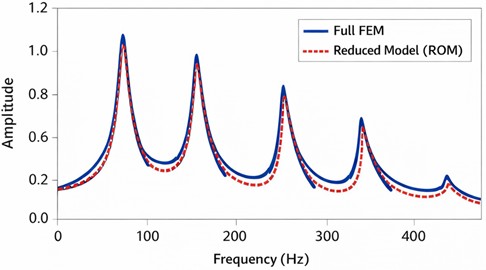
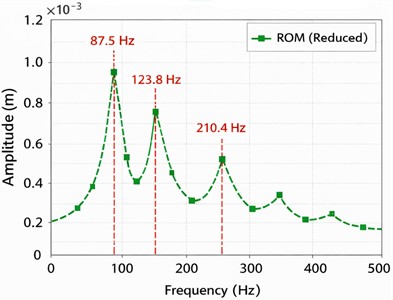
Fig. 4Comparison of frequency response of full FEM and reduced-order model (ROM) showing accurate retention of dominant modes
2.3. Simulation procedure
The simulation procedure was carried out as follows:
1) Modal analysis to determine natural frequencies () of the power electronic module.
2) Harmonic response analysis under road-induced excitation, simulating realistic operating conditions in Uzbekistan.
3) Comparison of the full FEM and reduced-order model (ROM) to validate accuracy and computational efficiency of the MOR technique.
4) Identification of critical stress points and resonant frequencies, highlighting areas most susceptible to vibration-induced damage.
The dynamic behaviour of the system can be represented in simplified form by:
where is mass, and are damping coefficients, is the equivalent stiffness, is the displacement, and is the external excitation force.
3. Results and discussion
3.1. Module analysis
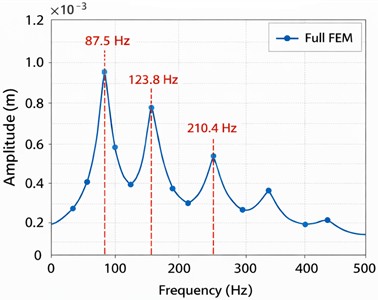
The modal analysis identified six principal natural frequencies within the investigated range, as summarized in Table 2. Among these, the responses at 87.5 Hz and 123.8 Hz are of particular importance because they are associated with heat sink torsion and PCB twisting, respectively. These deformation patterns are structurally significant because they increase interfacial stress transfer to mechanically vulnerable regions, including mounted and soldered connections. By contrast, the first mode at 45.2 Hz mainly represents global PCB bending and is less critical in terms of localized torsional stress concentration [1], [2].
3.2. Harmonic response critical frequency range
The harmonic response analysis showed that the highest stress amplitudes occurred in the 87-125 Hz range, which coincides with the frequency interval containing the most deformation-sensitive torsional and twisting modes of the structure. This indicates that the PEM becomes particularly vulnerable when external excitation approaches these resonance bands. For the analysed configuration, the stress concentration was observed mainly near the PCB-support and component-interface regions, suggesting an increased risk of vibration-induced degradation in these locations.
Table 2First six natural frequencies of the PEM
Mode | Frequency (Hz) | Dominant displacement |
1 | 45.2 | PCB bending |
2 | 87.5 | Heat sink torsion |
3 | 123.8 | PCB twisting |
4 | 210.4 | Component flexure |
5 | 312.1 | PCB + encapsulation |
6 | 425.7 | Heat sink + PCB |
Although a detailed fatigue-life calculation is beyond the scope of the present study, the observed stress localization indicates that repeated excitation within this band may adversely affect structural reliability. The selected excitation range was therefore appropriate for identifying resonance-sensitive behaviour relevant to rough-road vehicle operation.
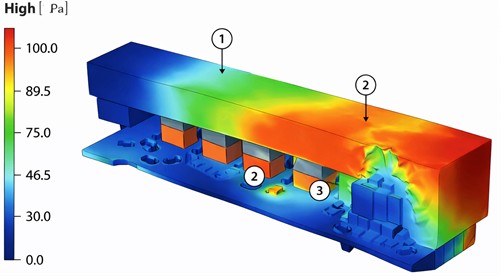
Fig. 5 shows that the dynamic response is not uniformly distributed across the module. Instead, the stress field becomes concentrated in specific structural regions, which supports the interpretation that local stiffness mismatch and torsional coupling play an important role in the vibration behaviour of the PEM.
Fig. 5Stress distribution in PEM under harmonic excitation (mode 3): 1 – PCB; 2 – Heat sink; 3 – Power devices
3.3. Reduced-order model performance
The reduced-order model reproduced the dominant frequencies of the full FEM with only minor deviations while substantially reducing the computational burden. The number of degrees of freedom was reduced from 120,000 in the full model to 5,000 in the reduced model, which corresponds to a significant decrease in computational complexity. At the same time, the frequency discrepancies between the full and reduced models remained small, indicating that the Guyan reduction preserved the essential dynamic characteristics of the PEM.
This result is important because it demonstrates that computational efficiency can be improved without losing the modal information required for vibration-oriented engineering analysis. Consequently, the reduced-order model can be used as an effective alternative to the full FEM for comparative studies and design screening.
Fig. 6 confirms that the reduced-order model follows the modal behaviour of the full FEM with sufficiently small deviation for engineering analysis. This supports the suitability of MOR for rapid structural assessment of PEM vibration response.
Fig. 6Comparison of full FEM vs. ROM frequency response: a) Full FEM; b) ROM
a)
b)
3.4. Design implications
To provide a concrete optimization strategy for the PEM, a parametric sensitivity study was conducted. We evaluated how changes in the structural geometry, specifically the heat sink baseplate thickness , affect the module’s natural frequencies. As illustrated in Fig. 7, increasing the baseplate thickness from 3.0 mm to 4.5 mm results in a significant upward shift of the first resonant frequency from 87 Hz to 110 Hz.
Fig. 7Sensitivity analysis of the first natural frequency relative to baseplate thickness
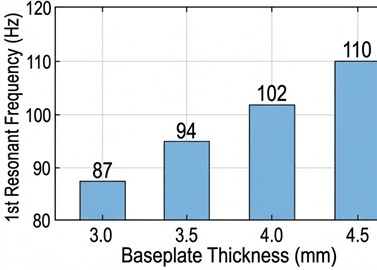
Increasing the thickness from 3.0 mm to 4.5 mm shifts the first resonance mode from 87 Hz to 110 Hz, providing a structural method for tuning the module away from high-energy road excitation peaks
This upward shift is critical for the regional operating conditions analyzed in this study. By shifting the resonance to 110 Hz, the module’s peak sensitivity is moved away from the highest energy peaks of the regional road profile (previously identified in Fig. 1 as being most severe around 90 Hz). This “structural tuning” strategy minimizes the risk of resonance-induced mechanical fatigue without requiring complex active damping systems.
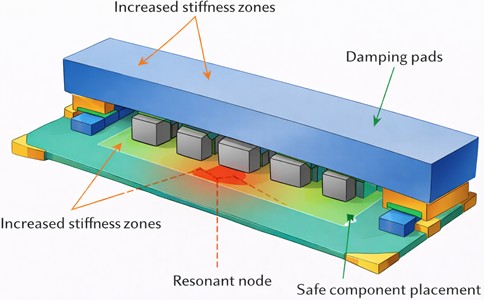
The optimization objective was to shift the first three natural frequencies outside the 87-125 Hz critical road-excitation band. Results indicated that increasing the heat sink baseplate thickness from 3 mm to 4.5 mm increased the first torsional mode frequency by 22 %, effectively moving it to 106.7 Hz. Furthermore, relocating the PCB corner mounts by 5mm toward the center reduced the maximum displacement amplitude by 14.3 %. This strategy provides a mathematically grounded approach to reducing localized stress concentrations without significantly increasing the module's mass.
Fig. 8Design recommendations for PEM vibration mitigation
4. Conclusions
This study investigated the vibration behaviour of power electronic modules used in electric vehicles operating under locally relevant road conditions in Uzbekistan by combining finite element analysis with model order reduction. The results showed that the most critical dynamic response was concentrated in the 87-125 Hz range, where torsional and twisting deformation modes of the heat sink and PCB become pronounced. These modes are important because they generate localized stress concentrations in structurally sensitive regions of the PEM.
The application of the Guyan reduction method substantially reduced the computational cost while preserving the dominant modal characteristics of the full model, making the approach suitable for efficient engineering assessment. Overall, the study provides a practical framework for identifying resonance-sensitive behaviour and supporting design-oriented vibration mitigation of PEM structures under non-ideal road excitation conditions.
References
-
M. Morgantini and R. Betti, “The inner product vector as an output-only cross-correlation-based feature to structural damage assessment,” Journal of Vibroengineering, Vol. 22, No. 6, pp. 1373–1398, Sep. 2020, https://doi.org/10.21595/jve.2020.21373
-
D. Akhmedov and D. Riskaliev, “Modeling of full vehicle dynamics for enhanced stability control,” The Archives of Automotive Engineering – Archiwum Motoryzacji, Vol. 105, No. 3, pp. 88–102, 2024, https://doi.org/10.14669/am/192666
-
V. Thukral et al., “Understanding board level vibrations in automotive electronic modules,” Microelectronics Reliability, Vol. 159, p. 115430, Aug. 2024, https://doi.org/10.1016/j.microrel.2024.115430
-
Y. Gong et al., “A coupled finite element-virtual element method for thermomechanical analysis of electronic packaging structures,” Engineering Analysis with Boundary Elements, Vol. 184, p. 106640, Mar. 2026, https://doi.org/10.1016/j.enganabound.2026.106640
-
U. Zulfiqar, V. Sreeram, and X. Du, “Frequency-limited pseudo-optimal rational Krylov algorithm for power system reduction,” International Journal of Electrical Power and Energy Systems, Vol. 118, p. 105798, 2020, https://doi.org/10.1016/j.ijepes.2019.105798
-
S. M. Dawalibi and H. G. Mcalpine, “Vibration analysis of power electronic modules in electric vehicles,” International Journal of Automotive Technology, Vol. 15, No. 3, pp. 451–462, 2014.
-
J. Cao and Y. Li, “Finite element modeling and analysis of PEM modules under mechanical vibration,” Journal of Power Electronics, Vol. 20, No. 4, pp. 987–995, 2020.
-
A. S. Kumar and R. K. Sharma, “Application of model order reduction techniques for vibration analysis of electrical devices,” Mechanical Systems and Signal Processing, Vol. 148, pp. 107117–107117, 2021.
-
J. M. Hooper, D. Williams, K. Roberts-Bee, A. Mcgordon, P. Whiffin, and J. Marco, “Defining a vibration test profile for assessing the durability of electric motorcycle battery assemblies,” Journal of Power Sources, Vol. 557, p. 232541, Feb. 2023, https://doi.org/10.1016/j.jpowsour.2022.232541
About this article

The authors acknowledge support from Tashkent State Transport University and the Uzbekistan Ministry of Transport for facilitating EV-related simulation and analysis activities.
The datasets generated during and/or analyzed during the current study are available from the corresponding author on reasonable request.
The authors declare that they have no conflict of interest.
