Abstract
This paper presents preliminary results of vibration monitoring of a railway bridge located in the Sergeli district of Tashkent, Uzbekistan. The study focuses on evaluating the dynamic behavior of load-bearing components under operational conditions. A sensor-based approach was employed to record and analyze vibration responses rather than traditional monitoring techniques. Field data were obtained using high-sensitivity accelerometers installed on the bridge girders and supports. In addition, a position transducer was installed to monitor the gap opening between the two beams at the top of the bridge. To measure the rail's deformation under dynamic loading, a strain gauge was installed directly next to one of the accelerometers. All sensors were integrated with a data acquisition system to ensure correlation between data collected by various sensors. The collected data were analyzed in the time domain and in the frequency domain to identify dominant vibration modes, natural frequencies, and possible irregularities. The results indicate clear vibration patterns associated with train-induced and ambient excitations, reflecting the bridge’s structural performance and stiffness distribution. Only a small portion of the results is discussed in this paper. This monitoring approach and its findings provide a foundation for developing a long-term structural health monitoring system and enhancing the safety of railway bridges operating in seismic and high-load regions.
1. Introduction
Structural health monitoring infrastructure objects is crucial to ensuring longevity and proper functionality [1]. Since they are usually extended in space, laser scanning is one of the main approaches for structural health monitoring which is commonly used worldwide [2-9]. While the laser scanning can provide detailed and accurate information about its geometry (including geometric anomalies), it lacks information about the physical properties and structural performance of infrastructure objects. To obtain this information, ambient or forced vibration studies are usually performed [10, 11]. This paper is focused on ambient and forced vibration studies of the railroad bridge in Tashkent, Uzbekistan. The bridge was extensively instrumented with various sensors to measure its response to ambient excitations and the trains passing through it [14-15]. The sensors included accelerometers with regular and high sensitivity, position transducers, and strain gages. The sensors were strategically installed throughout the bridge, and they were connected to an 80-channel data acquisition system, PI6000 from Pacific Instruments, Inc. [12].
This bridge was recently completed and was designed to carry two parallel railroad tracks. At the time of the monitoring study, only one track had been constructed, as shown in Fig. 1(a). The monitoring team and data acquisition system are presented in Fig. 1(b).
Fig. 1Bridge’s photo and photo of the monitoring studies in progress: a) photo of the bridge, b) photo of monitoring studies in progress. The photos were taken by S. Takhirov on May 30, 2025
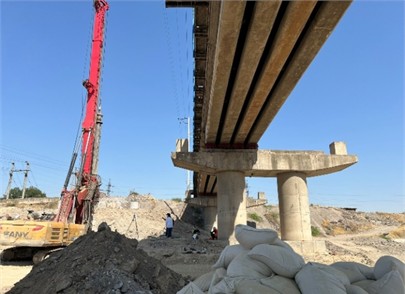
a)
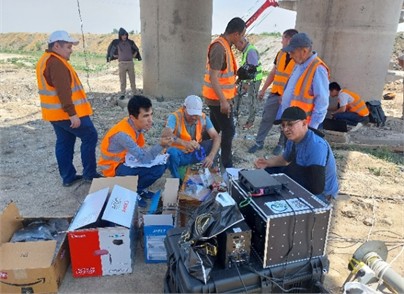
b)
2. Task setting and modeling methodology
Bridge Overview. A reinforced concrete railway bridge on the “Tashkent-Angren” line was investigated. The bridge is designed according to the following construction scheme: two sections of 16.5 m, seven sections of 26.0 m, and 16.5 m for embankments. The pavement type is on ballast. The bridge’s total length is 230 m. The bridge is located on a straight line and has a slope of 2.5. The bridge’s elevation view is shown in Fig. 2. The details of the bridge design are presented in Fig. 3(a) and Fig. 3(b).
This bridge over the Chirchik River on the Tashkent-Angren line was built in 1999-2000 as part of the Tashgiprotrans project, replacing the old reinforced concrete bridge below the river. The nearest stations are Sergeli and Angren. The bridge is built as a ten-span reinforced concrete structure, consisting of column and decking structures. The decking structures are prefabricated from reinforced concrete beams with top-mounted movement, designed for a design load of C14. These beams with relatively long spans at the embankments were manufactured in 1997 and 1998 and installed in 1999; the middle spans were manufactured in 1999 and installed in 2000.
Fig. 2Elevation of the bride
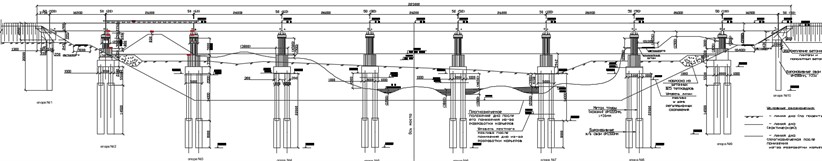
Fig. 3Design details of the bridge
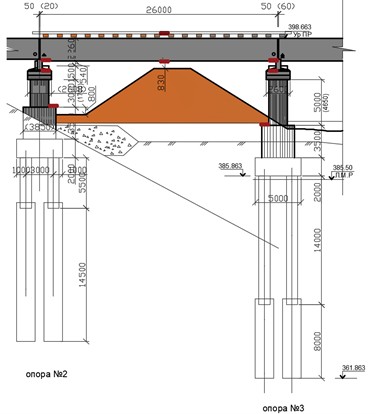
a) Support structure and decking
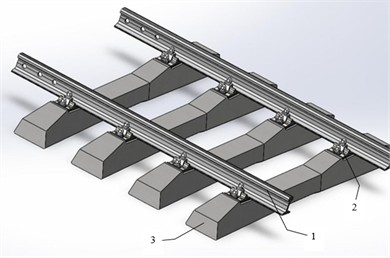
b) General view of a railway track fragment: 1 – rail P65; 2 – KB type fasteners; 3 – reinforced concrete sleeper
3. Results and their analysis
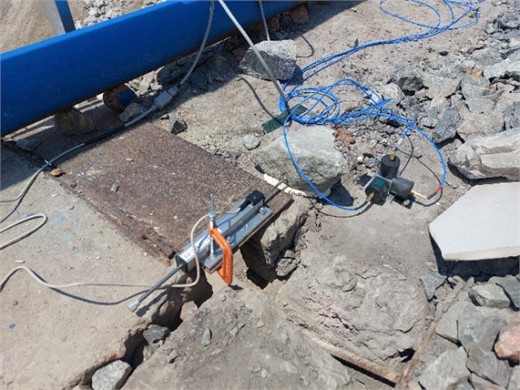
Gap Opening Between Decks: Top. As mentioned earlier, a gap between the beams comprising the deck of the bridge was monitored by a position transducer, as presented in Fig. 4. The collected data were analyzed in the MATLAB environment [13].
Fig. 4Photo of the position transducer installed between the decks on top of the bridge. The photo was taken by S. Takhirov on May 30, 2025
One of the monitoring results is discussed herein. A total of 15 data files were collected; this paper focuses on the results from the last file, which corresponds to the dynamic loading of the bridge by a freight train crossing at about 40 km/h.
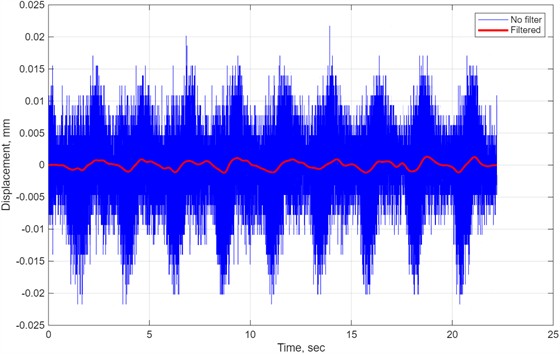
The displacement before arriving at the train at the gap location is shown in Fig. 5. The blue line corresponds to the unfiltered data, and the red line corresponds to the filtered data in which high-frequency noise was removed.
Fig. 5Displacement data in the time domain before train arrival
The analysis in the frequency domain reveals the fact that there are two dominant periods of beam vibration, as presented in Fig. 6. They are 1.17 seconds and 2.34 seconds.
Fig. 6Dominant periods of vibration before train arrival
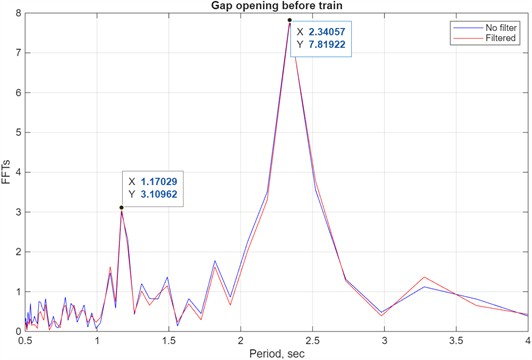
The average speed of the train was about 40 km/h, which corresponds to about 11.1 m/sec. The length of the rail sections was 12.5 m. The train traveling at 40 km/h would pass this distance in about 1.13 seconds. This number is closely correlated with the first period of vibration, T1=1.17 seconds. The span’s length is 26 m. The same train traveling at 40 km/h would cover this distance in about 2.34 seconds, which is the same as the second period, T2 = 2.34 seconds. From this discussion, it can be concluded that the train's speed can be estimated from the vibration characteristics of the gap displacement.
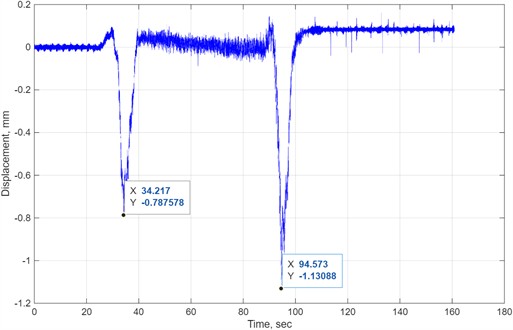
The free vibration of the gap will turn into forced vibration at the train’s arrival at the location of the instrument. The peak displacements occur when the train climbs onto the front beam and steps down from it, as shown in Fig. 7. As shown in the plot, these peak displacements occur when the train climbs on the front beam (34.217 sec) and steps down from the rear beam (94.573 sec). The difference between these moments is 60.356 seconds. This time difference multiplied by the train’s speed will result in about 670 m, which corresponds to the length of the train. Based on this information, the number of cars can be estimated.
Fig. 7The peak displacements
During the monitoring studies, the number of freight cars was counted, totaling 46. The locomotive model was documented, and its length was obtained from its specification. This information is summarized in Table 1. Based on these data, the length of the train was estimated as presented in the same table. The estimated number of about 668 m is very close to 670 m, which was obtained from monitoring the gap performance.
Table 1Strength characteristics of portland cements activated with thermally treated limestone
Length of locomotive, m | Length of each freight car, m | Number of cars | Estimated total length of the whole train, m |
32.84 | 13.8 | 46 | 668 |
4. Discussion of the results
The gap opening between two neighboring decks was studied in detail. It was shown that, based on the analysis of the displacement in both time and frequency domains, the following parameters can be estimated. First, based on the length of the rails, the train’s speed can be estimated. Second, based on the length of the beams, another measurement can be taken to confirm the train's speed. Third, the length of the train can be estimated from the displacement at the gap between the decks and the train's speed. Fourth, based on the length of the train number of cars can be computed. All this information will be used in the future structural assessment of the bridge performance under the service loads. In addition, the data obtained from accelerometers with regular and high-sensitivity will be analyzed. The strain gage data collected from a rail will be used to assess strains developed in the rail under a moving train.
5. Conclusions
This paper presents preliminary results of vibration monitoring of a railway bridge located in the Sergeli district of Tashkent, Uzbekistan. The study focuses on evaluating the dynamic behavior of load-bearing components under operational conditions. A sensor-based approach was employed to record and analyze vibration responses rather than traditional monitoring techniques. Field data were obtained using high-sensitivity accelerometers installed on the bridge girders and supports. In addition, a position transducer was installed to monitor the gap opening between the two beams at the top of the bridge. To measure the rail's deformation under dynamic loading, a strain gauge was installed directly next to one of the accelerometers. All sensors were integrated with a data acquisition system to ensure correlation between data collected by various sensors. The collected data were analyzed in the time domain and in the frequency domain to identify dominant vibration modes, natural frequencies, and possible irregularities. The results indicate clear vibration patterns associated with train-induced and ambient excitations, reflecting the bridge’s structural performance and stiffness distribution. Only a small portion of the results is discussed in this paper. This monitoring approach and its findings provide a foundation for developing a long-term structural health monitoring system and enhancing the safety of railway bridges operating in seismic and high-load regions. The gap opening between two neighboring decks was studied in detail. It was shown that, based on the analysis of the displacement in both time and frequency domains, the following parameters can be estimated. First, based on the length of the rails, the train's speed can be estimated. Second, based on the length of the beams, another measurement can be taken to confirm the train’s speed. Third, the length of the train can be estimated from the displacement at the gap between the decks and the train’s speed. Fourth, based on the length of the train number of cars can be computed. All this information will be used in the future structural assessment of the bridge performance under the service loads. In addition, the data obtained from accelerometers with regular and high-sensitivity will be analyzed. The strain gage data collected from a rail will be used to assess strains developed in the rail under a moving train.
References
-
U. Z. Shermukhamedov, Z. Z. Ergashev, S. M. Takhirov, and A. A. Abdullaev, “Improving reliability of uzbekistan’s transport infrastructure facilities under impact of natural hazards by analysis of its vulnerability, monitoring and modeling,” in 9th International Conference on Computational Methods in Structural Dynamics and Earthquake Engineering Methods in Structural Dynamics and Earthquake Engineering, Jan. 2023, https://doi.org/10.7712/120123.10682.21320
-
M. Rashidi, M. Mohammadi, S. Sadeghlou Kivi, M. M. Abdolvand, L. Truong-Hong, and B. Samali, “A decade of modern bridge monitoring using terrestrial laser scanning: review and future directions,” Remote Sensing, Vol. 12, No. 22, p. 3796, Nov. 2020, https://doi.org/10.3390/rs12223796
-
T. Rashidov, K. Baybulatov, D. Bekmirzayev, S. Takhirov, J. Gayibov, and N. Nishonov, “Comprehensive program on structural assessment of bridges in Uzbekistan,” in 17th World Conference on Earthquake Engineering (WCEE), 2020.
-
H. Baybulatov, J. Gayibov, and M. Berdibaev, “Results of diagnostics of bridge structures, subject to repair and reconstruction works on roads of the Fergana region,” Problems of Mechanics, Vol. 1, pp. 71–74, 2019.
-
S. M. Takhirov and R. E. Kayen, “Point clouds of bridge generated by terrestrial laser scanner and images via structure from motion technique: comparison study,” in 3rd International Congress on Human-Computer Interaction, Optimization and Robotic Applications (HORA), Jun. 2021, https://doi.org/10.1109/hora52670.2021.9461365
-
M. Yashinsky, S. Takhirov, K. Mosalam, T. Hutchinson, and F. Kuester, “From a distance: Inspection of bridges in the aftermath of the South Napa earthquake,” Bridge Design and Engineering Magazine, No. 77, pp. 52–54, 2014.
-
K. M. Mosalam, S. M. Takhirov, and S. Park, “Applications of laser scanning to structures in laboratory tests and field surveys,” Structural Control and Health Monitoring, Vol. 21, No. 1, pp. 115–134, Mar. 2013, https://doi.org/10.1002/stc.1565
-
P. Tysiac, M. Miskiewicz, and D. Bruski, “Bridge non-destructive measurements using a laser scanning during acceptance testing: case study,” Materials, Vol. 15, No. 23, p. 8533, Nov. 2022, https://doi.org/10.3390/ma15238533
-
S. M. Takhirov, “Control of construction quality by a terrestrial laser scanner: example of steel frame building,” 3rd International Congress on Human-Computer Interaction, Optimization and Robotic Applications (HORA), Jun. 2021, https://doi.org/10.1109/hora52670.2021.9461332
-
S. Takhirov, B. Rakhmonov, R. Nafasov, A. Samandarov, and S. Sultanova, “Laser scanning and ambient vibration study of Juma Mosque in Khiva (Uzbekistan) with subsequent finite element modeling of its minaret,” Remote Sensing, Vol. 15, No. 6, p. 1632, Mar. 2023, https://doi.org/10.3390/rs15061632
-
S. Takhirov, B. Rakhmonov, R. Nafasov, A. Samandarov, S. Sultanova, and J. Musurmanov, “Structural health monitoring of Juma Mosque in Itchan Kala, Uzbekistan by laser scanning,” in International Conference on Structural Health Monitoring of Intelligent Infrastructure (SHMII), 2021.
-
“Bundled acquisition systems,” Pacific Instruments, Oct. 2025.
-
“MATLAB, Version R2024a,” MathWorks Inc., Natick, MA, USA, 2024.
-
I. Mirzaev, U. Shermukhamedov, A. Abdullaev, and D. Askarova, “Influence of seasonal temperature on the strength of continuous monolithic road overpasses,” in International Conference on Thermal Engineering, Jun. 2024, https://doi.org/10.1051/e3sconf/2023365
-
I. Mirzaev, D. Askarova, M. Turdiev, and J. Shomurodov, “Shear oscillations of bridge on sliding foundation during earthquake,” in E3S Web of Conferences, Vol. 401, p. 01074, Jul. 2023, https://doi.org/10.1051/e3sconf/202340101074
About this article

The authors have not disclosed any funding.
The datasets generated during and/or analyzed during the current study are available from the corresponding author on reasonable request.
Shakhzod Takhirov: develop a monitoring strategy; identify the number and types of monitoring sensors and the data-acquisition system; conduct discussions and consultations with the rest of the team; implement on-site monitoring; take a lead on in-situ measurements, data analysis, and paper preparation.
Ibrahim Mirzaev: secure funding for the bridge monitoring, participate in discussions and consultations on the bridge’s monitoring strategy, and provide feedback specific to his expertise; supervise the on-site monitoring and fieldwork; evaluate the obtained results, and assist with paper preparation.
Ulugbek Shermukhamedov: oversee the project; ensure that all logistical and permission-related issues are resolved; participate in discussions and consultations on the bridge’s monitoring strategy and provide feedback specific to his expertise; perform the on-site monitoring and fieldwork; evaluate the obtained results and assist with paper preparation.
Zukhritdin Ergashev: provide information about the length of the rails and beams, participate in discussions and consultations on the bridge’s monitoring strategy, and provide feedback specific to his expertise; perform the on-site monitoring and fieldwork; evaluate the obtained results, and assist with paper preparation.
Abdurakhim Abdullaev: obtain all technical documentation of the bridge; participate in discussions and consultations on the bridge’s monitoring strategy, and provide feedback specific to his expertise; make sure that all technical information of the sensor locations is documented; secure all information about trains’ speeds and passing times; perform the on-site monitoring and fieldwork; evaluate the obtained results and assist with paper preparation.
Prof. Ibrakhim Mirzaev is a scientific committee member of the 76th International Conference on Vibroengineering and was not involved in the editorial review and/or the decision to publish this article.
