Abstract
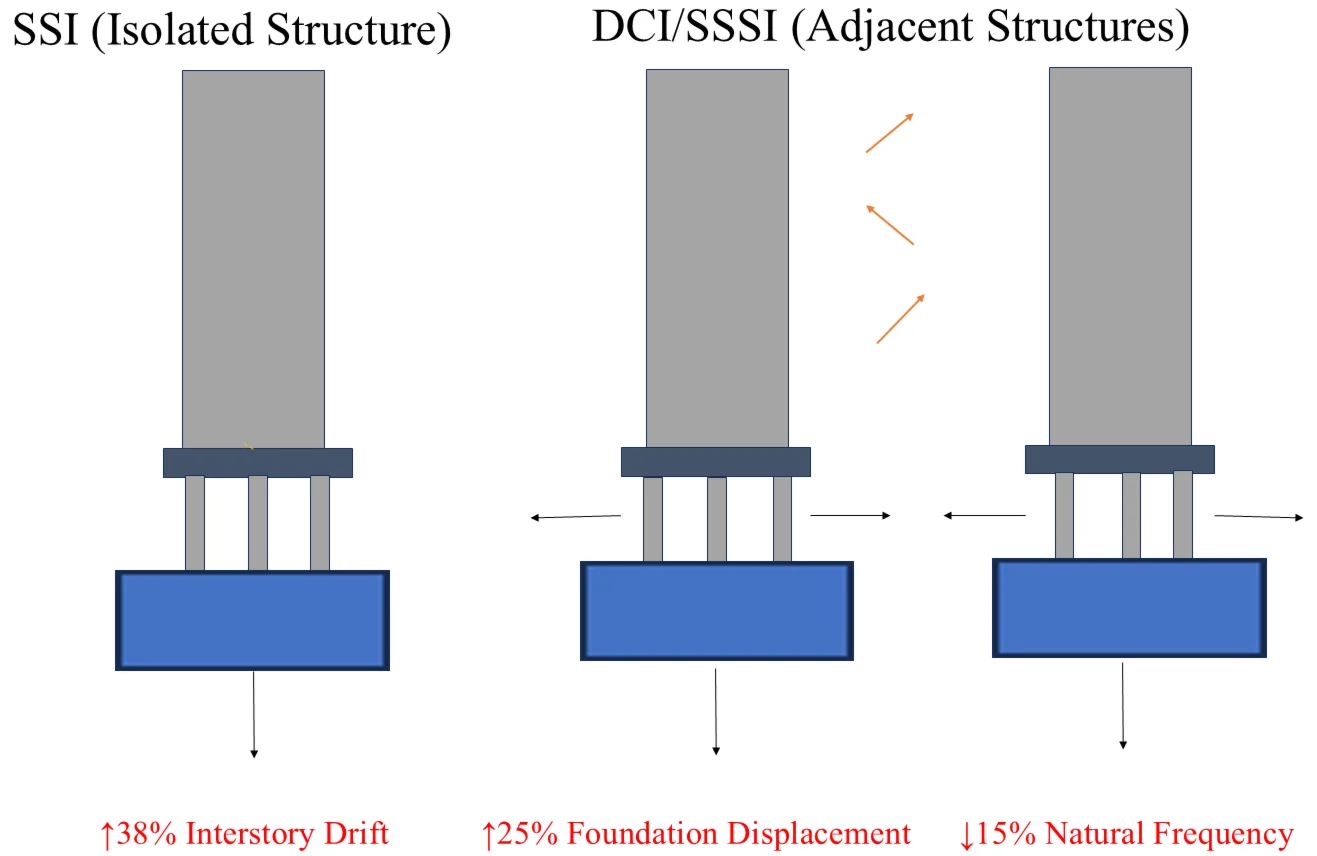
The dynamic interaction of adjacent high-rise structures on deep soft soils was systematically investigated using advanced three-dimensional finite element modeling. Parametric analyses considered varying building spacings (10-40 m), foundation types, and soil stiffness values. Compared with isolated soil-structure interaction (SSI), the structure-soil-structure interaction (SSSI/DCI) scenario increased peak interstory drift ratios by up to 38 % and amplified maximum foundation displacement by 25 % for the closest building pairs. Dynamic coupling also resulted in a reduction of fundamental natural frequencies by as much as 15 %. The influence of soil flexibility was found to be critical; structures on softer soils experienced stronger interaction and greater seismic response amplification. The findings provide quantitative evidence and practical guidance for the seismic design of high-rise clusters in urban environments with deep soft ground.
Highlights
- Structure-soil-structure interaction (SSSI/DCI) increases peak interstory drift ratios by up to 38% and foundation displacement by 25% for adjacent high-rise buildings on deep soft sites.
- The fundamental natural frequencies of adjacent high-rise buildings are reduced by as much as 15% under DCI conditions compared to isolated SSI systems.
- Soil flexibility substantially amplifies DCI effects, with softer soils (lower shear wave velocity) producing stronger seismic coupling and greater response amplification between adjacent towers.
1. Introduction
With the continuous development of society and the economy, urban construction land has become increasingly scarce. This trend has not only fostered the proliferation of high-rise and super-high-rise buildings but has also resulted in progressively smaller separations between them. As a result, in many economically developed areas, especially along the coastal regions of China, a large number of closely spaced high-rise buildings have been constructed. Adjacent buildings (including their respective superstructures and foundations) are interconnected through the surrounding foundation soil, forming a complete open structural system. Under seismic actions, not only is there interaction between individual buildings and the foundation soil, but there is also interaction between several adjacent buildings through the foundation soil. Soil-structure interaction (SSI) is a significant research topic in earthquake engineering that has attracted extensive attention and research both domestically and internationally for several decades. Dynamic cross interaction (DCI), a more recent research topic, focuses on the dynamic response of adjacent buildings under seismic excitation, indicating that the seismic response of one building is influenced not only by the foundation soil but also by the effects exerted by neighboring buildings through the foundation soil. The interaction problem of adjacent structures is a branch of research in soil-structure interaction (SSI), and its progress has lagged behind that of SSI. Various research methods and findings related to SSI have been confirmed to be relatively mature before being applied to the study of the dynamic interaction of adjacent structures (DCI).
Initially, the elastic half-space theory was primarily applied to obtain analytical solutions based on various simplified models of the superstructure, foundation, and foundation soil. In 1971, Warburtonet et al. [1] were the first to use the soil-structure interaction calculation model proposed by Parmelee, idealizing the foundation as an elastic half-infinite space and the two identical adjacent superstructures as cylindrical mass blocks with rigid circular foundation slabs. These two rigid foundations rested on the surface of the foundation soil and were separated by a certain distance. They studied the vibration problem of adjacent structures under horizontal harmonic excitation and vertical harmonic excitation on one of the mass blocks, obtaining the system's amplitude and resonance frequency. They discussed the interaction effects under different Poisson's ratios of the half-infinite medium and varying distances between the two mass blocks, clarifying that the dynamic interaction effect of adjacent structures is significant and marking the beginning of research in this field. Kobori et al. [2] were the first to attempt to study the dynamic interaction problem of adjacent structures in the frequency domain, dividing the dynamic interaction model into several soil-structure interaction models. The superstructure was simplified to a concentrated mass, and the foundation soil was idealized as a viscoelastic half-infinite layered medium located on rigid bedrock. They considered two loading conditions: the foundation of one structure experiencing force excitation and the entire system subjected to uniform displacement excitation at the bedrock. The dynamic characteristics of the system are discussed by using the transfer function. Luco and Contesse [3], Wong and Trifunac [4], and Murakami and Luco [5]used a simplified two-dimensional plane strain model to simulate an infinitely long three-dimensional system, where numerous identical infinitely long rigid shear walls were placed in parallel on equally spaced half-cylindrical rigid foundations. The steady-state response of the system with oblique incident SH wave was compared with that of a single structure. It was concluded that the dynamic interaction of adjacent structures had an important impact on the dynamic response of the system at low frequencies.
Subsequently, various more accurate and practical research methods were introduced in this field. Wong and Luco [6] were the first to simultaneously consider both in-plane and out-of-plane effects, conducting preliminary studies on three-dimensional dynamic interaction (DCI) systems. Additionally, Hryniewicz [7]conducted similar research work. Qian and Beskos [8-9] utilized the boundary element method based on the elastic half-space frequency domain Green's function to investigate the harmonic and transient dynamic responses of two three-dimensional adjacent rigid foundation interaction systems. Betti [10], Karabalis [11] and Huang [12] analyzed and solved various three-dimensional dynamic interaction problems of adjacent structures using the boundary element method in the time domain. Mulliken and Karabalis [13] conducted in-depth research on the dynamic interaction problems of adjacent structures using the discrete element method, analyzing the interaction between adjacent rigid foundations resting on a uniform and isotropic elastic half-space. Lin and Roesset [14] employed a coupled method combining finite element and boundary element methods to analyze the dynamic interaction problem between adjacent foundations, considering the effects of factors such as foundation spacing, the arrangement direction of adjacent foundations, and whether the foundations were above ground or buried, without involving the superstructure. On this basis, Wang and Schmid [15] carried out the finite element frequency domain boundary element coupling analysis of the three-dimensional DCI model for the first time. The superstructure was simulated using concentrated mass and distributed mass models, while the structure (including the superstructure and foundations) was analyzed using the finite element method, and the half-infinite foundation was treated with the boundary element method.
Since the 1990s, the development of numerical computation theories and computer technologies has significantly promoted the further advancement of DCI (Dynamic Cross Interaction) research, making three-dimensional elastic model analysis a mainstream research direction. From 1994 to 2002, the Nuclear Power Engineering Corporation (NUPEC) of Japan, in collaboration with relevant institutions in the United States, implemented a large-scale research project titled “Model Test on Dynamic Cross Interaction Effect of Adjacent Structures” to explore the principles of dynamic interaction between adjacent structures. This project conducted a series of field tests and numerical simulations regarding the dynamic performance of nuclear power plants (NPPs), examining the influences of various parameters such as the spacing between adjacent structures, whether the foundations were exposed or buried, and the depth of the foundations. Kitada et al. [16] provided an overview of a series of full-scale field tests and laboratory model tests conducted during this project. The full-scale field tests considered three types of interaction systems: one reactor structure, two adjacent identical reactor structures, and two adjacent structures consisting of different reactors and turbines. In the laboratory model tests, silicone rubber was used to simulate the foundation soil, while aluminum was used for the upper structure models. Preliminary analyses were conducted on the test data obtained under exposed foundation conditions, leading to different frequency response curves and Fourier spectra under various working conditions. Nakagawa et al. [17] conducted excitation tests on two adjacent reactor and turbine structures with embedded foundations indoors, obtaining their respective response spectrum curves and comparing them with previous studies. Yahyai and Mirtaheri [18] investigated the dynamic interaction between two adjacent 32-story buildings situated on three types of foundations: soft clay, gravelly sand, and dense sandy gravel. They examined the variations in the overall system's natural vibration periods, base shear, and floor displacements as a function of the spacing between the two buildings. Padrón and Aznárez et al. [19] utilized a three-dimensional frequency domain finite element-boundary element coupling method to address the dynamic interaction issues between two adjacent shear-type structures with pile foundations, focusing on the lateral, vertical, and torsional displacements of the structures as well as the shear force changes at the top of the piles.
Roy et al. [20] studied the structural-soil-structure dynamic interaction effects between closely spaced structures in nuclear facilities and their impact on seismic response. Through finite element analysis, they explored the DCI effects of heavy structures on adjacent lightweight structures, analyzing the influence of different foundation conditions (deep soil, shallow soil, and soft-hard layered soil), burial depth, and spacing between structures on dynamic responses. Wang et al. [21] investigated the effects of structural dimensions, spacing, and different seismic records on DCI effects using shaking table tests and three-dimensional finite element analysis. Subsequently, based on a highly-ductile nonlinear finite element model, they studied the DCI effects on medium clay sites under east-west seismic loading [22]. Chen et al. [23] analyzed the dynamic responses of four nuclear power plant-soil systems under horizontal and vertical seismic actions using finite element methods, while considering the influence of homogeneous layered soil and soil with weak interlayers. Han et al. [24] employed the indirect boundary element method to study the seismic responses of two embedded rigid foundation frame structures under plane SH wave excitation, and conducted a parametric analysis of the relative effects of frame stiffness, seismic excitation incident angles, frame spans, and frame mass on the out-of-plane displacements of the foundation and frame. Liu et al. [25] proposed a new nonlinear DCI seismic analysis time-domain coupling model and its computational method, establishing a system model that includes ten nuclear power plants. They analyzed the seismic responses of nuclear power plants on hard rock and hard soil sites, and thoroughly investigated the impact of DCI effects on the dynamic responses of conventional and three-dimensional base-isolated nuclear power plants. Wu et al. [26] introduced a comprehensive numerical analysis method for the first time, studying the effects of adjacent above-ground and underground structures on target buildings by altering the distance, configuration, and dimensions of the adjacent structures.
This study conducted a three-dimensional overall finite element dynamic analysis using ANSYS on a DCI system consisting of two adjacent frame structures and an SSI system containing only one frame structure situated on typical deep soft soil sites. The dynamic constitutive model for the soil was modeled using an equivalent linear model, and a three-dimensional viscoelastic artificial boundary was employed as the lateral truncation boundary for the soil. The dynamic characteristics, acceleration, and displacement responses of the two systems were analyzed and compared.
2. Modeling method
2.1. Soil dynamic constitutive model
In this paper, the soil skeleton curve of the Davidenkov model is used as the dynamic constitutive model for the soil [27], which describes the relationship between soil shear stress and shear strain. The specific relationship between and is expressed as follows:
where:
where is the maximum dynamic shear modulus of the soil; and are fitting parameters related to soil properties; is the reference shear strain; is the density of the soil; is the shear wave velocity of the soil; and  is the average effective confining pressure of the soil.
According to the relevant test results, the hysteretic curve of the soil can be expressed by the following empirical formula:
where is the maximum damping ratio; is the shape factor of the hysteresis curve , which typically ranges from 0.2 to 1.2 for most soils, with a value of 1.0 for Shanghai soft clay. The parameters ,  , and in the soil skeleton curve relationship of the Davidenkov model for Shanghai soil, as well as the parameter in the hysteresis curve relationship, can be selected with reference to Table 1.
Table 1The Davidenkov model parameter of Shanghai soft soil
Soil type | (10-3) | |||
Clayey soil | 1.62 | 0.42 | 0.30 | 0.6 |
Silty soil | 1.12 | 0.44 | 0.25 | 0.8 |
Sand | 1.10 | 0.48 | 0.25 | 1.0 |
Medium coarse sand | 1.10 | 0.48 | 0.25 | 1.2 |
2.2. Damping
In the problem of soil-structure dynamic interaction, different damping inputs should be applied to the structure and the foundation. ANSYS provides a method for inputting material-related damping, allowing for the specification of corresponding damping for each material. The mass proportional damping (Alpha damping), which can easily lead to computational instability, can be ignored; instead, only the stiffness proportional damping (Beta damping) from Rayleigh damping is used. The constant coefficient of the material stiffness matrix is:
where is the damping ratio; is the natural frequency of the whole system.
2.3. Three-dimensional viscoelastic artificial boundaries
Deeks [28] initially established two-dimensional viscoelastic artificial boundary conditions based on the assumption that the scattered wave is a two-dimensional cylindrical wave. This approach has been widely used by many scholars for simulating transient wave problems in various infinite and semi-infinite media.
But the actual structure and soil are all three-dimensional, so it is of great significance to develop practical three-dimensional viscoelastic artificial boundary and its numerical simulation technology. Liu Jingbo [29-30] applied elastic full-space theory to derive the normal and tangential boundary equations for three-dimensional viscoelastic artificial boundaries, based on the assumption that the scattered wave is a three-dimensional spherical wave, and studied the numerical simulation techniques for this boundary in the time domain. Subsequently, relevant parameters in the boundary equations were adjusted and corrected [31].
In this study, the three-dimensional time-domain viscoelastic artificial boundary based on half-space theory, with adjusted parameters, was employed in the calculations. In ANSYS, since all boundary truncation interfaces of the medium have been discretized, it is necessary to apply a parallel spring-damper system in all three directions (one normal and two tangential) at the nodes on all boundary surfaces. The physical parameters of the components are:
where and is the tangential spring stiffness coefficient; is the normal spring stiffness coefficient; and is the damping coefficient of the tangential damper; is the damping coefficient of the normal damper; is the shear modulus of the medium; is the mass density of the medium; is the distance from the wave source to each artificial boundary node; is the shear wave velocity of the medium; is the longitudinal wave velocity of the medium; is the network area represented by each boundary node.
3. Seismic response analysis and comparison
The superstructure consists of a 12-story cast-in-place reinforced concrete frame structure, with a bidirectional single span and a column grid of 6 m by 6 m, and a story height of 3.6 m. The cast-in-place floor slab has a thickness of 200 mm, the frame column dimensions are 600 mm by 600 mm, and the beam dimensions are 300 mm by 600 mm. The foundation employs a pile-raft system with a group of 3 by 3 piles, the raft thickness is 1m, the pile cross-section is 500 mm by 500 mm, and the pile length is 39 m. The main reinforcement uses HRB400 grade steel bars, and the concrete strength grade is C30.
The soil layers are based on the distribution near Shimen Road in Shanghai [16], which from the ground surface downward includes: 1) Fill, 2) Gray silty clay, 3) Gray clay, 4) Gray clay, 5) Gray silty clay, 6) Gray-green clay, 7) Yellow-gray silty sand. The physical and mechanical parameters of the soil in a static state are shown in Table 2.
Table 2The physical and mechanical parameters of the soil
Serial number | Soil type | Depth of the layer bottom / m | Density / (t/m3) | Elastic modulus / (MPa) | Poisson’s ratio | Shear wave velocity / (m/s) |
1 | Fill | 3.5 | 1.89 | 1.4 | 0.45 | – |
2 | Gray silty clay | 8 | 1.74 | 2.79 | 0.45 | 140 |
3 | Gray clay | 17.6 | 1.70 | 1.98 | 0.45 | 140 |
4 | Gray clay | 26.5 | 1.77 | 3.71 | 0.45 | 160 |
5 | Gray silty clay | 35.2 | 1.81 | 4.77 | 0.45 | 180 |
6 | Gray-green clay | 41.3 | 1.99 | 6.91 | 0.45 | 210 |
7 | Yellow-gray silty sand | > 41.3 | 1.96 | 14.93 | 0.40 | > 210 |
3.1. Establishment of finite element models
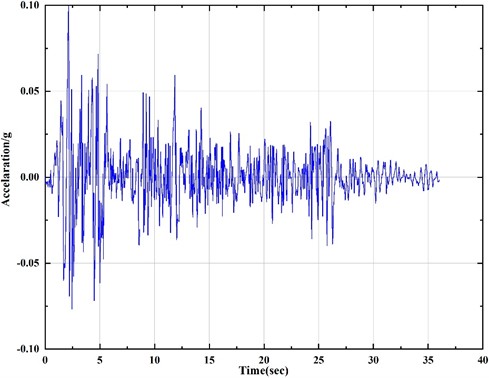
In this paper, two finite element models were established using ANSYS: one is the dynamic interaction system of adjacent structures (DCI system), which contains two identical above-mentioned frame structures, and the net spacing between the two structures is 3 = 18 m (where represents the transverse dimension of the frame structure, taken as 6m for the column spacing in this study), which is adjacent along the direction; The other is a conventional soil-structure interaction (SSI) system, containing only a single frame structure. The North-South component of the 1940 Imperial Valley earthquake recorded at the El Centro station, with a peak ground acceleration (PGA) of 0.348 g, was scaled to 0.1 g and used as the input motion for this analysis. The North-South recording of El Centro seismic wave with peak acceleration of 0.1 g is input along the direction (as shown in Fig. 1), lasting for 36 s. The adjacent arrangement direction of the two structures in the DCI system is defined as the transverse direction (-direction), while the direction in the horizontal plane that is perpendicular to this is defined as the longitudinal direction (-direction). According to literature [32], the lateral dimension of soil mass of the two systems can be taken as: for DCI system, the two lateral truncated edge interfaces are 5d away from the structural center, that is, the lateral dimension of soil mass of the whole DCI system is 14; for SSI system, the two lateral truncated edge interfaces are 5 away from the structural center, that is, the lateral dimension of soil mass of the whole SSI system is 10. Since seismic waves are input along the lateral direction, the longitudinal boundary dimension has little effect on the seismic response of the system, so the longitudinal dimension of soil mass is taken as 5 for both systems. The depth of soil mass is taken as 70 m.
Fig. 1The time history curve of El Centro seismic wave
The columns and beams of the superstructure are modeled using BEAM188 elements, while the floor slabs are represented by SHELL63 elements. The raft, piles, and soil are modeled using SOLID45 elements. Three-dimensional viscoelastic artificial boundaries are applied at the transverse boundaries, while free boundaries are used at the longitudinal boundaries, and fixed boundaries are implemented at the bottom of the soil. Due to symmetry, only half of the structure is considered for calculation along the direction of the seismic wave input. The established finite element models for the two systems are shown in Fig. 2 and 3.
3.2. Comparison of natural frequencies
Table 3 presents a comparison of the first 20 natural frequencies for the two systems. It can be observed that the natural frequencies of the DCI system are generally lower than those of the SSI system. In other words, considering the influence of adjacent structures tends to reduce the stiffness of the system. The relative difference between the two systems is small for the lower modes (less than 5 %), but it becomes significantly larger for the higher modes, indicating that the differences will likely be even greater for higher modes. It should be noted that under the action of near-field strong earthquakes, there is usually a strong high-frequency component in the seismic wave. At this time, the contribution of high-order mode shapes of the system to its seismic response will be very large, which will lead to the difference between the seismic response of DCI system and SSI system. On such deep, soft ground sites, the DCI system generally exhibits lower natural frequencies compared to the SSI system.
Fig. 2The calculation model of dynamic cross interaction (DCI) system
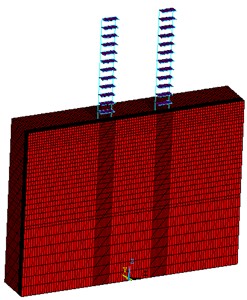
Fig. 3The calculation model of soil-structure dynamic interaction (SSI) system
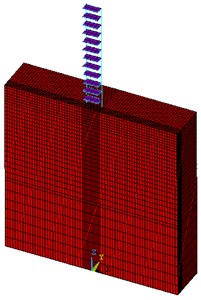
Table 3The natural frequency of vibration comparisons between DCI system and SSI system
Order | Ⅰ / Hz | Ⅱ / Hz | Ⅲ / % |
1 | 0.6256 | 0.6398 | –2.3 |
2 | 0.7510 | 0.7503 | 0.1 |
3 | 1.2297 | 1.3280 | –7.4 |
4 | 1.3351 | 1.3756 | –3.0 |
5 | 1.5248 | 1.5842 | –3.8 |
6 | 1.5485 | 1.6055 | –3.6 |
7 | 1.6466 | 1.7643 | –6.7 |
8 | 1.7784 | 1.8967 | –6.3 |
9 | 1.8274 | 1.9318 | –5.4 |
10 | 1.9133 | 2.0589 | –7.1 |
11 | 2.0555 | 2.1564 | –4.7 |
12 | 2.0934 | 2.2400 | –6.6 |
13 | 2.1571 | 2.3106 | –6.7 |
14 | 2.1727 | 2.3953 | –9.3 |
15 | 2.2648 | 2.4293 | –6.8 |
16 | 2.3346 | 2.5396 | –8.1 |
17 | 2.3765 | 2.6064 | –8.9 |
18 | 2.4546 | 2.6420 | –7.1 |
19 | 2.4867 | 2.7332 | –9.1 |
20 | 2.5080 | 2.7594 | –9.2 |
Note: I in the table is the natural frequency of each order of DCI system; Ⅱ is the natural frequency of each order of SSI system; Ⅲ is the relative difference between the natural frequencies of each order of the two systems, calculated as (Ⅰ – Ⅱ)/Ⅱ×100 % | |||
3.3. Comparison of acceleration responses
In the DCI system, the soil is divided into three regions along the adjacent direction of the two structures ( direction): the soil beneath the structural raft is designated as Region A; the soil between the lateral boundary and the nearby edge of the structure, which is outside the neighboring structures, is designated as Region B; and the soil between the two adjacent structures is designated as Region C. In the SSI system, since there is only one structure, there are only Regions A and B, with no Region C.
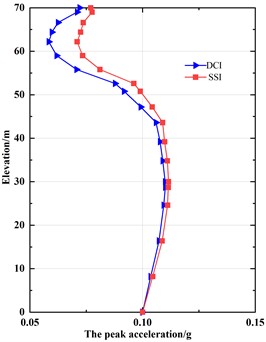
A total of 31 points were selected at the centers of the floors of the structure, at the top and bottom surfaces of the raft, and at various elevations in the A region soil. Fig. 4 shows the comparison of acceleration responses at these points for the two systems. As seen in Fig. 4(a), the peak acceleration values in the near-surface soil of the DCI system are lower than those in the SSI system, while in the deeper soil layers, the responses of the two systems are basically consistent. Table 4 provides a more detailed comparison of the acceleration responses of the superstructure, indicating that the peak acceleration values in the first to fourth floors are similar for both systems. However, for the upper floors (fifth to twelfth), the responses of the DCI system are greater than those of the SSI system, which is in contrast to the behavior observed in the near-surface soil, and the difference between the two systems tends to increase with the height of the floors. Fig. 4(b) compares the timings of the peak acceleration values at each point. The two systems differ in their peak acceleration occurrence times at the fourth, fifth, and top floors, particularly at the top floor. Considering that the peak value of the El Centro earthquake wave used in this study occurs at 2.14 seconds, the peak acceleration at the top floor of the SSI system occurs at this time (2.36 seconds), while in the DCI system, the peak acceleration does not occur until 6.3 seconds.
Table 4The peak acceleration of structure comparisons between DCI system and SSI system
Elevation / m | Ⅰ / g | Ⅱ / g | Ⅲ / % |
70 | 0.0970 | 0.0980 | –1.0 |
73.6 | 0.0910 | 0.0932 | –2.4 |
77.2 | 0.0798 | 0.0827 | –3.5 |
80.8 | 0.0729 | 0.0717 | 1.7 |
84.4 | 0.0669 | 0.0653 | 2.5 |
88 | 0.0675 | 0.0619 | 9.1 |
91.6 | 0.0819 | 0.0707 | 15.9 |
95.2 | 0.0986 | 0.0878 | 12.3 |
98.8 | 0.1178 | 0.1056 | 11.6 |
102.4 | 0.1358 | 0.1225 | 10.9 |
106 | 0.1520 | 0.1377 | 10.4 |
109.6 | 0.1659 | 0.1506 | 10.2 |
113.2 | 0.1775 | 0.1642 | 8.1 |
Note: I in the table is the peak acceleration response of the structure in the DCI system; Ⅱ is the peak value of structural acceleration response in SSI system; Ⅲ is the relative difference between the acceleration response peaks of the two systems, calculated as (Ⅰ – Ⅱ)/Ⅱ×100 % | |||
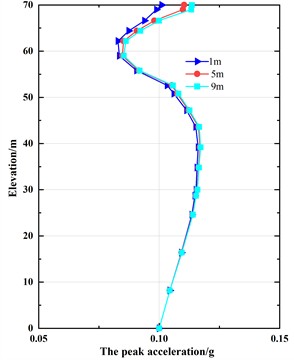
In the soil of zone B, 19 points were selected at depths along the soil profile at distances of 1m, 5m, and 9m from the edge of the structure. The acceleration time history responses were calculated, and the corresponding peak acceleration values are listed in Table 5. Fig. 5 further illustrates the comparison along the soil depth direction. From the analysis of Table 5 and Fig. 5, it can be observed that the peak acceleration values of the soil in the DCI system are lower than those in the SSI system across the entire depth range of the soil layer, with particularly significant differences observed in the near-surface soil (approximately 20 m from the surface), consistent with the observations in zone A. The reason may be attributed to the fact that under seismic loading, the DCI system experiences increased vibration energy due to the re-reflection of waves by adjacent structures. This leads to greater amplification of vibrations within the system compared to the SSI system. Consequently, the soil undergoes more pronounced nonlinear behavior, resulting in a reduction in the dynamic shear modulus and an increase in damping. As a result, the acceleration response in the DCI system is lower. Moreover, the near-surface soil layers are significantly softer than deeper layers, resulting in more pronounced differences between the two systems. In this study, the input seismic wave had a peak acceleration of 0.1 g. Under stronger seismic excitations with higher peak accelerations, not only would the softer near-surface soils exhibit marked nonlinear behavior, but the relatively deeper soils would also demonstrate certain nonlinear characteristics. Consequently, the relative difference in acceleration responses between the DCI and SSI systems would increase in the deeper soil layers near the Zones A and B, ultimately leading to more significant variations in superstructure responses.
Fig. 4The acceleration response of structure and soil in DCI system and SSI system
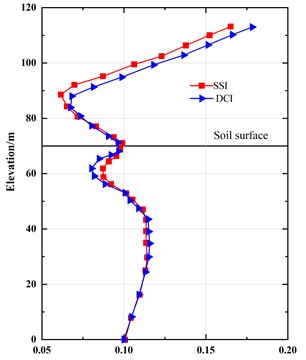
a) The peak acceleration/g
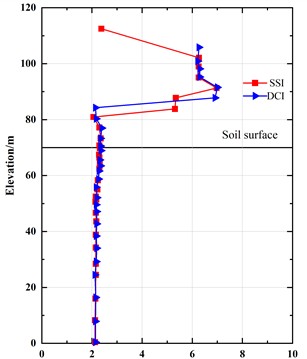
b) The peak acceleration time/s
Table 5The peak acceleration of zone B soil comparisons between DCI system and SSI system
Elevation /m | 1 m | 5 m | 9 m | ||||||
Ⅰ / g | Ⅱ / g | Ⅲ / % | Ⅰ / g | Ⅱ / g | Ⅲ / % | Ⅰ / g | Ⅱ / g | Ⅲ / % | |
0 | 0.1000 | 0.1000 | 0 | 0.1000 | 0.1000 | 0 | 0.1000 | 0.1000 | 0 |
8.2 | 0.1041 | 0.1048 | –0.7 | 0.1039 | 0.1047 | –0.8 | 0.1036 | 0.1045 | –0.9 |
16.4 | 0.1084 | 0.1094 | –0.9 | 0.1079 | 0.1091 | –1.1 | 0.1073 | 0.1087 | –1.3 |
24.6 | 0.1118 | 0.1124 | –0.6 | 0.1107 | 0.1119 | –1.1 | 0.1094 | 0.1111 | –1.6 |
28.7 | 0.1129 | 0.1132 | –0.3 | 0.1117 | 0.1125 | –0.8 | 0.1101 | 0.1114 | –1.2 |
30 | 0.1131 | 0.1135 | –0.4 | 0.1117 | 0.1127 | –0.9 | 0.1100 | 0.1115 | –1.4 |
34.8 | 0.1137 | 0.1134 | 0.3 | 0.1116 | 0.1125 | –0.8 | 0.1090 | 0.1110 | –1.8 |
39.2 | 0.1131 | 0.1135 | –0.4 | 0.1107 | 0.1121 | –1.3 | 0.1078 | 0.1098 | –1.9 |
43.6 | 0.1120 | 0.1126 | –0.6 | 0.1091 | 0.1113 | –2.0 | 0.1060 | 0.1089 | –2.7 |
47.2 | 0.1075 | 0.1100 | –2.3 | 0.1033 | 0.1076 | –4.0 | 0.0992 | 0.1043 | –4.9 |
50.8 | 0.1009 | 0.1049 | –3.8 | 0.0962 | 0.1023 | –6.0 | 0.0918 | 0.0990 | –7.3 |
52.6 | 0.0969 | 0.1014 | –4.4 | 0.0928 | 0.0998 | –7.0 | 0.0878 | 0.0961 | –8.7 |
55.8 | 0.0861 | 0.0918 | –6.2 | 0.0796 | 0.0874 | –9.0 | 0.0707 | 0.0811 | –12.9 |
59 | 0.0790 | 0.0870 | –9.2 | 0.0718 | 0.0821 | –12.6 | 0.0619 | 0.0734 | –15.7 |
62.2 | 0.0761 | 0.0862 | –11.7 | 0.0689 | 0.0808 | –14.8 | 0.0584 | 0.0710 | –17.8 |
64.4 | 0.0800 | 0.0892 | –10.3 | 0.0715 | 0.0834 | –14.3 | 0.0598 | 0.0725 | –17.6 |
66.6 | 0.0874 | 0.0931 | –6.1 | 0.0753 | 0.0856 | –12.1 | 0.0625 | 0.0737 | –15.2 |
69 | 0.0969 | 0.0982 | –1.3 | 0.0846 | 0.0906 | –6.7 | 0.0710 | 0.0776 | –8.5 |
70 | 0.0946 | 0.0962 | –1.7 | 0.0846 | 0.0891 | –5.1 | 0.0721 | 0.0770 | –6.4 |
Note: I in the table is the peak acceleration of each point in the DCI system; Ⅱ is the acceleration peak value of each point in SSI system; Ⅲ is the relative difference between the acceleration peaks at each point of the two systems, calculated as (Ⅰ – Ⅱ)/Ⅱ×100 % | |||||||||
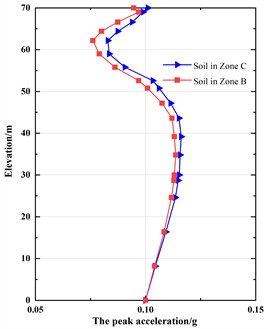
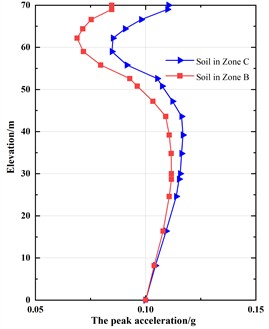
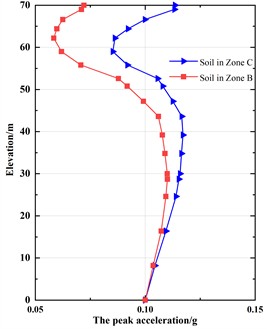
In the C zone of the DCI system, similar to the B region, 19 points were selected at depths along the soil profile at distances of 1 m, 5 m, and 9 m from the edge of the structure, and the peak acceleration responses were calculated. The peak acceleration for the soil on the opposite side of the same structure (B zone) are simultaneously listed in Table 6 for comparison.
Fig. 5The peak acceleration of soil in DCI system and SSI system (zone B soil)
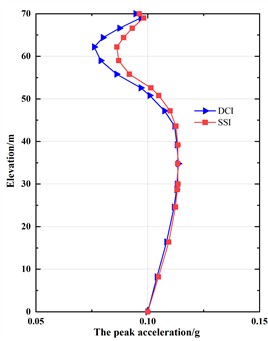
a) 1 m from the edge of the structure
b) 5 m from the edge of the structure
c) 9 m from the edge of the structure
Table 6The peak acceleration comparisons between zone B soil and zone C soil of DCI system
Elevation / m | 1 m | 5 m | 9 m | ||||||
Ⅰ / g | Ⅱ / g | Ⅲ / % | Ⅰ / g | Ⅱ / g | Ⅲ / % | Ⅰ / g | Ⅱ / g | Ⅲ / % | |
0 | 0.1000 | 0.1000 | 0 | 0.1000 | 0.1000 | 0 | 0.1000 | 0.1000 | 0 |
8.2 | 0.1044 | 0.1041 | 0.3 | 0.1044 | 0.1039 | 0.5 | 0.1044 | 0.1036 | 0.8 |
16.4 | 0.1092 | 0.1084 | 0.8 | 0.1093 | 0.1079 | 1.3 | 0.1094 | 0.1073 | 2.0 |
24.6 | 0.1136 | 0.1118 | 1.6 | 0.1139 | 0.1107 | 2.9 | 0.1140 | 0.1094 | 4.2 |
28.7 | 0.1148 | 0.1129 | 1.7 | 0.1152 | 0.1117 | 3.2 | 0.1153 | 0.1101 | 4.8 |
30 | 0.1153 | 0.1131 | 2.0 | 0.1157 | 0.1117 | 3.6 | 0.1159 | 0.1100 | 5.4 |
34.8 | 0.1157 | 0.1137 | 1.8 | 0.1163 | 0.1116 | 4.2 | 0.1165 | 0.1090 | 6.9 |
39.2 | 0.1162 | 0.1131 | 2.8 | 0.1169 | 0.1107 | 5.6 | 0.1172 | 0.1078 | 8.7 |
43.6 | 0.1152 | 0.1120 | 2.9 | 0.1163 | 0.1091 | 6.6 | 0.1166 | 0.1060 | 10.0 |
47.2 | 0.1114 | 0.1075 | 3.7 | 0.1122 | 0.1033 | 8.6 | 0.1126 | 0.0992 | 13.5 |
50.8 | 0.1061 | 0.1009 | 5.2 | 0.1075 | 0.0962 | 11.8 | 0.1080 | 0.0918 | 17.7 |
52.6 | 0.1033 | 0.0969 | 6.6 | 0.1053 | 0.0928 | 13.5 | 0.1057 | 0.0878 | 20.4 |
55.8 | 0.0906 | 0.0861 | 5.3 | 0.0915 | 0.0796 | 15.0 | 0.0919 | 0.0707 | 30.0 |
59 | 0.0835 | 0.0790 | 5.7 | 0.0847 | 0.0718 | 18.0 | 0.0853 | 0.0619 | 37.8 |
62.2 | 0.0829 | 0.0761 | 9.0 | 0.0852 | 0.0689 | 23.7 | 0.0862 | 0.0584 | 47.6 |
64.4 | 0.0874 | 0.0800 | 9.3 | 0.0907 | 0.0715 | 26.9 | 0.0922 | 0.0598 | 54.2 |
66.6 | 0.0939 | 0.0874 | 7.5 | 0.0980 | 0.0753 | 30.2 | 0.0999 | 0.0625 | 60.0 |
69 | 0.0989 | 0.0969 | 2.1 | 0.1099 | 0.0846 | 30.0 | 0.1133 | 0.0710 | 59.6 |
70 | 0.1011 | 0.0946 | 6.9 | 0.1104 | 0.0846 | 30.5 | 0.1136 | 0.0721 | 57.6 |
Note: I represents the peak acceleration values at various points in the soil of Zone C within the DCI system; II represents the peak acceleration values at various points in the soil of Zone B within the DCI system; III represents the relative difference in peak acceleration values between the soil points in Zone B and Zone C, calculated as (Ⅰ – Ⅱ)/Ⅱ×100 % | |||||||||
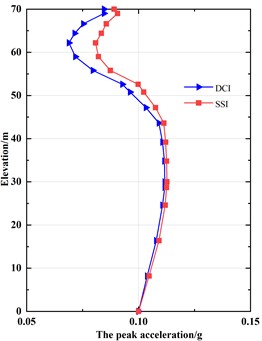
Fig. 6 further illustrates the comparison along the depth direction of the soil. Since the net distance between the two structures in the DCI system studied in this paper is 18 m, the points in the soil at a distance of 9 m from the edge of the structure in the C zone are actually located at the midpoint direction between the two structures, equidistant from both structures. From Table 6 and Fig. 6, it can be concluded that the acceleration response in the C zone of the DCI system is greater than that in the B zone, with the largest differences occurring at a distance of 9 m from the structure edge, particularly in the near-surface soil. Fig. 7 further indicates that within the soil of Zone C, the peak acceleration of the soil at the midpoint between the two adjacent structures (located 9 meters from the edge of the structures) is the highest. This can be interpreted as the multiple reflections of vibrations between the two adjacent structures significantly enhancing the vibration effect in the soil of Zone C, resulting in a stronger seismic response in this area. Moreover, the soil at the midpoint between the two structures experiences the maximum reflection enhancement effect due to its equal distance from both structures.
Fig. 6The peak acceleration of zone B soil and zone C soil in DCI system
a) 1 m from the edge of the structure
b) 5 m from the edge of the structure
c) 9 m from the edge of the structure
Fig. 7The peak acceleration of zone C soil in DCI system
3.4. Comparison of displacement responses
Tables 7 and 8 present a comparison of the peak displacement and inter-story displacement responses of each floor in the upper structure for two different systems, along with the relative differences between them. Figure 8 further illustrates the distribution of these responses along the elevation or floors. It can be observed that the displacement and inter-story displacements in the DCI system are significantly greater than those in the SSI system, with the increase being relatively uniform along the height. The displacement response increases by approximately 18 %, while the inter-story displacement increases by about 15 %. This is attributed to the DCI system having a lower frequency than the SSI system, leading to a reduction in overall stiffness for the DCI system, which in turn results in an increasing trend in displacement responses.
Table 7The peak floor displacement of structure comparisons between DCI system and SSI system
Elevation / m | Ⅰ / m | Ⅱ / m | Ⅲ / % |
70 | 0.0233 | 0.0180 | 29.5 |
73.6 | 0.0223 | 0.0193 | 15.6 |
77.2 | 0.0265 | 0.0229 | 15.7 |
80.8 | 0.0307 | 0.0265 | 15.9 |
84.4 | 0.0356 | 0.0299 | 19.1 |
88 | 0.0440 | 0.0369 | 19.3 |
91.6 | 0.0526 | 0.0446 | 18.0 |
95.2 | 0.0611 | 0.0520 | 17.5 |
98.8 | 0.0691 | 0.0590 | 17.1 |
102.4 | 0.0764 | 0.0654 | 16.8 |
106 | 0.0831 | 0.0712 | 16.7 |
109.6 | 0.0889 | 0.0761 | 16.8 |
113.2 | 0.0938 | 0.0804 | 16.7 |
Note: I represents the peak displacement response of the structure in the DCI system; II is the peak displacement response of the structure in the SSI system; III is the relative difference between the displacement response peaks of two system structures, calculated as (Ⅰ – Ⅱ)/Ⅱ×100 % | |||
Table 8The peak floor displacement of structure comparisons between DCI system and SSI system
Elevation / m | Ⅰ / mm | Ⅱ / mm | Ⅲ / % |
73.6 | 5.4884 | 4.5860 | 19.7 |
77.2 | 8.1182 | 6.9730 | 16.5 |
80.8 | 8.9386 | 7.7251 | 15.7 |
84.4 | 9.1836 | 7.9616 | 15.4 |
88 | 9.1729 | 7.9680 | 15.2 |
91.6 | 8.9802 | 7.8088 | 15.0 |
95.2 | 8.6250 | 7.5000 | 15.0 |
98.8 | 8.1158 | 7.0491 | 15.1 |
102.4 | 7.4632 | 6.4649 | 15.5 |
106 | 6.6852 | 5.7639 | 16.0 |
109.6 | 5.8204 | 4.9815 | 16.9 |
113.2 | 4.9797 | 4.2195 | 18.0 |
Note: I represents the peak interlayer displacement response of the structure in the DCI system; II represents the peak interlayer displacement response of the structure in the SSI system; III represents the relative difference in the peak interlayer displacement responses of the two structural systems, calculated as (Ⅰ – Ⅱ)/Ⅱ×100 % | |||
Fig. 8The peak displacement response of DCI system and SSI system
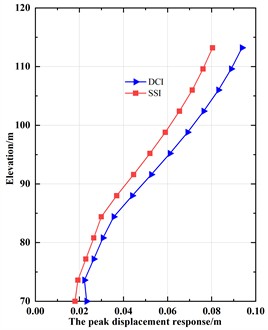
a) The peak displacement response
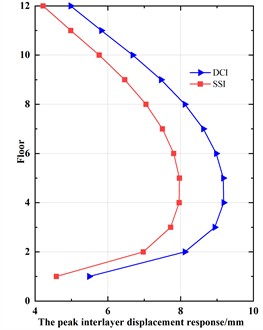
b) The peak interlayer displacement response
4. Conclusions
This study quantitatively clarifies the dynamic interaction effects between adjacent high-rise structures on deep soft soils and provides practical guidance for seismic design and safety evaluation in urban environments.
1) Structure-soil-structure interaction (DCI) increased peak interstory drift ratios by up to 38 % and maximum foundation displacement by 25 % compared to conventional SSI, with the effect most significant when building spacing was less than 20 m.
2) The fundamental natural frequencies of high-rise buildings were reduced by as much as 15 % under DCI conditions, and a linear regression model was established to predict the frequency shift as a function of building spacing and soil stiffness.
3) Parametric modeling revealed that soil flexibility substantially amplified DCI effects, resulting in greater response amplification and stronger seismic coupling between adjacent towers as the shear wave velocity of the soil decreased.
4) The adopted three-dimensional finite element modeling approach accurately captured the mechanisms and magnitude of DCI, supporting quantitative prediction of seismic response and informing the optimal arrangement and foundation design of high-rise building clusters on soft ground.
5) The soil dynamic constitutive model used in this paper is based on the Davidenkov model's soil skeleton curve, which is an equivalent linear model and does not adopt a more accurate nonlinear constitutive model for soil; The soil boundary used is a three-dimensional time-domain viscoelastic artificial boundary based on the half space theory, which has limitations in simulating infinite soil regions; The nonlinear contact and coupling effects between the upper structure foundation and the foundation soil have not been accurately considered; The simplification of the above model may result in some differences between the numerical calculation results and the actual response, and may not allow for a more detailed exploration of the various response patterns of DCI systems under seismic action.
6) The adverse SSSI effects revealed in this study underscore the potential of passive control systems for response mitigation. Future work will focus on a coupled soil-structure-control analysis and exploring: The application of sliding isolation systems to mitigate large foundation displacements and inter-story drifts by decoupling the structure. The deployment of tuned inerter dampers within the superstructure to control the amplified acceleration responses in upper floors, leveraging their high mass-amplification efficiency [33].
References
-
G. B. Warburton, J. D. Richardson, and J. J. Webster, “Forced vibrations of two masses on an elastic half space,” Journal of Applied Mechanics, Vol. 38, No. 1, pp. 148–156, Mar. 1971, https://doi.org/10.1115/1.3408735
-
T. Kobori, R. Minai, and K. Kusakabe, “Dynamic characteristics of soil-structure cross-interaction system,” Bulletin of the Disaster Prevention Research Institute, Kyoto University, Vol. 13, No. 3, pp. 111–151, 1973.
-
J. E. Luco and L. Contesse, “Dynamic structure-soil-structure interaction,” Bulletin of the Seismological Society of America, Vol. 63, No. 4, pp. 1289–1303, Aug. 1973, https://doi.org/10.1785/bssa0630041289
-
H. L. Wong and M. D. Trifunac, “Two-dimensional, antiplane, building-soil-building interaction for two or more buildings and for incident plane SH waves,” Bulletin of the Seismological Society of America, Vol. 65, No. 6, pp. 1863–1885, 1975.
-
H. Murakami and J. E. Luco, “Seismic response of a periodic array of structures,” Journal of the Engineering Mechanics Division, Vol. 103, No. 5, pp. 965–977, Oct. 1977, https://doi.org/10.1061/jmcea3.0002286
-
H. L. Wong and J. E. Luco, “Dynamic structure-to-structure interaction for closely spaced building,” in Proceedings of the Third U. S. National Conference on Earthquake Engineering, pp. 553–564, 1986.
-
Z. Hryniewicz, “Dynamic response of coupled foundations on layered random medium for out-of-plane motion,” International Journal of Rock Mechanics and Mining Sciences and Geomechanics Abstracts, Vol. 30, No. 5, p. 318, Oct. 1993, https://doi.org/10.1016/0148-9062(93)92623-x
-
J. Qian and D. E. Beskos, “Harmonic wave response of two 3D rigid surface foundations,” Soil Dynamics and Earthquake Engineering, Vol. 15, pp. 95–110, 1996.
-
J. Qian, L. G. Tham, and Y. K. Cheung, “Dynamic cross-interaction between flexible surface footings by combined BEM and FEM,” Earthquake Engineering and Structural Dynamics, Vol. 25, No. 5, pp. 509–526, May 1996, https://doi.org/10.1002/(sici)1096-9845(199605)25:5<509::aid-eqe567>3.0.co;2-z
-
R. Betti, “Effect of the dynamic cross-interaction in the seismic analysis of multiple embedded foundations,” Earthquake Engineering and Structural Dynamics, Vol. 26, No. 10, pp. 1005–1019, 1997.
-
D. L. Karabalis and M. Mohammadi, “3D dynamic foundation-soil-foundation interaction on layered soil,” Soil Dynamics and Earthquake Engineering, Vol. 17, pp. 139–152, 1998.
-
Huang and C. F. D., “Dynamic soil-foundation and foundation-soil-foundation interaction in 3-D,” University of South Carolina, Columbia, South Carolina, 1993.
-
J. S. Mulliken and D. L. Karabalis, “Discrete model for dynamic through-the-soil coupling of 3-D foundations and structures,” Earthquake Engineering and Structural Dynamics, Vol. 27, No. 7, pp. 687–710, Jul. 1998, https://doi.org/10.1002/(sici)1096-9845(199807)27:7<687::aid-eqe752>3.0.co;2-o
-
H. T. Lin, J. M. Roesset, and J. L. Tassoulas, “Dynamic interaction between adjacent foundations,” Earthquake Engineering and Structural Dynamics, Vol. 15, No. 3, pp. 323–343, Dec. 2006, https://doi.org/10.1002/eqe.4290150304
-
S. Wang and G. Schmid, “Dynamic structure-soil-structure interaction by FEM and BEM,” Computational Mechanics, Vol. 9, No. 5, pp. 347–357, Jan. 1992, https://doi.org/10.1007/bf00370014
-
Y. Kitada, T. Hirotani, and M. Michio, “Models test on dynamic structure-structure interaction of nuclear power plant buildings,” Nuclear Engineering and Design, Vol. 192, No. 2-3, pp. 205–216, 1999.
-
S. Nakagawa et al., “Forced vibration tests and simulation analyses of a nuclear reactor building,” Nuclear Engineering and Design, Vol. 179, No. 2, pp. 145–156, Feb. 1998, https://doi.org/10.1016/s0029-5493(97)00269-0
-
M. Yahyai, M. Mirtaheri, M. Mahoutian, A. S. Daryan, and M. A. Assareh, “Soil structure interaction between two adjacent buildings under earthquake load,” American Journal of Engineering and Applied Sciences, Vol. 1, No. 2, pp. 121–125, Feb. 2008, https://doi.org/10.3844/ajeassp.2008.121.125
-
L. A. Padrón, J. J. Aznárez, and O. Maeso, “Dynamic structure-soil-structure interaction between nearby piled buildings under seismic excitation by BEM-FEM model,” Soil Dynamics and Earthquake Engineering, Vol. 29, No. 6, pp. 1084–1096, Jun. 2009, https://doi.org/10.1016/j.soildyn.2009.01.001
-
C. Roy, S. Bolourchi, and D. Eggers, “Significance of structure-soil-structure interaction for closely spaced structures,” Nuclear Engineering and Design, Vol. 295, pp. 680–687, Dec. 2015, https://doi.org/10.1016/j.nucengdes.2015.07.067
-
J. Wang, T. Guo, and Z. Du, “Experimental and numerical study on the influence of dynamic structure-soil-structure interaction on the responses of two adjacent idealized structural systems,” Journal of Building Engineering, Vol. 52, p. 104454, Jul. 2022, https://doi.org/10.1016/j.jobe.2022.104454
-
J. Wang, T. Guo, S. Yu, and Z. Du, “Seismic structure-soil-structure interaction in typical RC frame structure groups on medium clay soil under code-specified earthquakes,” Journal of Building Engineering, Vol. 98, p. 111450, Dec. 2024, https://doi.org/10.1016/j.jobe.2024.111450
-
Q. Chen, M. Zhao, J. Zhang, and X. Du, “Numerically study of SSSI effect on nuclear power plant on layered soil,” Latin American Journal of Solids and Structures, Vol. 20, No. 2, Jan. 2023, https://doi.org/10.1590/1679-78257508
-
Q. Han, Y. Wang, Y. Lu, and Z. Ba, “Seismic response of moment resistance frame with rigid foundation embedded in a layered half-space: Incident SH waves,” Soil Dynamics and Earthquake Engineering, Vol. 195, p. 109444, Aug. 2025, https://doi.org/10.1016/j.soildyn.2025.109444
-
Y. Liu, J. Li, and G. Lin, “Nonlinear numerical study of structure-soil-structure interaction effects between conventional and three-dimensional base-isolated nuclear power plants,” Soil Dynamics and Earthquake Engineering, Vol. 187, p. 108985, Dec. 2024, https://doi.org/10.1016/j.soildyn.2024.108985
-
Y. Wu, Z. Gao, M. Zhao, and X. Du, “Influence of structure-soil-structure interaction on seismic response and seismic migration performance of building structures,” Journal of Building Engineering, Vol. 98, p. 111101, Dec. 2024, https://doi.org/10.1016/j.jobe.2024.111101
-
Y.-X. Cui, T.-S. Hou, S. Pamukcu, and Y.-X. Niu, “Dynamic deformation characteristics of lightweight soil based on Davidenkov model,” Environmental Geotechnics, Vol. 12, No. 3, pp. 226–238, Apr. 2025, https://doi.org/10.1680/jenge.23.00065
-
A. J. Deeks and M. F. Randolph, “Axisymmetric time-domain transmitting boundaries,” Journal of Engineering Mechanics, Vol. 120, No. 1, pp. 25–42, 1994.
-
J. B. Liu and Y. D. Lu, “A direct method for analysis of dynamic soil-structure interaction based on interface idea,” Developments in Geotechnical Engineering, Vol. 1250, No. 98, pp. 261–276, Jan. 1998, https://doi.org/10.1016/s0165-1250(98)80018-7
-
J. B. Liu and B. Li, “Three dimensional visco-elastic static-dynamic unified artificial boundaries,” (in Chinese), Science in China, Ser. E, Vol. 35, No. 9, pp. 966–980, 2005.
-
J. Liu, Y. Du, X. Du, Z. Wang, and J. Wu, “3D viscous-spring artificial boundary in time domain,” (in Chinese), Earthquake Engineering and Engineering Vibration, Vol. 5, No. 1, pp. 93–102, Jun. 2006, https://doi.org/10.1007/s11803-006-0585-2
-
P. Z. Li and X. L. Lv, “Numerical analysis of tall buildings considering dynamic soil-structure interaction,” (in Chinese), Earthquake Engineering and Engineering Vibration, Vol. 24, No. 3, pp. 130–138, 2004.
-
R. S. Jangid, “Seismic response of sliding structures to bidirectional earthquake excitation,” Earthquake Engineering and Structural Dynamics, Vol. 25, No. 11, pp. 1301–1306, Nov. 1996, https://doi.org/10.1002/(sici)1096-9845(199611)25:11<1301::aid-eqe618>3.3.co;2-v
About this article

This work was supported by the Fundamental Research Program of Shanxi Province (No. 202403021221119), and the National Natural Science Foundation of China (No. 51504220).
The datasets generated during and/or analyzed during the current study are available from the corresponding author on reasonable request.
Shuping Chen: methodology, numerical simulation, and preparation of the first draft of the manuscript. Jinwen Wu: assist in numerical simulation and conclusion analysis.
The authors declare that they have no conflict of interest.
