Abstract
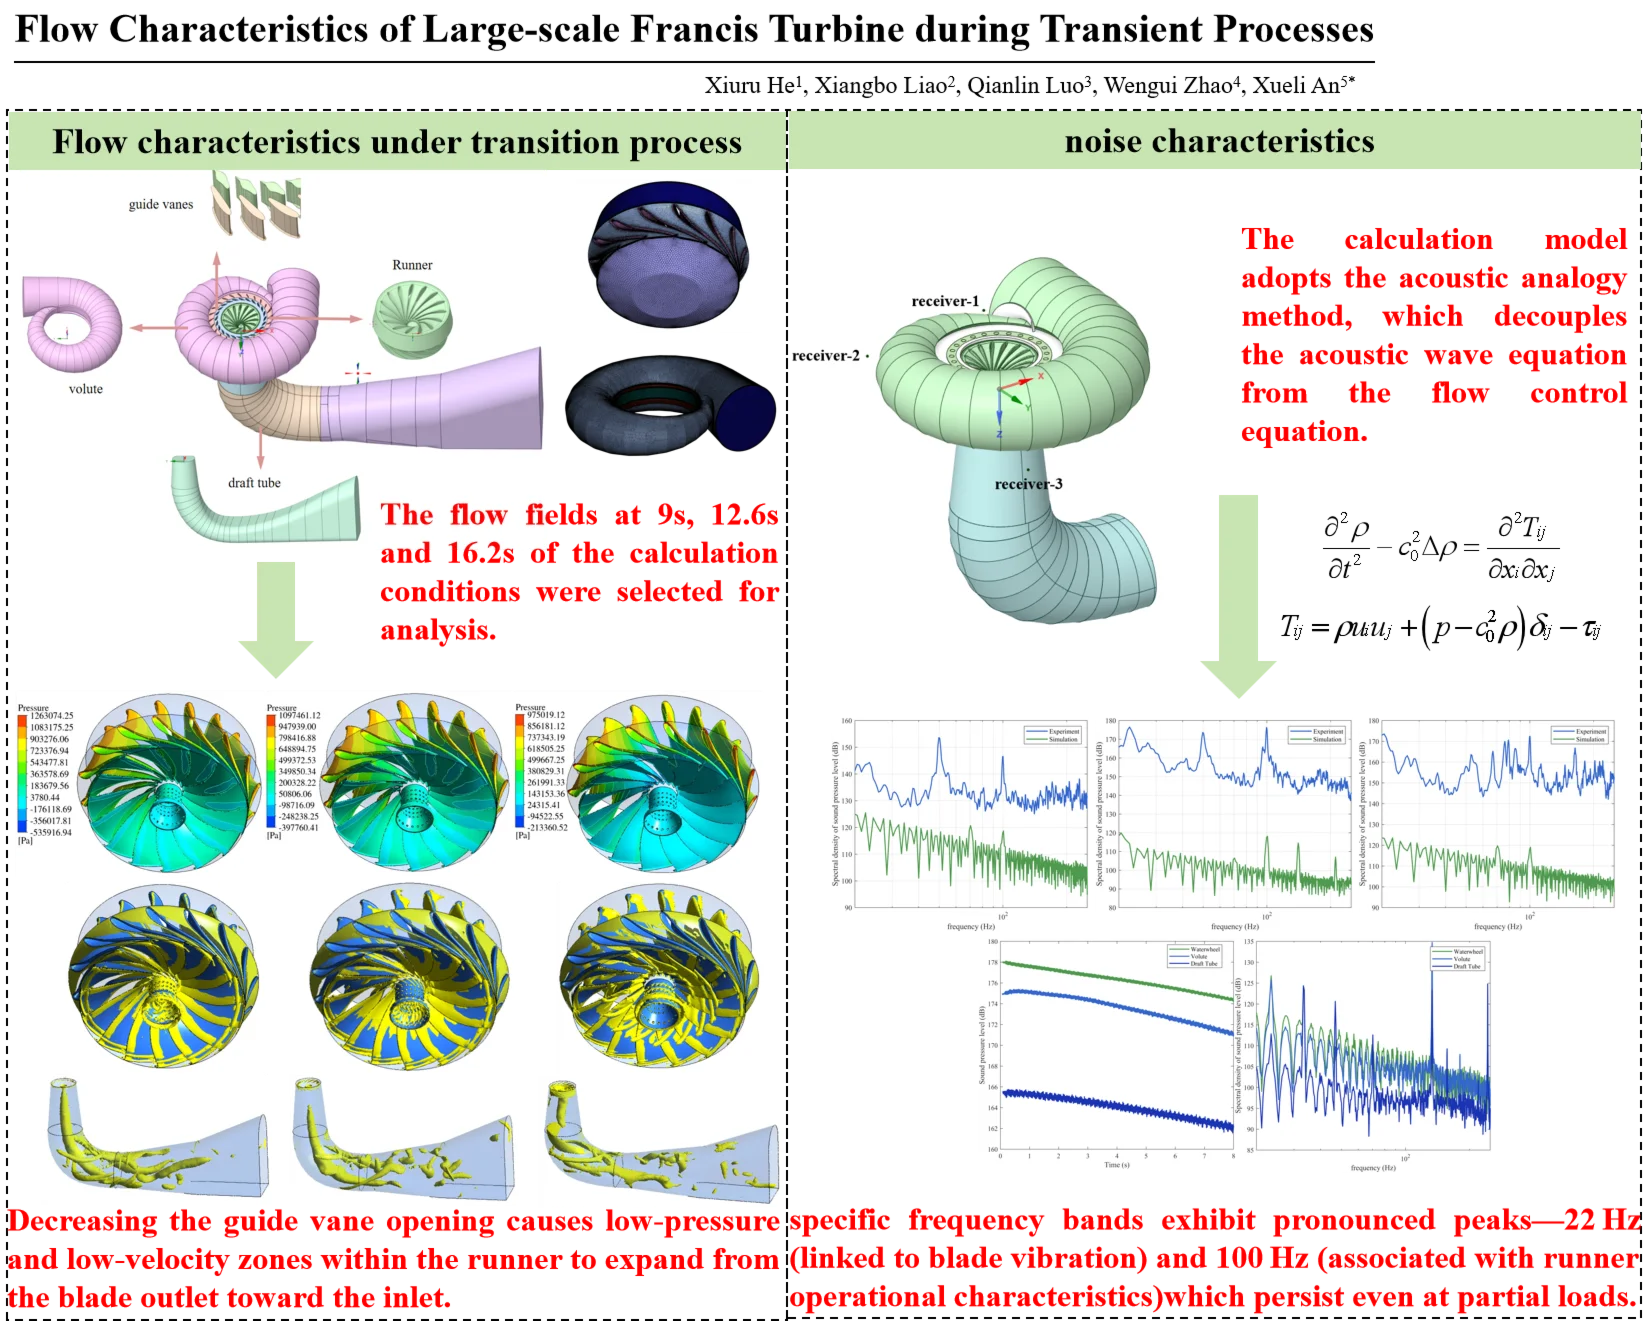
With the continuous establishment and improvement of the new power system, higher requirements have been imposed on the operation of large-scale hydroelectric generating units, which makes the flow inside the turbine more complex. This study employed the computational fluid dynamics (CFD) method based on the SST- turbulence model to numerically simulate the internal flow field of a large Francis turbine during the load reduction transition process, and coupled an acoustic model to analyze its flow-induced noise. The results show that under a constant head, as the guide vane opening decreases (load reduces), the low-pressure and low-speed zone inside the runner expands from the blade outlet to the inlet, while the blade passage vortex and draft tube vortex in the runner gradually develop, and the flow instability increases. The noise sound pressure level shows a decreasing trend with the reduction of load, but there are still significant peaks in specific frequency bands, among which 22 Hz and 100 Hz are respectively related to blade vibration and the operational characteristics of the runner. This study reveals the correlation characteristics between the internal flow and noise of the turbine during the transition process, providing a reference basis for the safe and stable operation of the unit, vibration and noise control, and the optimization of the transition process.
Highlights
- Under constant head, decreasing the guide vane opening causes low-pressure and low-velocity zones within the runner to expand from the blade outlet toward the inlet.
- Although the overall sound pressure level decreases as load reduces, specific frequency bands exhibit pronounced peaks—22 Hz (linked to blade vibration) and 100 Hz (associated with runner operational characteristics)—which persist even at partial loads.
- Prolonged operation below approximately 600 MW should be avoided because the intensified vortex structures and associated pressure pulsations increase the risk of resonance, noise, and potential damage to turbine components.
1. Introduction
With the widespread establishment of new power systems across the country, hydro turbine units are required to operate across an extended range of conditions, encompassing rated operation, partial load, overload, as well as no-load and transient operating states, which poses higher requirements for the safe operation of hydro turbines, especially for large-scale Francis turbines [1]. For instance, in large-scale water conservancy projects, multiple Francis turbines are also confronted with issues such as significant variations in operating conditions, relatively low water heads, and wide ranges of parameter changes. These factors complicate the operation of the units [2]. Studying their flow characteristics and dynamic behaviors under all operating conditions holds significant reference value for the efficient utilization of hydropower energy during actual operation [3]. In fact, when a hydraulic turbine operates under non-design conditions, it will lead to a series of complex fluid dynamics problems [4]. Research indicates that under partial load operation conditions, unsteady three-dimensional turbulent flow occurs inside Francis turbines, generating rotor-stator interaction and pressure pulsation propagation [5]. Therefore, in-depth analysis of the flow field changes of the flow components under multiple operating conditions is of great guiding significance for the stable operation of large-scale hydro turbines.
At present, scholars at home and abroad widely adopt computational mechanics methods to conduct relevant research on unstable flows during the operation of hydro turbines. CFD is the main tool for analyzing the flow state of Francis turbines. Commonly used turbulence models in research include SST- [6] and RANS [7] models. These models can predict the flow velocity, pressure, vortex structure, and cavitation regions inside the turbine. Li [8] accurately captured the formation, development and dissipation process of vortices inside the turbine by using CFD analysis. The calculation results show that under the rated head, the change of guide vane opening significantly affects the flow field and vortex morphology inside the Francis turbine. Wang [9] established the unsteady flow field distribution characteristics in the runner region of a large Francis turbine based on the SST- turbulence model of the RANS method and presented the pressure pulsation characteristics on the blade surface.
CFD simulation provides that pressure pulsation inside the turbine is a key factor causing hydraulic vibration and structural fatigue, especially under non-rated operating conditions. This information can reveal unstable flow phenomena that lead to efficiency reduction and structural damage. Rezavand [10] found that under partial load and deep partial load conditions, unstable vortices often form inside the turbine, such as vortices between blades and vortex bands in the draft tube. Li [11] employs computational mechanics methods and utilizes a high-precision numerical simulation model to conduct a comprehensive and in-depth study on the flow, pressure fluctuations and energy losses within a hydraulic turbine.
The analysis results of flow pattern, cavitation and pressure pulsation based on CFD can guide the optimal operation strategy of Francis turbine. Yan [12] calculation results show that the hydraulic turbine unit experiences obvious force oscillations and severe torque fluctuations during the transitional process, especially the pressure pulsation in the bladeless area is very significant. Therefore, operation under this condition should be avoided or reduced. Mao [13] provided the flow pattern distribution within the runner passage under off-design conditions through CFD calculations. The research results offer a theoretical basis for the selection of different runner materials.
Due to the combined effects of hydraulic, mechanical and electromagnetic forces, hydroelectric generating units often produce noise during operation. Such noise not only reflects the operational stability of the units but also significantly intensifies when components suffer from fatigue damage, leading to a decrease in power generation efficiency [14]. The fluid dynamic interaction between the turbine runner (rotor) and guide vanes (stator) is an important cause of discrete frequency noise. This interaction leads to periodic changes in the flow field, which in turn generates pressure fluctuations and induced noise [15]. By studying flow state changes, such as increasing or decreasing the geometric outlet angle of the guide vanes, changing the degree of guide vane inclination, and altering the distance between the rotor and stator, the flow state can be directly influenced, and the changes in discrete noise caused by rotor-stator interaction can be observed [16].
Internal noise analysis of volute, guide vanes and impeller can be conducted through Computational Fluid Dynamics (CFD) simulation combined with Computational Acoustics (CAA) methods, such as the unsteady - and FW-H equations [17]. Under design conditions or normal operation close to design conditions, Francis turbines typically exhibit relatively stable hydraulic characteristics and relatively low noise levels. However, during off-design operation, powerful vortex ropes are prone to occur in the draft tube of Francis turbines, which is the main cause of intense pressure pulsations, vibrations and noise [18]. Under extremely low load conditions, the flow field becomes highly unstable, easily generating intense noise and pressure fluctuations, which may lead to vibration and fatigue damage of the unit [14].
It can be seen from the literature that the flow characteristics of Francis turbines during transient processes directly affect the operation level of the units. In actual operation, their noise characteristics can also directly reflect their operating conditions. However, in current research, studies on the transient behavior of large-scale Francis turbines and their flow-induced noise characteristics are relatively scarce. Therefore, this paper adopts the Computational Fluid Dynamics (CFD) method, based on the SST- turbulence model, to numerically simulate the transient flow of a large-scale Francis turbine under various loads. Meanwhile, it combines an acoustic model to analyze the flow-induced noise characteristics. Through the coupling analysis of the flow field and the acoustic field, this study reveals the correlation characteristics of the internal flow and noise of large-scale turbines under variable operating conditions, providing an important basis for the safe and stable operation and vibration noise control of the units.
2. Research object and computational method
2.1. Model settings
This paper conducts numerical simulation calculations using Fluent. The calculation is based on the pressure-based method, with the SST- model adopted for the turbulence model and the SIMPLE pressure correction method used for the calculation approach. The governing equations describing fluid flow consist of the continuity equation, momentum equations (Navier-Stokes equations), and energy equation. Given that the internal flow within Francis turbines can be reasonably approximated as isothermal, only the continuity equation and momentum equation are required. The Eulerian formulations of these equations are expressed as Eq. (1-2):
In order to make the equations closed, it is necessary to introduce the turbulence Eq. (3-4):
2.2. Model of Francis turbine and meshing division
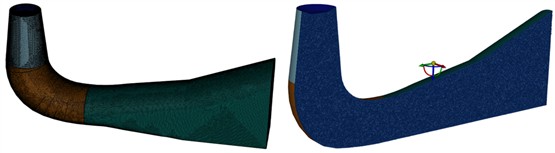
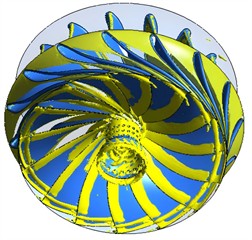
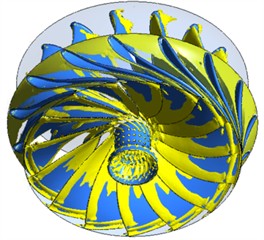
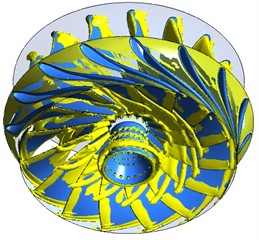
A three-dimensional model of the turbine was established with a certain power station in the southwest as the research object. Based on the volute profile and the dimensions of the upper and lower guide vanes, a three-dimensional geometric model of the volute was established. The three-dimensional geometric model of the draft tube was established based on the draft tube profile. Combined with the three-dimensional geometric models of the runner and the movable guide vanes obtained from on-site scanning, a complete geometric model was constructed in the 3D visualization modeling software UG and Spaceclaim, as shown in Fig. 1. The basic parameters of the turbine are shown in Table 1.
Table 1Francis turbine parameters
Parameter | Unit | Value |
Diameter of the rotating wheel | mm | 9397 |
Rated head | m | 137 |
Rated power | MW | 862.1 |
Rated flow rate | m3/s | 675.5 |
Rated speed | r/min | 90.91 |
Number of blades | / | 15 |
Number of guide vanes | / | 24 |
The Fluent adopted in this paper contains polyhedral meshes, which combine the advantages of tetrahedral and hexahedral meshes. By dividing the internal flow fields of each component with polyhedral grids, 10 layers of boundary layer grids are set on the wall surface, with the height of the first layer being 0.2 mm and the grid growth rate being 1.1.
Fig. 1Three dimensional mesh model of all parts of the whole flow channel of the turbine
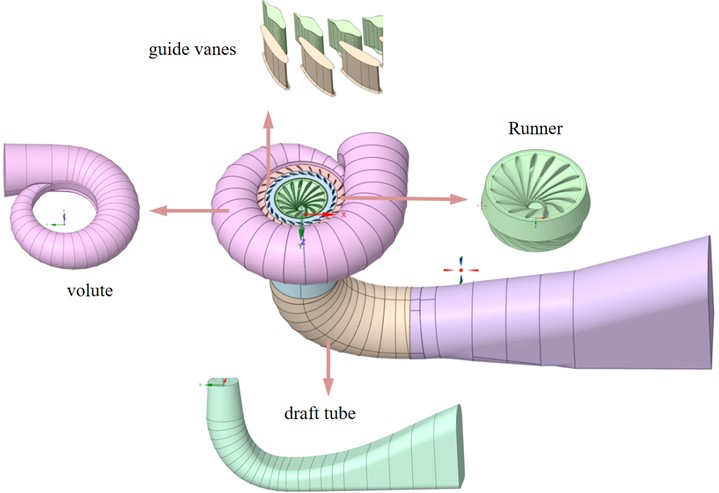
Fig. 2Three dimensional mesh model of all parts of the whole flow channel of the turbine
a) Volute domain
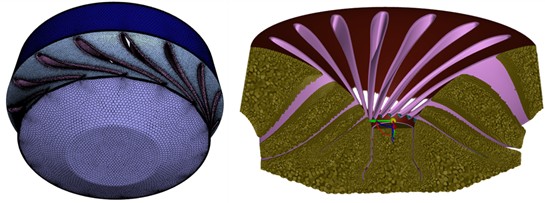
b) Runner domain
c) Draft tube domain
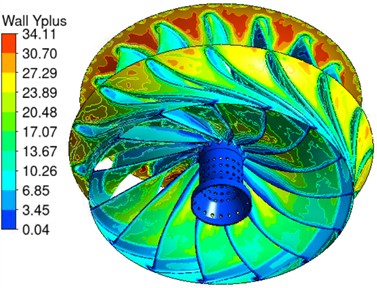
During the grid division process, the areas with large curvature and requiring special attention are refined. Considering the computational cost and accuracy comprehensively, the total number of grids for the entire flow channel is approximately 4.29×10⁶, among which there are about 3.4×10⁵ grids for the volute domain, about 2.01×10⁶ grids for the guide vane domain, about 1.56×10⁶ grids for the runner domain, and about 3.7×10⁵ grids for the draft tube domain. The local grids of the volute domain, the draft tube domain and the runner domain are shown in Fig. 2, respectively. Five sets of grid schemes with 25.76 million, 37 million, 38.7 million, 42.9 million, and 51 million grids are selected to complete the grid independence verification. The results are shown in Fig. 3. The values of the rotating wheel wall are shown in Fig. 4. The results show that the grid quality can meet the computational requirements.
Fig. 3Grid independence test
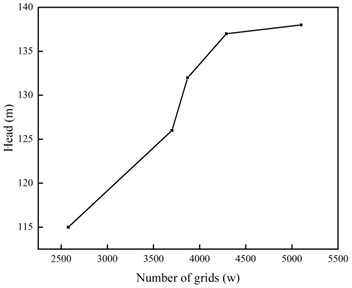
Fig. 4Y+ value of the rotating wheel wall surface
2.3. Flow field calculation setting
This paper selects different operating conditions to calculate the simulation error. The full-flow passage flow field calculations are carried out at a rated power, 0.5 times the rated power, and 0.2 times the rated power in the rated head, respectively. The specific parameter settings are shown in Table 2. Because the volume loss, hydraulic loss and mechanical loss during operation were not taken into account, the calculated power and efficiency are generally overestimated. When the flow rate is large, due to the SST model’s failure to fully capture the flow details within the runner, the efficiency is relatively low. This has a relatively small impact on the study of the flow properties under different working conditions.
Table 2Simulation errors under various operating conditions
Number | Guide vane opening () | Computational power (MW) | Computational efficiency () | Actual efficiency () | Error () |
1 | 75.9 | 863.3 | 92.5 | 95.25 | 2.7 |
2 | 40 | 505.7 | 93.7 | 90.5 | 5.3 |
3 | 18.99 | 176.1 | 72.36 | 69.1 | 6.2 |
The rotating reference frame method is employed to simulate the rotation of the runner in the runner domain. For transient calculations, the sliding mesh method is utilized. Set the runner as the moving part, select the partial flow field of the runner as the moving area, and set the grid interface between the moving domain and the stationary domain. The given rotational speed is 93.75 r/min, and the total pressure at the inlet of the spiral case and the static pressure at the outlet of the draft tube are set as boundary conditions. The time step for transient calculations is 0.0015 s. The inlet pressure is set at 1.51×10⁶, and the outlet pressure is set at 1.69×10⁵. The residual converges is set at 10-5. After the transient calculation stabilizes, data such as pressure pulsation are collected. The sampling frequency is 2000 Hz.
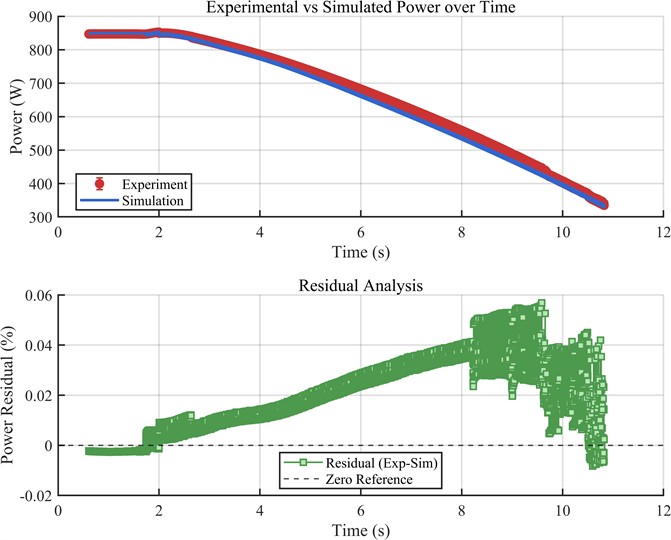
The over-flow was reduced by gradually closing the guide vanes. The closing patterns of the guide vanes were all linear. After running stably at the rated condition for a period of time, the guide vanes were closed at a relatively high rate, resulting in a significant decrease in load and flow rate. To verify the accuracy of the simulation calculation, the power values during the transient process were selected as the observed values. The comparison between the simulation results and the field test results is shown in Fig. 5. As can be seen from the figure, the simulation error is relatively large in the low-load zone. This is because the flow pattern in the low-load zone is more complex, and there is also a situation where the model is difficult to capture the flow details, thus resulting in a larger error. The average error value is less than 3 %, which can meet the current calculation requirements.
Fig. 5Comparison of simulation calculation and test results
2.4. Noise calculation setting
To further investigate the relationship between pressure pulsation and flow-induced noise of this large-scale Francis turbine under transient process, and to analyze the pressure pulsation and noise characteristics of the turbine under partial load conditions, this paper conducts noise characteristic calculations. The noise is calculated using the Acoustics Model built into Fluent. The calculation model adopts the acoustic analogy method, which decouples the acoustic wave equation from the flow control equation. At this time, solving the N-S equation can describe the process of sound wave generation and propagation. The decoupling formulas are shown as Eq. (5-6):
where, is fluid density, is undisturbed sound velocity in the far field, is Lighthill stress tensor, is static pressure, is viscous stress tensor, is Kronecker delta function.
The left side of Eq. (5) describes the process of sound waves propagating at a speed of in a uniform and stationary medium, while the right side is a sound source term determined by flow variables. The solution of can be obtained without considering the influence of acoustic feedback on the flow, and the flow field information is determined by CFD calculation. Then, taking as a known source term, solving the wave equation on the left side can yield the density disturbance that propagates to the far field.
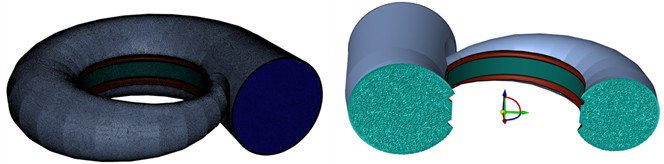
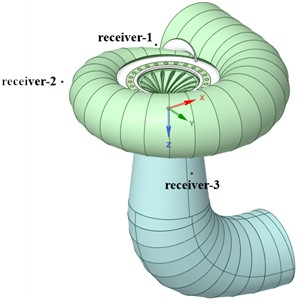
Three monitoring points are set: receiver-1 in the draft tube, receiver-2 at the volute door, and receiver-3 at the tailrace door. All rotating walls are set as noise sources. Since the medium is liquid water, all relevant parameters are set to default values. The specific settings are shown in Fig. 6.
During the calculation process, the number of noise sampling points and the sampling frequency were fully considered. The unsteady calculation step size was set to 0.000356 seconds, corresponding to a 0.2-degree rotation of the runner. Each small step was iterated 20 times. A total of 5 revolutions were calculated. After ensuring the stability of the calculation by computing 3 revolutions, the Acoustic Model was activated and the relevant data began to be saved. After the calculation was completed, the saved asd files were read to obtain the noise signal varying with time. The time-domain noise signal after stabilization was subjected to Fourier transformation to obtain the frequency-domain characteristics of the noise.
Fig. 6Measuring point locations
3. Result analysis
3.1. Flow characteristics under transition process
The flow fields at 9 s, 12.6 s and 16.2 s of the calculation conditions were selected for analysis. The specific external characteristic parameters are shown in Table 3.
Table 3External characteristic parameters of flow field analysis conditions
Time (s) | Power (MW) | Mass flow rate (kg/s) |
9 | 852.69 | 658736 |
12.6 | 707.69 | 532048 |
16.2 | 471.17 | 372154 |
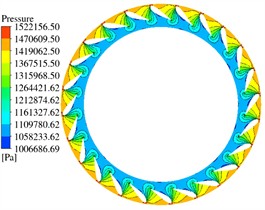
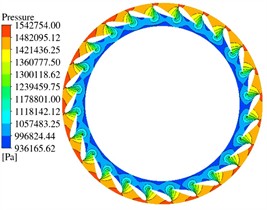
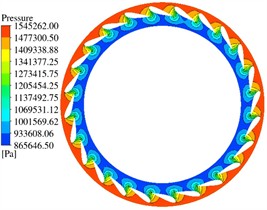
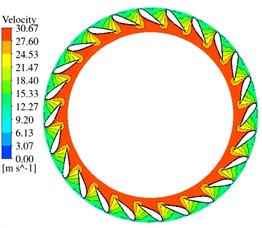
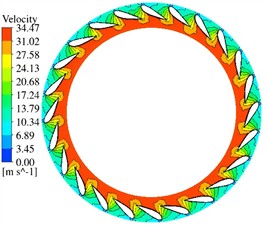
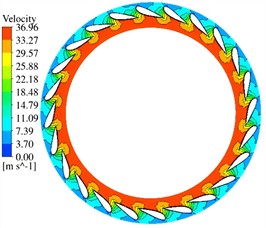
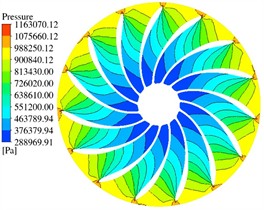
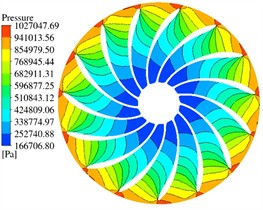
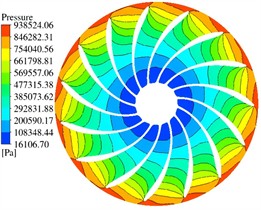
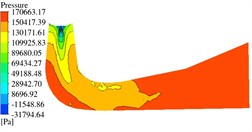
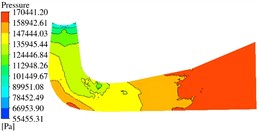
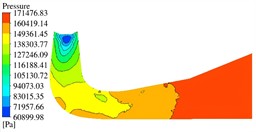
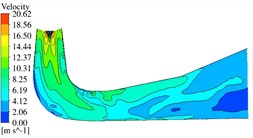
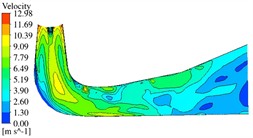
The pressure distribution cloud diagrams of the cross-section at the center of the volute for the three time points are shown in Fig. 7. It can be observed that the pressure distribution patterns in the volute for the three conditions are basically the same, all decreasing from the outside to the inside. It can be predicted that there will be pressure extremes at the welded connection of the volute, with the minimum value on the inside and the maximum value on the outside. Under the same water head, the smaller the opening angle, the greater the pressure at the same point inside the volute. The velocity distribution cloud diagrams of the cross-section at the center of the volute for the three time points are shown in Fig. 8. It can be observed that the velocity distribution patterns in the volute for the three conditions are basically the same, all increasing from the outside to the inside, with local high-speed fluid near the tongue plate. Under the same water head, the smaller the opening angle, the smaller the velocity at the same point inside the volute.
Fig. 7Distribution of pressure field in the volute
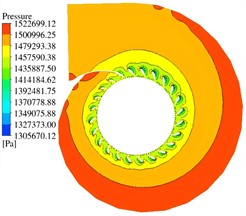
a) 9 s
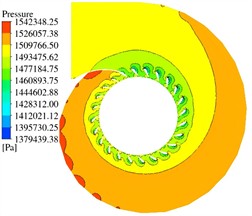
b) 12.6 s
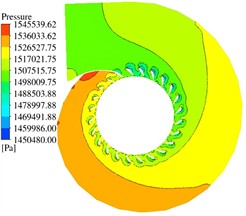
c) 16.2 s
Fig. 8Distribution of Velocity Field in the Volute
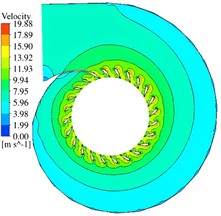
a) 9 s
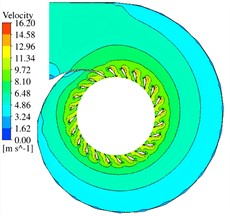
b) 12.6 s
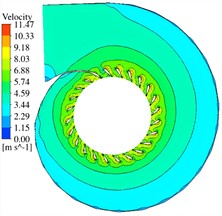
c) 16.2 s
The comparison of pressure distribution cloud diagrams at the center section of the guide vanes is shown in Fig. 9. It can be observed that the pressure gradually decreases from the inlet of the fixed guide vanes to the outlet of the moving guide vanes. However, there are local high-pressure areas at the heads of both the fixed and moving guide vanes. The comparison of velocity distribution cloud diagrams at the center section of the guide vanes is shown in Fig. 10. It can be found that the flow velocity gradually increases from the inlet of the fixed guide vanes to the outlet of the moving guide vanes. There are velocity stagnation points at the heads of both the fixed and moving guide vanes.
Fig. 9Distribution of the pressure field in the guide vane
a) 9 s
b) 12.6 s
c) 16.2 s
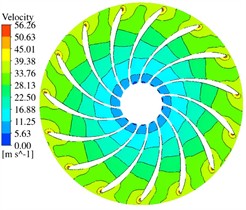
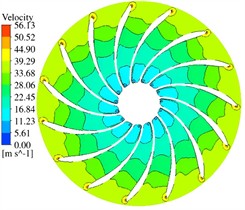
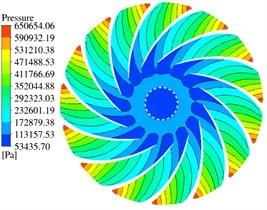
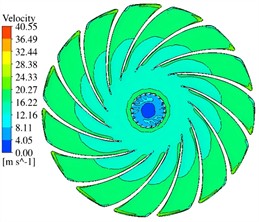
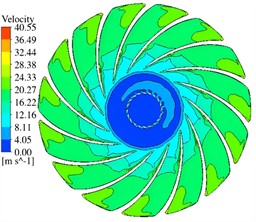
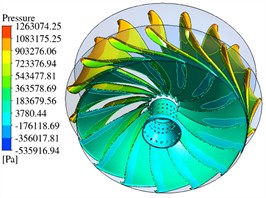
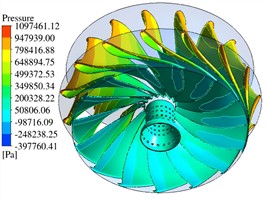
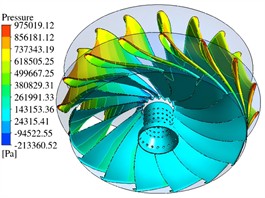
The comparison of pressure distribution and velocity distribution cloud diagrams at the runner section –2 m is shown in Figs. 11-12, and the comparison of pressure distribution cloud diagrams at the runner section –0.9 m is shown in Figs. 13-14. The distribution of the vortices inside the runner is shown in Fig. 15. It can be found that under the same water head, as the power decreases, the low-pressure area and the low-velocity area gradually encroach from the blade outlet towards the blade inlet. Under operating conditions 2 and 3, there is a relatively obvious blade passage vortex phenomenon, which may induce unstable flow. Under the condition of basically the same output, as the water head increases, the pressure of the low-pressure area at the blade outlet edge decreases, making it more likely to cause cavitation on the back of the blade outlet edge.
Fig. 10Distribution of the velocity field of the guide vane
a) 9 s
b) 12.6 s
c) 16.2 s
Fig. 11Pressure field distribution of the runner cross-section at Z= –2 m
a) 9 s
b) 12.6 s
c) 16.2 s
Fig. 12Velocity field distribution of the runner cross-section at Z= –2 m
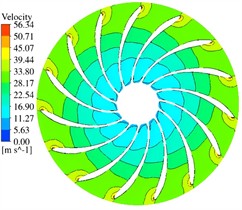
a) 9 s
b) 12.6 s
c) 16.2 s
Fig. 13Pressure field distribution of the runner cross-section at Z= –0.9 m
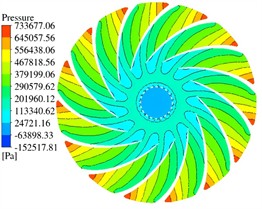
a) 9 s
b) 12.6 s
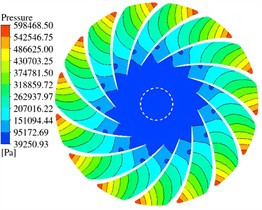
c) 16.2 s
Fig. 14Velocity field distribution of the runner cross-section at Z= –0.9 m
a) 9 s
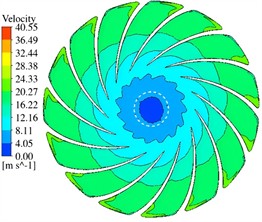
b) 12.6 s
c) 16.2 s
Fig. 15Distribution of vortices inside the runner
a) 9 s
b) 12.6 s
c) 16. 2 s
The Distribution and variation of the rotating vortex is shown in Fig. 16. Vortex identification is carried out using the criterion. This vortex identification criterion has a strong ability to remove wall shear contamination and can better reflect the actual vortex conditions. In the figure, the vortex structure is represented by the 0.52 isosurface. As the load gradually decreases, the minimum pressure gradually increases, which to some extent indicates that the degree of cavitation gradually weakens as the flow rate decreases. There is a vortex structure near the small hole of the draft tube, which may be the result of the opposite circulation of the internal vortex band of the draft tube and the external water flow colliding near the small hole. At 16.2 seconds, the operating load decreased to 471.17 MW. Obvious blade passage vortices were distributed on the pressure side near the outlet within the runner, and these blade passage vortices gradually developed. This initially indicates that the transitional process had better not exceed 600 MW.
Fig. 16Distribution of the rotating vortex
a) 9 s
b) 12.6 s
c) 16.2 s
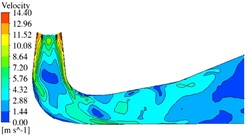
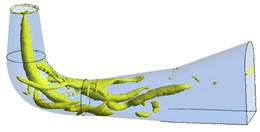
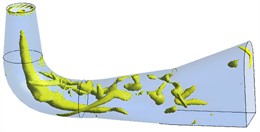
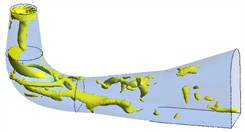
The pressure distribution cloud diagrams and the velocity distribution cloud of the draft tube cross-section at 0 m are compared as shown in Figs. 17-18, and the vortex distribution in the draft tube as shown in Fig. 18. It can be observed that, under the same head, as the power decreases, the flow in the draft tube becomes more turbulent, the range of the low-velocity area at the center expands, and the high-velocity area is mainly distributed near the wall. Vortex distribution in the draft tube is shown in Fig. 19. The vortex structure is represented by the 0.78 isosurface. When the load is reduced to 599.1 MW, a ring-shaped vortex zone appears at the inlet of the draft tube cone, and there is a phenomenon of the central vortex band breaking. When the load is further reduced to 471.17 MW, the vortex band in the draft tube gradually changes from a columnar vortex band to a helical vortex band. The lower the load, the more the helical vortex band develops and grows. This further indicates that during the transition process, operation in this area for a long time should be avoided.
Fig. 17Distribution of pressure field in the draft tube
a) 9 s
b) 12.6 s
c) 16.2 s
Fig. 18Distribution of velocity field in the draft tube
a) 9 s
b) 12.6 s
c) 16.2 s
Fig. 19Distribution of vortex in the draft tube
a) 9 s
b) 12.6 s
c) 16.2 s
3.2. Calculation of noise characteristics
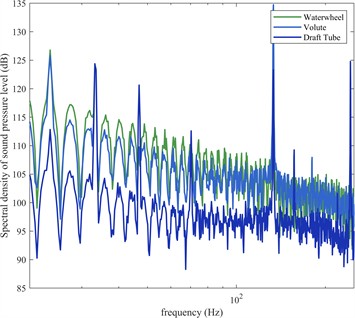
The noise power spectral density of the non-blade area, volute and tail water during the process of the simulation unit’s power decreasing from 850 MW to 650 MW is shown in Fig. 20, with a comparison of the simulation results and the test. It can be seen that the noise intensity of the unit at 22 Hz, 50 Hz and 100 Hz is relatively large, which is related to the operation status of the unit itself. The 50 Hz noise comes from the electromagnetic vibration of the unit, so there is no 50 Hz noise frequency in the simulation. The 22 Hz is the vibration frequency of the blade, and the noise can be clearly captured at the measurement point in the volute. The 100 Hz frequency is very obvious at all three measurement points, which may be a special frequency caused by the vibration of the water body in the runner during operation. By comparing the test results with the simulation results, it can be found that the noise intensity obtained from the test is higher than the simulation value. This is because the noise sources in the field are more complex than those set in the simulation. Relatively speaking, the noise from the rotating wall can account for a large proportion.
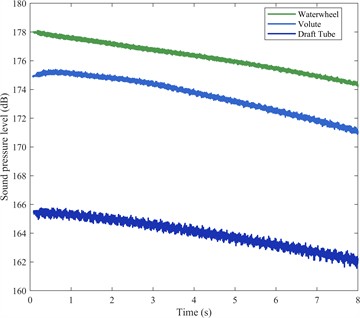
By further comparing the noise changes at different positions of the unit from 600 MW to 450 MW, as shown in Fig. 21, it can be found that the noise intensity shows a downward trend. It can be seen that when the unit is operating in the vibration zone, the vibration at the runner position does not contribute to the overall noise enhancement. At this time, the main source of vibration noise is still the tailwater vortex rope section. Meanwhile, during the passage through the vibration zone, multiple frequencies with high noise intensity emerged, which might increase the probability of the runner resonating and subsequently cause damage to the unit components. Therefore, the operating time in this area should be reduced.
Fig. 20Frequency domain characteristics of noise under rated operating conditions
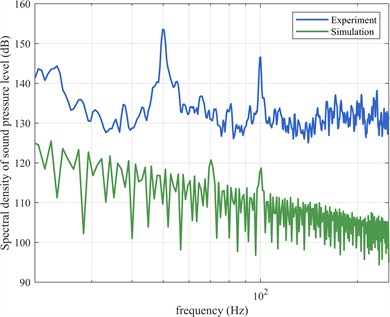
a) Noise in the waterwheel room
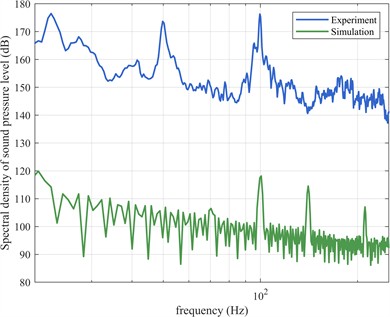
b) Noise in the volute door
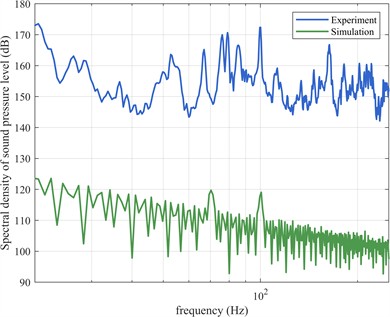
c) Noise in the draft tube
Fig. 21Comparison of noise during the load reduction process
4. Conclusions
This study employs Computational Fluid Dynamics (CFD) based on the SST - turbulence model to numerically simulate the transient flow within a large-scale Francis turbine during a load reduction process. Coupled with an acoustic model, the flow-induced noise characteristics are also investigated. The main conclusions are as follows:
1) Decreasing the guide vane opening under constant head leads to reduced pressure and velocity in the volute and guide vane regions. Within the runner, low-pressure and low-velocity zones expand from the blade outlet toward the inlet as power decreases. The transition process promotes vortex development, including blade passage vortices in the runner and a shift from columnar to helical vortex ropes in the draft tube under lower loads, indicating increased flow instability.
2) Noise analysis identifies dominant frequencies associated with blade vibration and runner operation. Sound pressure levels decrease with load reduction, though certain frequency bands exhibit elevated amplitudes.
3) Prolonged operation below approximately 600 MW should be avoided to minimize vortex-induced pressure pulsations, noise, and potential structural risks.
4) In summary, this work clarifies the relationship between transient flow patterns and acoustic emissions in Francis turbines, providing insights for optimizing operational stability and guiding vibration-noise control strategies in hydropower systems. However, the article only considered the noise from the rotating wall area, which led to a discrepancy with the test results. In the next step, multiple noise sources will be calculated to match the test results. Additionally, the impact of flow regime changes during the transitional process on the damage of unit components can be studied to further guide the actual production process of the unit.
References
-
Y. Li, G. Song, and Y. Yan, “Transient hydrodynamic analysis of the transition process of bulb hydraulic turbine,” Advances in Engineering Software, Vol. 90, pp. 152–158, Dec. 2015, https://doi.org/10.1016/j.advengsoft.2015.08.006
-
Y. Luo et al., “Multibody dynamics analysis of a Kaplan turbine runner in full operating conditions,” Journal of Energy Storage, Vol. 72, p. 108269, Nov. 2023, https://doi.org/10.1016/j.est.2023.108269
-
Z. Wang et al., “Hydroturbine operating region partitioning based on analyses of unsteady flow field and dynamic Response,” Science China Technological Sciences, Vol. 53, No. 2, pp. 519–528, Feb. 2010, https://doi.org/10.1007/s11431-009-0262-6
-
B. Altintas, E. Ayli, K. Celebioglu, S. Aradag, and Y. Tascioglu, “Mitigating cavitation effects on Francis turbine performance: A two-phase flow Analysis,” Ocean Engineering, Vol. 317, p. 120018, Feb. 2025, https://doi.org/10.1016/j.oceaneng.2024.120018
-
Y. Xiong, Z. Lai, X. Liu, X. Deng, and J. Pang, “Internal flow and pressure pulsation characteristics of a high-head francis turbine under wide load conditions,” Processes, Vol. 13, No. 9, p. 2939, Sep. 2025, https://doi.org/10.3390/pr13092939
-
J. Xu, P. Chen, Y. Li, X. Yang, and A. Yu, “Research on internal flow and runner force characteristics of Francis turbine,” Water, Vol. 17, No. 20, p. 3004, Oct. 2025, https://doi.org/10.3390/w17203004
-
H. Hosseinimanesh, C. Devals, B. Nennemann, M. Reggio, and F. Guibault, “A numerical study of francis turbine operation at no-load condition,” Journal of Fluids Engineering, Vol. 139, No. 1, pp. 011104–11104, Jan. 2017, https://doi.org/10.1115/1.4034422
-
S. Li, J. Pang, C. Dan, W. Xiang, X. Yi, and X. Liu, “Influence of load variation on the flow field and stability of the francis turbine,” Journal of Marine Science and Engineering, Vol. 13, No. 2, p. 316, Feb. 2025, https://doi.org/10.3390/jmse13020316
-
F. Wang et al., “Research on the coupling characteristics of unstable fluid and structure of large-scale hydraulic turbine I: coupling model and pressure field calculation,” Journal of Hydraulic Engineering, Vol. 42, pp. 1385–1391, 2011.
-
A. Rezavand Hesari, M. Gauthier, M. Coulaud, Y. Maciel, and S. Houde, “Flow characteristics of a Francis turbine under deep Part-load and various no-load conditions,” Experiments in Fluids, Vol. 65, No. 11, Nov. 2024, https://doi.org/10.1007/s00348-024-03904-y
-
Y. Li, L. Sun, and P. Guo, “Investigation of the transient characteristics of the Francis turbine during runaway process,” Renewable Energy, Vol. 237, p. 121840, Dec. 2024, https://doi.org/10.1016/j.renene.2024.121840
-
X. Yan, F. Zhang, Y. Zheng, K. Kan, and M. Rossi, “Numerical investigation of hydraulic instability of pump-turbines in fast pump-to-turbine transition,” Journal of Energy Storage, Vol. 96, p. 112731, Aug. 2024, https://doi.org/10.1016/j.est.2024.112731
-
X. Mao et al., “Characteristics of runner of francis turbine under multiple operating conditions,” Transactions of the Chinese Society of Agricultural Engineering, Vol. 39, pp. 95–102, 2023.
-
X. Wang, Y. Yan, and W.-Q. Wang, “Research on hydrodynamic noise in the Francis turbine using large eddy simulation and acoustic Analogy,” Journal of Hydrodynamics, Vol. 37, No. 4, pp. 786–803, Oct. 2025, https://doi.org/10.1007/s42241-025-0052-z
-
R. Tao, X. Zhao, and Z. Wang, “Evaluating the transient energy dissipation in a centrifugal impeller under rotor-stator interaction,” Entropy, Vol. 21, No. 3, p. 271, Mar. 2019, https://doi.org/10.3390/e21030271
-
X. Zhao et al., “Experimental study on aeroacoustics control for high-speed partial admission turbine based on flow path optimal design,” Journal of Propulsion Technology, Vol. 37, pp. 266–272, 2016.
-
Q. Yang et al., “Research on the Hydrodynamic Noise Characteristics of a Mixed-Flow Pump,” Journal of Marine Science and Engineering, Vol. 11, No. 12, p. 2209, Nov. 2023, https://doi.org/10.3390/jmse11122209
-
L. Wang et al., “Research on the vortex rope control techniques in draft tube of Francis turbines,” Energies, Vol. 15, No. 24, p. 9280, Dec. 2022, https://doi.org/10.3390/en15249280
About this article

This work was supported by the Scientific Research Project of Luquan Wudongde Power Plant, Three Gorges Jinsha River Yunchuan Hydropower Development Co., LTD (Z522302036).
The datasets generated during and/or analyzed during the current study are available from the corresponding author on reasonable request.
Xiuru He: conceptualization, methodology, formal analysis, writing-original draft preparation. Xiangbo Liao: methodology, software, investigation, data curation, writing-original draft preparation, visualization. Qianlin Luo: software, validation, formal analysis, data curation, writing-review and editing, visualization. Wengui Zhao: validation, investigation, resources. Xueli An: conceptualization, resources, writing-review and editing, supervision, project administration, funding acquisition.
The authors declare that they have no conflict of interest.
