Abstract
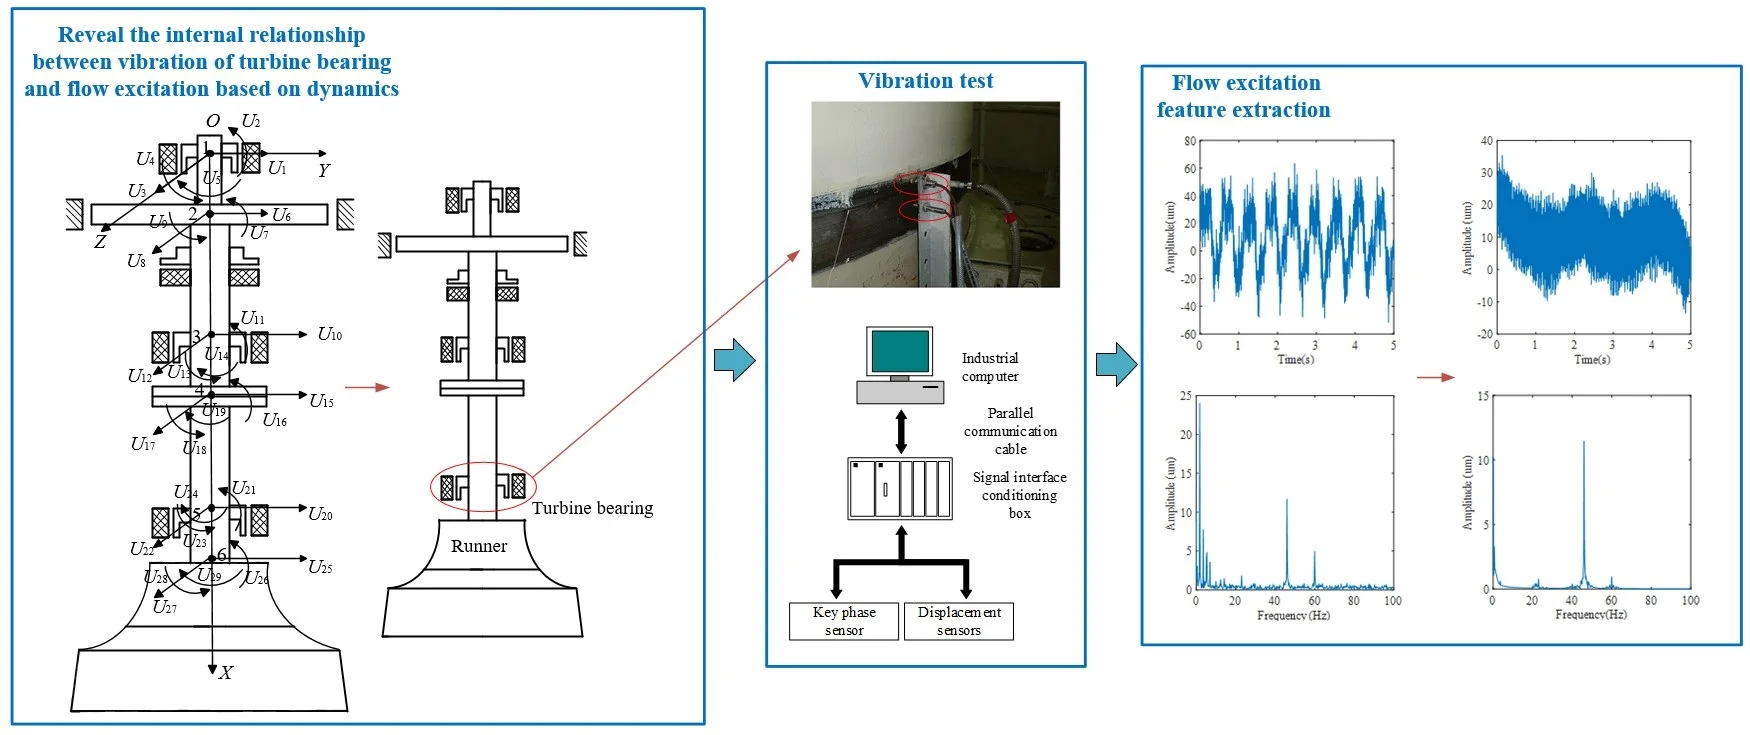
During the operation of hydraulic turbine, the vibration often exceeds the standard due to flow excitation, which affects the safe and stable operation of the hydraulic turbine. In this paper, an on-line monitoring method for the flow excitation in Francis hydraulic turbine is proposed based on the dynamic characteristics of Francis hydraulic turbine. Firstly, based on the flow excitation characteristics in Francis hydraulic turbine and the dynamic equation of main shaft system, the internal relationships between the dynamic response of turbine bearing and the flow excitation in the Francis hydraulic turbine are clarified. Secondly, according to these relationships, a method based on wavelet transform (WT), particle swarm optimization (PSO), and variational mode decomposition (VMD) is proposed for extracting the flow excitation features in Francis hydraulic turbine. Then, by this method, the flow excitation features are acquired. Based on the obtained flow excitation features, the flow excitation can be monitored on-line. Finally, the proposed on-line monitoring method for the flow excitation in Francis hydraulic turbine is verified by experiments. Based on the results, the flow excitation components in the signal extracted by this method are about 35 % more than those extracted by the previous methods. The results show that the on-line monitoring method proposed in this paper is convenient and effective.
Highlights
- The internal relationships between the dynamic response of turbine bearing and the flow excitation in the Francis hydraulic turbine are discovered.
- A novel on-line monitoring method for the flow excitation in Francis hydraulic turbine is proposed.
- A signal processing method based on WT, PSO, and VMD is proposed for extracting the feature information in the vibration signal of turbine bearing.
1. Introduction
Hydraulic power plays an important role in providing the necessary energy storage to stabilize the electric grid [1]. In the hydraulic power plants, the flow excitation provides the main driving force to realize hydropower generation. Meanwhile, the flow excitation is also the main factor that leads to powerful vibration in the hydraulic turbine and thus affects the safe and stable operation of the hydraulic turbine [2]. For example, there was an accident at the Russian Sayano Shushenskaya Hydropower Station in 2009. The main reason for the accident was that the flow excitation characteristics in hydraulic turbine in the low load areas were ignored. As a result, the turbine frequently operated in the high vibration area, which eventually led to catastrophic consequences. In order to ensure the safe and stable operation of the hydraulic turbine, it is necessary to study the flow excitation characteristics in hydraulic turbine and monitor the flow excitation on-line.
Currently, the performance of structures under flow excitation have been studied. For example, A. Shishegaran et al. [3] studied the performance of a new vertical channel fishway and used gene expression programming to predict the maximum turbulence, maximum velocity, resting area and water depth of the pool in the fishway. A. Bigdeli et al. [4] studied the influence of internal water pressure of reinforced concrete tunnel on its own damage and deflection. These studies reveal the relationship between flow excitation and structural performance. Besides, the flow excitation characteristics in hydraulic turbine have been mainly studied by three kinds of methods, which are theoretical methods, numerical methods, and experimental methods respectively. By the theoretical methods, the theoretical model of hydraulic turbine is established to study the vibration characteristics under flow excitation. For example, Li et al. [5] established the nonlinear coupling dynamic equation of the runner blade by using the finite element method and studied the dynamic response characteristics of the runner blade under the flow excitation. P. Pennacchi et al. [6] established the dynamic response model of a Francis turbine, which had been validate by experimental data. The above researches show that by theoretical methods, the relationships between the vibration characteristics and the flow excitation characteristics of the hydraulic turbine can be clarified. By the numerical methods, the pressure pulsation caused by the vortex rope in the draft tube, the pressure pulsation caused by rotor-stator interaction (RSI), and the pressure pulsation caused by Karman vortex have been mainly studied. For example, L. Minakov et al. [7] performed numerical simulation of the flow in a Francis turbine at startup condition. Zhao et al. [8] conducted the steady and unsteady simulations of the pressure fluctuations in a pump-turbine with the SAS SST-CC turbulence model. Although the flow excitation characteristics in hydraulic turbine can be studied by the numerical methods, the researches have still need to be verified by the experiments. By the experimental methods, the pressure pulsation characteristics of flow excitation in hydraulic turbine have been mainly tested and analyzed by scholars. For example, Zhu et al. [9] studied the pressure pulsation of hydraulic turbine by model test performed on the universal hydraulic machinery test stand. Lai et al. [10] performed experimental measurements for the vortex ropes in the draft tube of a model pump-turbine. It can be seen from the above researches that their experiments were mainly performed on the model hydraulic turbine in laboratory. The main reason for the phenomenon is the difficulties in directly monitoring the pressure pulsation characteristics of flow excitation on-line in the hydropower station [11]. However, compared with the results obtained by direct on-line monitoring of the flow excitation in the hydropower station, the results obtained by the experiment based on model hydraulic turbine are not sufficiently good [12].
The flow excitation is one of the main factors causing strong vibrations of the hydraulic turbine [2]. Consequently, the vibration signal of hydraulic turbine contains the feature information related to the flow excitation. If the feature information about the flow excitation can be extracted from the vibration signal of hydraulic turbine, the flow excitation can be monitored online [13]. The flow excitation directly acts on the runner blades, so the vibration signal of the runner blades can best reflect the flow excitation characteristics. At present, the vibration test of runner blades is mainly conducted by directly pasting the strain gauges on the blades. Runner blades are in direct contact with water. During the operation of hydraulic turbine, the blades will be subject to greater hydraulic impact, and then the strain gauges will fall off. Although there are protection devices for strain gauges, most of them are connected with the strain gauges in the form of welding, which may lead to signal distortion in the test process, and the data reliability is difficult to guarantee. So it is a challenge to monitor the vibration signal of runner blades on-line and real-time in the hydropower station [14]. The turbine bearing of hydraulic turbine is one of the key components closest to the runner of hydraulic turbine. So the vibration signal of turbine bearing also contains a large amount of information about the flow excitation [15]. Meanwhile, the vibration signal of turbine bearing is easily obtained by the on-line and real-time monitoring. Therefore, it is a practical and effective method for monitoring the flow excitation in hydraulic turbine on-line by measuring the vibration signal of turbine bearing and extracting the flow excitation feature from the vibration signal.
In this paper, a novel monitoring method for the flow excitation in Francis hydraulic turbine is proposed based on the dynamic characteristics of Francis hydraulic turbine. The remainder of this paper is organized as follows: the internal relationships between the dynamic response of turbine bearing and the flow excitation in the Francis hydraulic turbine are clarified in Section 2. The method for flow excitation feature extraction is introduced in Section 3. The on-line monitoring method proposed in this study is verified by experiments in Section 4. The conclusion is presented in Section 5.
2. Flow excitation characteristics in francis hydraulic turbine
2.1. Flow excitation in francis hydraulic turbine
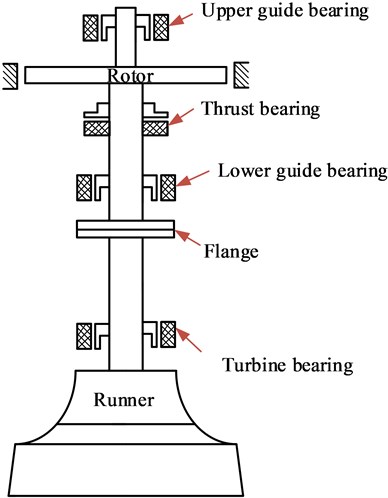
The Francis hydraulic turbine mainly consists of main shaft and runner. The structure diagram of the main shaft system of Francis hydraulic turbines is shown in Fig. 1. Runner blade is the main component that transmits and bears the hydraulic power of the Francis hydraulic turbine. Accordingly, it often vibrates violently under the complex flow excitation when working, which affects the dynamic performance of the Francis hydraulic turbine [5]. In order to fully reflect the influence of flow excitation on the Francis hydraulic turbine, the following typical types of flow excitation are considered in this study: 1) the pressure pulsation caused by Karman vortex, 2) the pressure pulsation caused by the vortex rope in the draft tube, 3) the pressure pulsation caused by RSI [16].
Fig. 1Structure diagram of the main shaft system of Francis hydraulic turbines
The pressure pulsation caused by Karman vortex can be expressed as [17]:
where is the influence coefficient of tail shape of the runner blade, is the fluid density, is the thickness of blade outlet edge, is the water outlet velocity, is the initial phase, is the frequency of the pressure pulsation, which can be expressed as:
where is the Strouhal number, which is generally in 0.22-0.27.
The pressure pulsation caused by the vortex rope in the draft tube can be expressed as [17]:
where and denote the amplitude and frequency of the pressure pulsation, respectively, is the initial phase of the pressure pulsation, which is related to the relative position of the blade and draft tube at the initial moment. Moreover, studies show that the frequency of the pressure pulsation is about 0.2-0.4 times of the rotating frequency of the runner [18].
According to the interference principle between stationary system (guide vanes) and rotating system (runner), the pressure pulsation caused by RSI can be written as [19]:
where is the average amplitude of the pressure pulsation, and are harmonic order, which are generally 1 or 2 in actual system, and are the angular coordinates of the stationary system (guide vanes) and the rotating system (runner), respectively, and are the number of guide vanes and the number of runner blades, respectively, denotes the rotating frequency of the Francis hydraulic turbine. Therefore, the frequencies of pressure pulsation caused by RSI is generally the blade passing frequency and guide vane passing frequency [20].
2.2. Influence of flow excitation on the dynamic response of turbine bearing
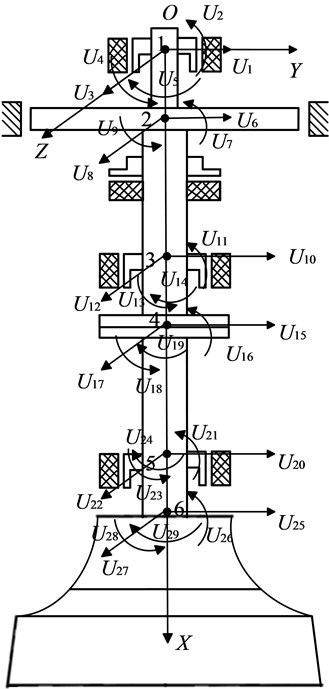
The diagram of the main shaft system of Francis hydraulic turbine is shown in Fig. 2. The main shaft system is discretized to six nodes as the following: nodes 1 and 3 are set to the mid-point of the upper and lower guide bearings, respectively; nodes 2 and 4 are set to the geometrical center of the generator rotor and the flange, respectively; node 5 is set to the mid-point of the turbine bearing; node 6 is set to the midpoint of the area connecting the turbine shaft and turbine runner. , , , , , and denote displacements of these nodes along the -axis, respectively. , , , , , and are the cross-sectional rotation angles at these nodes along the -axis, respectively. , , , , , and are displacements of these nodes along the -axis, respectively. , , , , , and are the cross-sectional rotation angles at these nodes along the -axis, respectively. , , , and are torsional angles of these nodes around -axis, respectively. Based on the presented definitions, the generalized coordinate vector of the main shaft system can be expressed as:
Further, the dynamic equation of main shaft system is established by the finite element method, which is expressed as [21]:
where , , and are the mass matrix, stiffness matrix, and damping matrix of the system, respectively. , , and denote the generalized displacement vector, generalized velocity vector, and generalized acceleration vector, respectively. are the external excitations, include the flow excitation, mass eccentric force and electromagnetic force, respectively.
According to the dynamic equation, the internal relationships between the dynamic response of turbine bearing and the flow excitation in the Francis hydraulic turbine can be analyze.
Based on the mass matrix and stiffness matrix in Eq. (5), the frequency equation of main shaft system can be established by mechanical vibration [22], that is:
where is the natural frequency.
According to Eq. (6), the natural frequency of main shaft system can be obtained.
By the mode superposition method, the dynamic response of the system can be solved as:
where is the -th regular mode, is the -th modal coordinate.
Fig. 2Diagram of the main shaft system of a Francis hydraulic turbine
Since the Francis hydraulic turbine is affected by many factors such as hydraulic force, electromagnetic force, and mechanical unbalance force during operation, the vibration of turbine bearing is also related to these forces. Consequently, frequency components in the vibration signal of turbine bearing are of various kinds and the low-frequency components are dense [23].
The damping is one of the important dynamic characteristics of mechanical systems, and it is also one of the main causes of vibration energy attenuation. Therefore, the closer the position to the excitation source, the smaller the degree of attenuation. Since the flow excitation directly acts on the runner blades, and the turbine bearing is a supporting bearing closest to the runner, the attenuation of the vibration signal of turbine bearing under the action of flow excitation is small. In other words, the vibration signal of turbine bearing contains rich feature information about flow excitation [15]. Because the vibration signal of turbine bearing is easy to be monitored on-line, it is feasible to obtain the relevant information about the flow excitation by processing the vibration signal of turbine bearing.
3. Method for flow excitation feature extraction
3.1. Determination of the method
According to the theoretical analysis in Section 2, the vibration of the turbine bearing is affected not only by hydraulic factors, but also by mechanical and electromagnetic factors. Studies show that the frequencies of flow excitation are complex, and there are both high-frequency and low-frequency components. Besides, the mechanical and electromagnetic excitation are mostly low frequencies, which are close to the low frequency flow excitation. The flow excitation characteristics in Francis hydraulic turbine cannot be directly reflected in the vibration signal of turbine bearing.
In order to extract the flow excitation features from the vibration signal with many frequency components, the appropriate signal processing method is needed. Variational mode decomposition (VMD) is a non-recursive adaptive decomposition algorithm. It avoids the end effect and mode mixing phenomena that occur in other decomposition algorithms and has good robustness to noise. Meanwhile, VMD can effectively separate two pure harmonic signals with similar frequency and have a solid mathematical theoretical foundation [24]. However, for the low frequency components with very similar frequency in the vibration signal of turbine bearing, the required components are difficult to be separated by VMD [25]. So in order to realize the flow excitation feature extraction from the vibration signal of turbine bearing, the improvement of VMD is crucial.
So far, in-depth researches have been conducted in the improvement of VMD. These researches mainly include two aspects: multiple decomposition based on VMD combined with other methods and the parameters optimization of VMD. In terms of the former, the different decomposition methods have been combined to achieve multiple-decomposition. For instance, Wang et al. [26] combined wavelet transform (WT) and VMD to improve the mode mixing in single decomposition method. Besides, A. Upadhyay et al. [27] proposed a mEMD-VMD method for restraining the white noise in speech signal. These multiple decomposition methods based on VMD can achieve good decomposition effects. It is worth noting that the parameters of VMD determine its decomposition performance. If parameter optimization is not considered, the decomposition effect may be affected. Therefore, a lot of research has been done on the parameters optimization of VMD. For example, Zhou et al. [28] used particle swarm optimization (PSO) algorithm to optimize the parameters of VMD to extract the fault features in the vibration signal of hydraulic pump. Also, Ding et al. [29] used the grid search algorithm to select VMD optimal parameters. Although the performance of VMD can be improved by the parameters optimizations of VMD in the above researches, the performance of VMD may be better when combining the parameters optimization of VMD with multiple decomposition based on VMD. However, the relevant researches have rarely been reported in the literature.
In order to extract the flow excitation feature, it is necessary to consider both multiple decomposition based on VMD and the parameters optimization of VMD to obtain a better decomposition effect. So a method for extracting the flow excitation feature from the vibration signal of turbine bearing is proposed by integrating WT, PSO, and VMD. Firstly, WT is applied to decompose the original signal into several components at different frequency bands, where the step is mainly considered as the optimization of the decomposition frequency band of VMD. Secondly, the intrinsic mode functions (IMFs) that reflect the flow excitation feature are extracted from these components by PSO-VMD. Finally, the flow excitation feature signal is obtained by reconstructing the feature IMFs from each component.
3.2. Division of frequency bands by WT
WT is a signal processing method with multiresolution analysis. WT decomposes a signal into several components at different frequency levels [26]. These components include one low-frequency approximation component that shows the general trend of the signal and multiple high-frequency detail components related to noise and disturbance [30].
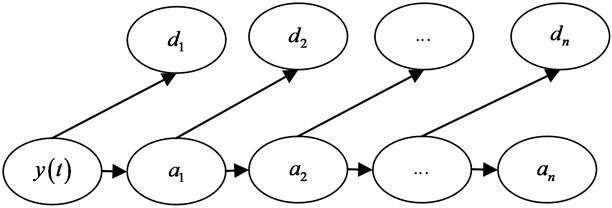
In order to make the general process of WT more intuitive, the n-level WT process of time series as shown in Fig. 3 is drawn, where the high-frequency component is no longer decomposed, and the low-frequency component is further subdivided. Therefore, -level WT of can be defined as:
where denotes the low-frequency approximate component, denote the high-frequency detail components.
Fig. 3Process of n-level decomposition by WT for yt
Compared with the original signal, these components have better local features. Therefore, the local features of original signal will be more prominent when these components have been further processed, which is conducive to the feature extraction of original signal. Meanwhile, it is worth noting that the selection of decomposition level and mother wavelet affects the performance of WT. Too few levels will make it impossible to obtain the components containing sufficient frequency features we need. Too many levels may lead to over-decomposition in the process, which make the information of signal will be lost. In addition, the external excitation frequency of Francis hydraulic turbine is mostly in medium and low frequency (within 100 Hz). Based on the abovementioned considerations and the characteristics of vibration signal of turbine bearing, a two-level WT with the Daubechies (db4) wavelet is applied for this study. It is worth noting that the Db4 wavelet can provide a balance between wavelength and smoothness [31].
Based on the abovementioned process, the more refined local feature components are provided for VMD, which are beneficial to the extraction of flow excitation feature from the vibration signal of turbine bearing.
3.3. Acquisition of feature IMFs by PSO-VMD
VMD is a non-recursive adaptive decomposition algorithm. It can decompose a real value signal into a set of IMFs that are defined as amplitude-modulated-frequency-modulated (AM-FM) signals [32]:
where represents the -th order mode and represents an instantaneous phase, which is a non-decreasing function, the envelopes .
In order to estimate the frequency bandwidth of , the specific steps are taken as follows. Firstly, the Hilbert transform is utilized to construct the analytic signal and calculate the single-sided spectrum. Secondly, the spectrum of each mode is transferred to the estimated baseband by multiplying . Finally, the bandwidth is estimated by demodulating the Gaussian smoothness of signal, which is the square root of the gradient of the norm. The resulting constrained variational problem is the following:
where is the vibration signal of the turbine bearing, denotes each mode, is the corresponding central frequencies, and * denote the Dirac distribution and the convolution operator, respectively.
Eq. (10) is solved by introducing the quadratic penalty term and Lagrange multiplier and then constructing the non-constraint optimization model as follows:
The alternate direction method of multipliers is applied to update the , , and , based on which the saddle point of Eq. (11) can be solved. The optimal solution expressed in the frequency domain is:
It can be seen from the above process that the parameters and have a considerable impact on the decomposition performance of VMD, and these parameters need to be set before signal decomposition. PSO, as an algorithm applied to optimize nonlinear and multidimensional problems, has good global search capabilities [33]. Therefore, the optimal parameters of VMD can be obtained by PSO. According to the principle of PSO, the selection of the fitness function is important. Entropy can well reflect the dynamic characteristics of vibration signal of turbine bearing. In the fuzzy entropy (FuzzyEn) theory, the fuzzy membership function is regarded as the threshold criterion of FuzzyEn, and the mean removal process is added into the process of time series reconstruction, which enhances the stability of statistical results and overcomes the deficiencies of sample entropy (SampEn) and approximate entropy (ApEn) [34]. Moreover, the FuzzyEn is better than SamEn and ApEn in terms of complexity evaluation [35]. Therefore, according to the purpose of this study, the minimum FuzzyEn is chosen as the fitness function of PSO. The FuzzyEn is defined as follows [36]:
among them:
where is the number of sampling points of time series, is the dimension of the vector constructed from the original time series, controls the gradient of membership function, denotes similar tolerance, denotes the similarity between the input vectors defined by the fuzzy membership function.
Accordingly, the minimum FuzzyEn is used as the fitness function of PSO, and the parameters and are used as the particle position, the PSO-VMD optimization model is constructed as:
where is the fitness function of PSO, FEn is the FuzzyEn of each IMF, the ranges of and are [1, 10] and [2000, 10000], respectively.
Fig. 4Flowchart of the proposed feature extraction method
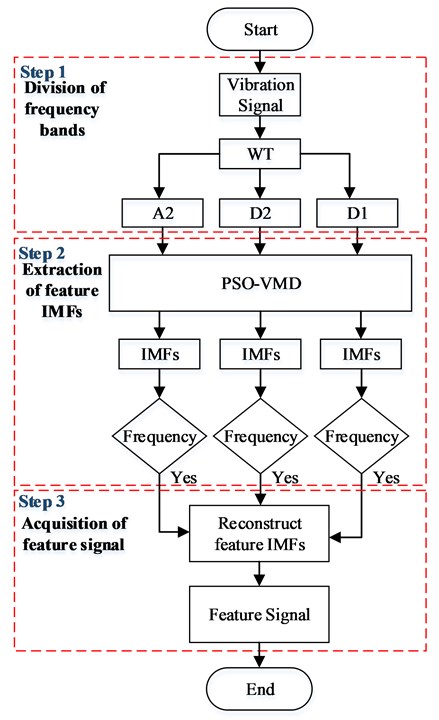
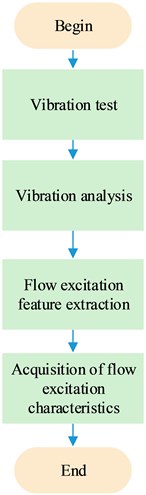
Fig. 5Flowchart of the on-line monitoring method
Based on Eq. (16), the optimal parameters of VMD for each component generated from WT can be obtained. Then, the components are decomposed by the VMD with optimized parameters. After that, the frequencies in the decomposed component are compared with the flow excitation frequencies. If the flow excitation frequencies are included, it is retained; if not, it is discarded. So the feature IMFs can be selected. Finally, the flow excitation feature signal can be obtained by reconstructing these feature IMFs. The flowchart of the proposed method is shown in Fig. 4.
According to the proposed feature extraction method, the steps of on- line monitoring method are shown in Fig. 5. Firstly, the real-time online data are collected by the sensors at measuring point of turbine bearing. Secondly, the flow excitation features are extracted by the proposed feature extraction method based on WT, PSO, and VMD. Finally, according to the flow excitation feature signal, the flow excitation characteristics are obtained.
4. Experimental verification
4.1. Vibration test
The vibration test is mainly carried out to obtain the vibration signal of turbine bearing. The installation site of these sensors is shown in Fig. 6. Three sensors are arranged at measuring point of turbine bearing. A key phase sensor is arranged in the direction of to determine the phase angle of vibration. Two displacement sensors are respectively arranged in the direction of and to determine vibration displacement. In Fig. 6, the upper left is the key phase sensor, and the lower left is one of the displacement sensor. The key phase sensor model is Rockwell Entek 2114 with a measuring range of 4 mm and the probe length of 40 mm; the displacement sensor model is Rockwell Entek 2108 with a measuring range of 2 mm and the probe length of 70 mm.
Fig. 6Installation site of sensors
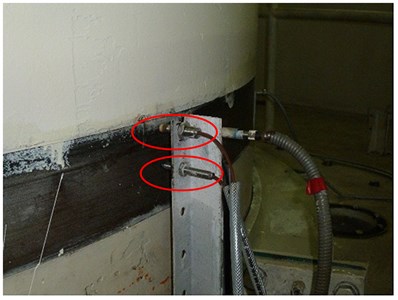
Fig. 7Block diagram of the measurement system.
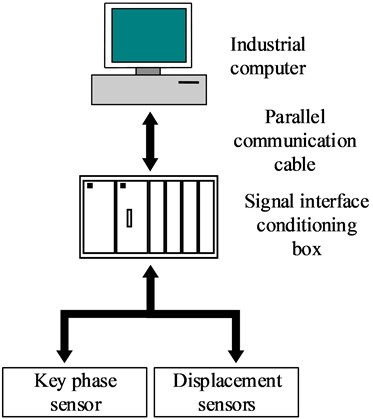
In order to collect and record the relevant data in time, the vibration test system is used to measure, transmit, and record the relevant data, as shown in Fig. 7. The test system used in this test is divided into three parts: measuring points (sensors), signal transmission, signal recording and processing. The system consists of IBM server, Hewlett-Packard color laser printer, optical cable melting box, switch, photoelectric converter, shared device, and forward isolation device. The system can obtain the relevant data of each sensor in real time. The system is equipped with a special interface, which can export the relevant data within the set time period for data analysis. The analog signals collected by the sensors are converted into digital signals through the signal conditioner and analog-to-digital converter (ADC), which are further transmitted to the industrial computer. By processing these data, the vibration signal of turbine bearing can be obtained.
4.2. Vibration analysis
In practice, the Francis hydraulic turbine generally operates outside the best efficiency point [37]. Considering the flow excitation characteristic under partial load condition is more complex, so the vibration data collected under partial load condition are selected for analysis. Meanwhile, the parameters of the Francis hydraulic turbine are also used to calculate the flow excitation characteristics. The main operation parameters of the Francis hydraulic turbine are as follows: rated speed 107.14 r.min-1, rated water head 140 m, rated flow rate 554.52 m3.s-1, rated load 700 MW, quality of the rotor 259000 kg, maximum outer diameter of runner 5051.8 mm, the number of runner blades 13, the number of guide vanes 26, thickness of blade outlet edge 0.06 m, the water outlet velocity 14.4 m.s-1, Strouhal numbers 0.25, influence coefficient of tail shape of the runner blades 2.4. Based on the above simulation parameters and Eq. (2), Eq. (3), and Eq. (4), the frequencies of flow excitation are calculated, as shown in Table 1.
Table 1Frequencies of flow excitation
Flow excitation | Frequency |
60 Hz | |
0.55 Hz | |
23 Hz and 46 Hz |
It can be seen from Table 1 that the flow excitation frequencies are basically below 100 Hz, so only the first three order natural frequencies are calculated here, as shown in Table 2.
Table 2First three order natural frequencies
Order | 1 | 2 | 3 |
Natural frequency | 31 Hz | 46 Hz | 69 Hz |
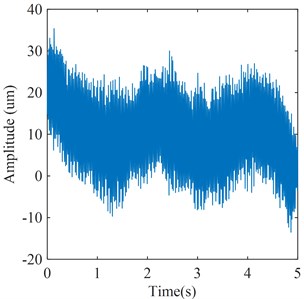
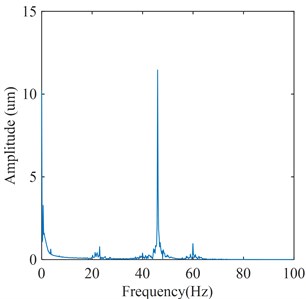
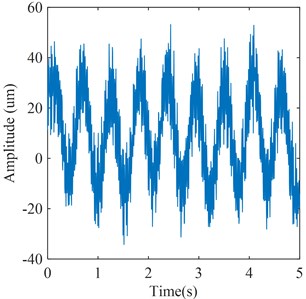
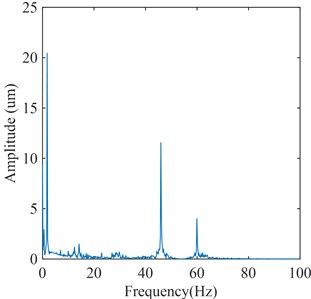
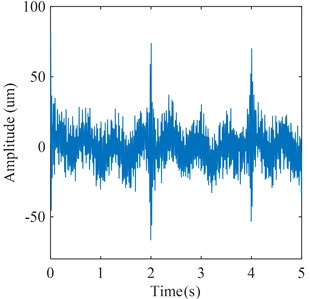
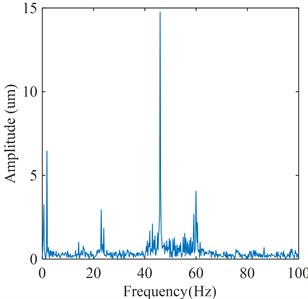
Fig. 8Vibration signal of the turbine bearing
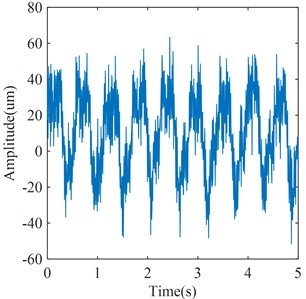
a) time domain waveform
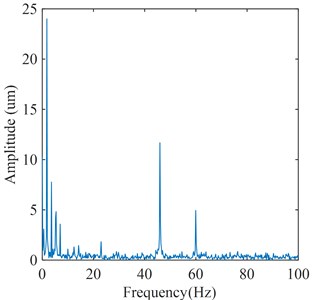
b) frequency spectrum
The vibration signal of turbine bearing collected under the partial load condition is shown in Fig. 8. It is observed from Fig. 8 that the frequency components mainly include: the frequency of the pressure pulsation caused by the vortex rope in the draft tube which is 0.55 Hz, the rotating frequency of the runner which is 1.78 Hz, the frequencies which are the multiples of rotating frequency, the frequencies of the pressure pulsation caused by RSI which are 22.98 Hz and 45.95 Hz, and the frequency of the pressure pulsation caused by Karman vortex which is 60 Hz. It can be observed that these frequency components are basically consistent with the theoretically calculated flow excitation frequencies. Therefore, it can be seen that the vibration signal of turbine bearing contains abundant information about flow excitation, which further illustrates that it is feasible to extract the flow excitation feature in Francis hydraulic turbine from the vibration signal of turbine bearing.
4.3. Flow excitation feature extraction
In order to extract the flow excitation features in Francis hydraulic turbine, the feature excitation method proposed in this paper is used to extract the feature information that can reflect the flow excitation characteristics in the turbine from the vibration signal of turbine bearing shown in Fig. 8.
Fig. 9Results of WT
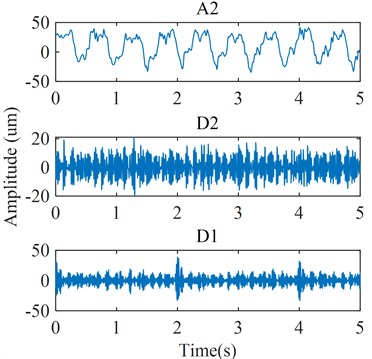
a) Time domain waveform
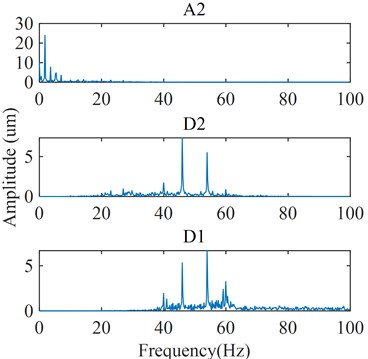
b) Frequency spectrum
According to the steps of proposed feature excitation method, the vibration signal is firstly subjected to a two-level WT, as shown in Fig. 9. It is observed that the original signal is decomposed into three signal components in different frequency bands after the two-level WT. The time domain features of these signal components are shown in Fig. 9(a), corresponding to A2, D2, and D1, respectively. Moreover, the frequency domain features of these signal components are shown in Fig. 9(b), corresponding to A2 (0-25 Hz), D2 (25-50 Hz), and D1 (50-100 Hz), respectively. According to the principle of WT shown in section 4.1, there will be noise and interference in each signal component (especially D1 and D2), which are unavoidable. So the noise and disturbance are considered in the subsequent processing. Based on the above decomposition, the parameters of VMD are optimized by PSO for each signal component. The parameters settings of PSO-VMD are shown in the Table 3, where is the particle number, is the iteration number, and are the learning factors, is the weight of inertia [28].
Table 3Parameters of PSO-VMD
20 | 10 | 1.5 | 1.5 | 0.5 | [1, 10] | [2000, 10000] |
After 20 independent operations, the optimal result of PSO-VMD is selected and the fitness curves are shown in Fig. 10, corresponding to the A2, D2, and D1 components. It is observed that the minimum values of FuzzyEn appear when the number of iterations is 6, and the corresponding optimal parameters combination [, ] are [5, 8499], [5, 2078], and [2, 9977], respectively. Then, based on these optimal parameters, each component is decomposed by VMD. In Section 5.2, the flow excitation characteristics have been calculated. And it is worth noting that the purpose of this study is to extract the flow excitation components from the vibration signal of turbine bearing. Therefore, the feature IMFs are selected out by comparing the frequency components of IMFs with the frequencies of flow excitation.
The optimal parameters and of VMD for the A2 component are 5 and 8499. The spectrums of each IMF for the A2 component are shown in Fig. 11. It can be seen from Fig. 11 that the main frequency component in IMF1 is the frequency of the pressure pulsation caused by the vortex rope in the draft tube, which is 0.55 Hz. Also, the main frequency components in IMF2, IMF3, and IMF4 are the rotating frequency of runner and its multiplier components. The main frequency component in IMF5 is the high-frequency residual noise after WT. So the IMF1 is extracted as a feature IMF.
Fig. 10Adaptation curves of each component
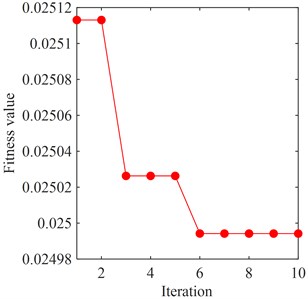
a) A2 component
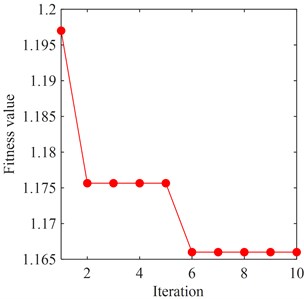
b) D2 component
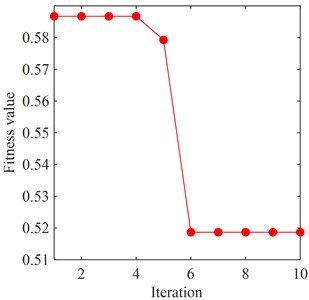
c) D1 component
The optimal parameters K and of VMD for the D2 component are 5 and 2078. The spectrums of each IMF for the D2 component are shown in Fig. 12. It is observed that the peaks in the spectrum of IMF1 and IMF3 appear at the frequencies of the pressure pulsation caused by RSI, which are 22.98 Hz and 45.95 Hz. Also, the peak in the spectrum of IMF4 appears at the frequency of the pressure pulsation caused by Karman vortex, which is 60 Hz. IMF2 and IMF5 are irrelevant frequency components. Therefore, the IMF1, IMF3, and IMF5 are considered as feature IMFs.
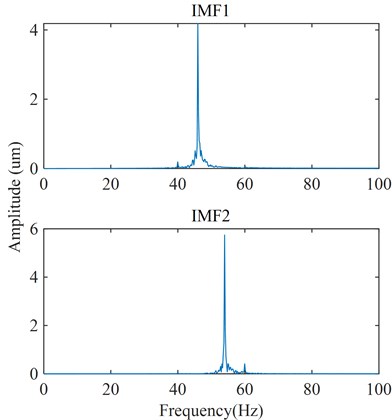
The optimal parameters K and of VMD for the D1 component are 2 and 9977. The spectrums of each IMF for the D1 component are shown in Fig. 13. It can be seen that the frequency component of IMF1 is mainly the frequency of the pressure pulsation caused by RSI, which is 45.95 Hz. Also, IMF2 is the irrelevant frequency component. Therefore, the IMF1 is extracted as a feature IMF.
Based on the abovementioned feature extraction process, the flow excitation components in vibration signal of turbine bearing are obtained by reconstructing these feature IMFs. The obtained flow excitation feature signal of turbine bearing is shown in Fig. 14. Through the above feature extraction process, it can be seen that the proposed method can effectively separate the frequency components in the vibration signals of the guide bearing and extract the required flow excitation components. Meanwhile, the above results also verify that the proposed on-line monitoring method for flow excitation is feasible.
Fig. 11Frequency spectrum of each order component in the A2 component obtained by VMD
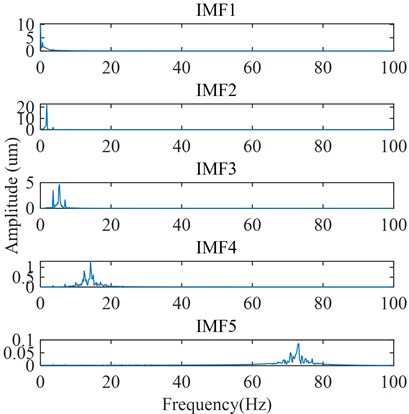
Fig. 12Frequency spectrum of each order component in the D2 component obtained by VMD
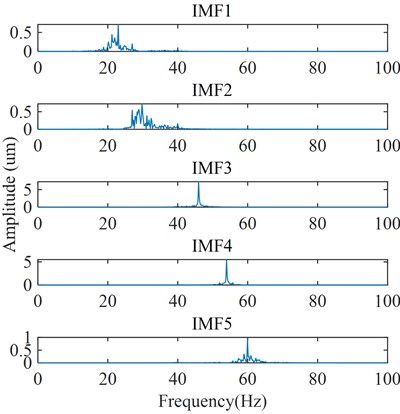
Fig. 13Frequency spectrum of each order component in the D1 component obtained by VMD
The flow excitation feature signals extracted by WT-VMD and PSO-VMD are as shown in Fig. 15 and Fig. 16 respectively. In WT-VMD, WT is used to provide more refined frequency band for VMD. In PSO-VMD, PSO is used to optimize the parameters of VMD. Both methods improve the performance of VMD. It can be seen from Fig. 15 that although part of the flow excitation components can be extracted by WT-VMD, the rotating frequency and low-frequency flow excitation cannot be separated. In addition, the 23Hz flow excitation component is almost covered by noise. It can be seen from Fig. 16 that although the flow excitation components can be extracted by PSO-VMD, the rotating frequency and low-frequency flow excitation cannot be separated, and there is much noise in the signal.
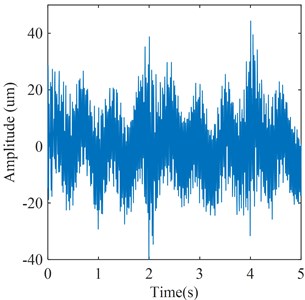
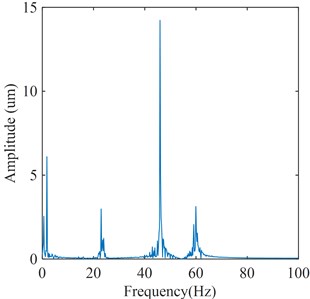
Fig. 14Flow excitation feature signal of turbine bearing by the proposed method
a) Time domain waveform
b) Frequency spectrum
Fig. 15Flow excitation feature signal extracted by WT-VMD
a) Time domain waveform
b) Frequency spectrum
Fig. 16Flow excitation feature signal extracted by PSO-VMD
a) Time domain waveform;
b) Frequency spectrum
Further, according to the signals shown in Figs. 14, 15, and 16, the energy of each signal and the energy at the flow excitation frequencies can be calculated respectively. According to Fig. 14, the energy of signal is 2.0419×10⁵ um2 and the energy at the flow excitation frequencies is 1.222×10⁵ um2. According to Fig. 15, the energy of signal is 4.5124×10⁵ um2 and the energy at the flow excitation frequencies is 1.169×10⁵ um2. According to Fig. 16, the energy of signal is 4.3983×10⁵ um2 and the energy at the flow excitation frequencies is 1.087×10⁵ um2. The energy percentages of flow excitation in each signal can be obtained by calculating the ratio of the energy at the flow excitation frequencies in each signal to the overall energy of signal, as shown in Table 4. It can be seen that the energy percentages of flow excitation features in the signal extracted by the proposed method are the largest.
Table 4Energy percentages of flow excitation features in the signal by different methods
Signals | Energy percentages of flow excitation features |
Extracted by the method proposed in this study | 59.83 % |
Extracted by PSO-VMD | 25.91 % |
Extracted by WT-VMD | 24.71 % |
Initial signal | 19.22 % |
Compared with the abovementioned signal processing methods, the method proposed in this paper provides better components of frequency features through frequency band segmentation in the process of feature extraction from vibration signal of turbine bearing. On this basis, through the optimization of VMD parameters, its decomposition performance is improved, and the optimal decomposition level is provided for each component. It can also effectively separate low-frequency components with similar frequencies, and finally effectively extract the flow excitation components in each frequency range. Therefore, this method is an effective method for extracting the flow excitation features from the vibration signal of turbine bearing.
4.4. Comparative test
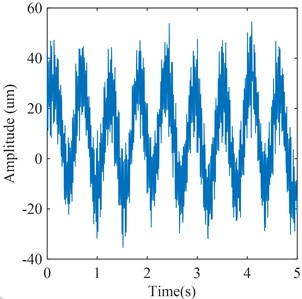
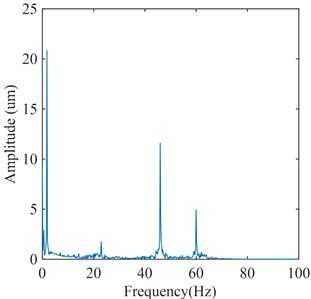
Flow excitation in Francis hydraulic turbine acts directly on the runner blades, so the vibration signal of the runner blades can best reflect the flow excitation characteristics [5, 14]. Therefore, the vibration signals of blade collected in the test are taken as the standard to verify the accuracy of the extracted signal. In this comparative test, the strain gauges are arranged on the blades, the signals are received by wireless devices, and the valid data collected under partial load conditions are selected for analysis, as shown in Fig. 17.
Fig. 17Vibration signal of blade
a) Time domain waveform
b) Frequency spectrum
Similarly, the flow excitation feature signal of runner blades is also acquired by the proposed feature extraction method, which is shown in Fig. 18. By comparing Fig. 14 with Fig. 18, it can be seen that the frequency components of flow excitation in these two feature signals are basically the same. These frequency components are the frequency of the pressure pulsation caused by the vortex rope in the draft tube, the frequency of the pressure pulsation caused by RSI, and the frequency of the pressure pulsation caused by Karman vortex, respectively. Moreover, it is worth noting that the frequency of the pressure pulsation caused by RSI has the highest amplitude. Therefore, it can be shown that the extracted flow excitation feature signal in this study can reflect the flow excitation feature in Francis hydraulic turbine.
Fig. 18Flow excitation feature signal of blade
a) Time domain waveform
b) Frequency spectrum
In order to evaluate the error between the method proposed in this paper and the actual measurement, the error terms, including the maximum positive and negative errors, mean absolute percentage error (MAPE), coefficient of determination, and root mean square error (RMSE) are calculated, as shown in Table 5.
Table 5Results of error terms
Error terms | Value |
Maximum positive error | 0.783 |
Maximum negative error | –3.04 |
MAPE | 18.11 % |
Coefficient of determination | 0.886 |
RMSE | 1.329 |
As can be seen from Table 5, all the error terms are within a reasonable range. Therefore, the method proposed in this study for monitoring the flow excitation in Francis hydraulic turbine through the vibration signal of the turbine bearing is feasible and effective.
Although the flow excitation feature signal can be extracted effectively from the vibration signal of runner blades and the vibration signal of turbine bearing, the strain gauge may be washed out during the test process of blade, which affects the data reliability. Moreover, compared with the vibration test of turbine bearing, the arrangement process of blades vibration test is more complicated. Therefore, it is a practical and effective on-line monitoring method for the flow excitation in Francis hydraulic turbine by measuring the vibration signal of turbine bearing and extracting the key information about the flow excitation.
5. Conclusion
The Francis hydraulic turbine is taken as the research object in this paper. Firstly, the dynamic equation of Francis hydraulic turbine is established by using the finite element method, and the internal relationships between the dynamic response of turbine bearing and the flow excitation in the Francis hydraulic turbine are clarified. Secondly, according to these relationships, a feature extraction method based on WT, PSO, and VMD is proposed. Then, based on this feature extraction method, an on-line monitoring method for the flow excitation in Francis hydraulic turbine is proposed. The results show that the proposed feature extraction method can effectively extract the required flow excitation components under the interference of noise and other frequency components. Moreover, the energy percentages of flow excitation features in the signal extracted by this method is more than twice that of the previous methods, which shows that this method is superior to the previous methods to a certain extent. On this basis, the on-line monitoring method proposed in this paper has also been proved to be feasible. The research results of this paper lay a foundation for the effective control of flow excitation in hydraulic turbine.
References
-
H. Cheng et al., “A method of evaluating the vortex rope strength in draft tube of Francis turbine,” Renewable Energy, Vol. 152, pp. 770–780, Jun. 2020, https://doi.org/10.1016/j.renene.2020.01.020
-
R. Goyal and B. K. Gandhi, “Review of hydrodynamics instabilities in Francis turbine during off-design and transient operations,” Renewable Energy, Vol. 116, pp. 697–709, Feb. 2018, https://doi.org/10.1016/j.renene.2017.10.012
-
A. Shishegaran, M. Shokrollahi, A. Mirnorollahi, A. Shishegaran, and M. Mohammad Khani, “A novel ensemble model for predicting the performance of a novel vertical slot fishway,” Frontiers of Structural and Civil Engineering, Vol. 14, No. 6, pp. 1418–1444, Dec. 2020, https://doi.org/10.1007/s11709-020-0664-x
-
A. Bigdeli, A. Shishegaran, M. A. Naghsh, B. Karami, A. Shishegaran, and G. Alizadeh, “Surrogate models for the prediction of damage in reinforced concrete tunnels under internal water pressure,” Journal of Zhejiang University-SCIENCE A, Vol. 22, No. 8, pp. 632–656, Aug. 2021, https://doi.org/10.1631/jzus.a2000290
-
Z. Li, X. Heng, T. Li, Y. Wang, and H. Wang, “Dynamic equation and response of turbine runner blade under flow excitation,” Advances in Mechanical Engineering, Vol. 10, No. 4, p. 168781401877050, Apr. 2018, https://doi.org/10.1177/1687814018770509
-
P. Pennacchi, S. Chatterton, and A. Vania, “Modeling of the dynamic response of a Francis turbine,” Mechanical Systems and Signal Processing, Vol. 29, pp. 107–119, May 2012, https://doi.org/10.1016/j.ymssp.2011.05.012
-
A. Minakov, A. Sentyabov, and D. Platonov, “Numerical investigation of flow structure and pressure pulsation in the Francis-99 turbine during startup,” in Journal of Physics: Conference Series, Vol. 782, No. 1, p. 012004, Jan. 2017, https://doi.org/10.1088/1742-6596/782/1/012004
-
Z. Xiaoran et al., “Numerical analysis of non-axisymmetric flow characteristic for a pump-turbine impeller at pump off-design condition,” Renewable Energy, Vol. 115, pp. 1075–1085, Jan. 2018, https://doi.org/10.1016/j.renene.2017.06.088
-
L. Zhu et al., “Pressure fluctuation test and vortex observation in Francis turbines draft tube,” in IOP Conference Series: Earth and Environmental Science, Vol. 240, No. 2, p. 022029, Mar. 2019, https://doi.org/10.1088/1755-1315/240/2/022029
-
X.-D. Lai, Q.-W. Liang, D.-X. Ye, X.-M. Chen, and M.-M. Xia, “Experimental investigation of flows inside draft tube of a high-head pump-turbine,” Renewable Energy, Vol. 133, pp. 731–742, Apr. 2019, https://doi.org/10.1016/j.renene.2018.10.058
-
W.-T. Su, M. Binama, Y. Li, and Y. Zhao, “Study on the method of reducing the pressure fluctuation of hydraulic turbine by optimizing the draft tube pressure distribution,” Renewable Energy, Vol. 162, pp. 550–560, Dec. 2020, https://doi.org/10.1016/j.renene.2020.08.057
-
A. Favrel, J. Gomes Pereira Junior, A. Müller, C. Landry, K. Yamamoto, and F. Avellan, “Swirl number based transposition of flow-induced mechanical stresses from reduced scale to full-size Francis turbine runners,” Journal of Fluids and Structures, Vol. 94, p. 102956, Apr. 2020, https://doi.org/10.1016/j.jfluidstructs.2020.102956
-
Y. Zhang, X. Zheng, J. Li, and X. Du, “Experimental study on the vibrational performance and its physical origins of a prototype reversible pump turbine in the pumped hydro energy storage power station,” Renewable Energy, Vol. 130, pp. 667–676, Jan. 2019, https://doi.org/10.1016/j.renene.2018.06.057
-
D. Liu, X. Deng, Y. Zhao, C. Duan, and S. Yan, “Dynamic stress and pressure pulsation test on model unit of huge Francis turbine,” (in Chinese), Journal of Mechanical Engineering, Vol. 55, No. 19, pp. 9–18, 2019.
-
J. Dang, Y. He, R. Jia, K. Dong, and Y. Xie, “Detection and fault diagnosis of non-stationary vibration signal of hydro generator unit,” (in Chinese), Journal of Hydraulic Engineering, Vol. 47, No. 2, pp. 173–179, 2016.
-
Z. Li, X. Mao, F. Liu, Y. Huang, and X. Heng, “A Comprehensive Reliability Evaluation Model of Turbine Runner Blades under Complex Conditions,” Journal of Failure Analysis and Prevention, Vol. 20, No. 6, pp. 2097–2105, Dec. 2020, https://doi.org/10.1007/s11668-020-01024-3
-
S. Wang, “Dynamic characteristics analysis and comprehensive optimization design of Francis turbine runner,” (in Chinese), Zhengzhou Institute of Mechanical Science, 2003.
-
Peter K. Doerfler, “Observation of pressure pulsations at high partial load on a Francis model turbine with high specific speed,” in IAHR WG Oscillatory Behavur of Hydraulic Machinery, 6th meeting, Vol. 1, pp. 21–26, Jan. 1993.
-
H. Tanaka, “Vibration Behavior and Dynamic stress of runners of very high head reversible pump-turbines,” International Journal of Fluid Machinery and Systems, Vol. 4, No. 2, pp. 289–306, Jun. 2011, https://doi.org/10.5293/ijfms.2011.4.2.289
-
C. Nicolet, “Hydroacoustic Modelling and numerical simulation of unsteady operation of hydroelectric systems,” Lausanne, EPFL, 2007, https://doi.org/10.5075/epfl-thesis-3751
-
Z. J. Li, Y. L. Zhang, and X. J. Yang, “Dynamic response of a main shaft system of francis turbine-generator units,” Advanced Materials Research, Vol. 842, pp. 581–585, Nov. 2013, https://doi.org/10.4028/www.scientific.net/amr.842.581
-
H. Shi, “Mechanical Vibration System,” Huazhong University of Technology Press, 1992.
-
F. Ma, R. Jia, H. Wu, K. Dong, and J. Dang, “Application of empirical mode decomposition based on complex data to fault diagnosis of hydraulic turbines,” (in Chinese), Journal of Hydroelectric Engineering, Vol. 36, No. 2, pp. 75–82, 2017.
-
H. Liu, D. Li, Y. Yuan, S. Zhang, H. Zhao, and W. Deng, “Fault diagnosis for a bearing rolling element using improved VMD and HT,” Applied Sciences, Vol. 9, No. 7, p. 1439, Apr. 2019, https://doi.org/10.3390/app9071439
-
X. Zhao, P. Wu, and X. Yin, “A quadratic penalty item optimal variational mode decomposition method based on single-objective Salp swarm algorithm,” Mechanical Systems and Signal Processing, Vol. 138, p. 106567, Apr. 2020, https://doi.org/10.1016/j.ymssp.2019.106567
-
D. Wang, Y. Liu, H. Luo, C. Yue, and S. Cheng, “Day-ahead PM2.5 concentration forecasting using WT-VMD based decomposition method and back propagation neural network improved by differential evolution,” International Journal of Environmental Research and Public Health, Vol. 14, No. 7, p. 764, Jul. 2017, https://doi.org/10.3390/ijerph14070764
-
A. Upadhyay and R. B. Pachori, “Speech enhancement based on mEMD-VMD method,” Electronics Letters, Vol. 53, No. 7, pp. 502–504, 2017, https://doi.org/10.1049/el.2016.443
-
F. Zhou, X. Yang, J. Shen, and W. Liu, “Fault diagnosis of hydraulic pumps using PSO-VMD and refined composite multiscale fluctuation dispersion entropy,” Shock and Vibration, Vol. 2020, pp. 1–13, Aug. 2020, https://doi.org/10.1155/2020/8840676
-
M. Ding, Z. Shi, B. Du, H. Wang, and L. Han, “A signal de-noising method for a MEMS gyroscope based on improved VMD-WTD,” Measurement Science and Technology, Vol. 32, No. 9, p. 095112, Sep. 2021, https://doi.org/10.1088/1361-6501/abfe33
-
A. Tascikaraoglu, B. M. Sanandaji, K. Poolla, and P. Varaiya, “Exploiting sparsity of interconnections in spatio-temporal wind speed forecasting using Wavelet Transform,” Applied Energy, Vol. 165, pp. 735–747, Mar. 2016, https://doi.org/10.1016/j.apenergy.2015.12.082
-
N. Amjady and F. Keynia, “Short-term load forecasting of power systems by combination of wavelet transform and neuro-evolutionary algorithm,” Energy, Vol. 34, No. 1, pp. 46–57, Jan. 2009, https://doi.org/10.1016/j.energy.2008.09.020
-
K. Dragomiretskiy and D. Zosso, “Variational mode decomposition,” IEEE Transactions on Signal Processing, Vol. 62, No. 3, pp. 531–544, Feb. 2014, https://doi.org/10.1109/tsp.2013.2288675
-
R. Poli, J. Kennedy, and T. Blackwell, “Particle swarm optimization,” Swarm Intelligence, Vol. 1, No. 1, pp. 33–57, Oct. 2007, https://doi.org/10.1007/s11721-007-0002-0
-
C. Liu et al., “Analysis of heart rate variability using fuzzy measure entropy,” Computers in Biology and Medicine, Vol. 43, No. 2, pp. 100–108, Feb. 2013, https://doi.org/10.1016/j.compbiomed.2012.11.005
-
H.-B. Xie, W.-T. Chen, W.-X. He, and H. Liu, “Complexity analysis of the biomedical signal using fuzzy entropy measurement,” Applied Soft Computing, Vol. 11, No. 2, pp. 2871–2879, Mar. 2011, https://doi.org/10.1016/j.asoc.2010.11.020
-
W. Chen, Z. Wang, H. Xie, and W. Yu, “Characterization of surface EMG signal based on fuzzy entropy,” IEEE Transactions on Neural Systems and Rehabilitation Engineering, Vol. 15, No. 2, pp. 266–272, Jun. 2007, https://doi.org/10.1109/tnsre.2007.897025
-
A. Presas, D. Valentin, E. Egusquiza, and C. Valero, “Detection and analysis of part load and full load instabilities in a real Francis turbine prototype,” in Journal of Physics: Conference Series, Vol. 813, No. 1, p. 012038, Apr. 2017, https://doi.org/10.1088/1742-6596/813/1/012038
About this article

This research was supported by the National Natural Science Foundation of China (Grant No. 51465001). The supports are gratefully acknowledged.
