Abstract
This paper proposes a novel fault feature extraction method with the aim of extracting the fault feature submerged in the single-channel observation signal. The proposed method integrates the strengths of the constrained independent component analysis (cICA) extracting only the signals of interest (SOIs) with the advantage of ensemble empirical mode decomposition (EEMD) alleviating the mode mixing. The method, which is named EEMD-based cICA, not only enables gear fault feature extraction but also offers a new independent component analysis (ICA) mixing model with source noise and measured noise for the single-channel observation signal. The efficiency of the proposed method is tested on simulated as well as real-world vibration signals acquired from a multi-stage gearbox with a missing tooth and a chipped tooth, respectively.
1. Introduction
In general, the goal of independent component analysis (ICA) [1-4] is to recover all the source signals from mixed signals at a time. ICA is one of the outstanding techniques for solving the signal blind source separation (BSS) problem, which has been widely applied to the source signals separation and feature extraction [3, 4] in the applications of biomedical engineering, telecommunications, mechanical engineering and audio. However, there are many problems to be solved for ICA applications: (1) classical ICA algorithm has some ambiguities, such as unknown number of source signals, undetermined the variance (energies) and the order of the independent components (ICs); (2) ICA model does not consider the source noise and measured noise simultaneously [3]; (3) It is desired to extract only the signals of interest (SOIs). (4) The difficulty of the single-channel observation signal signature extraction based on ICA, it belongs to the extreme case of the underdetermined BBS problem [4]. Therefore, it would be important to develop approaches to extract only the desired signal with given signature instead of all source signals from the single-channel observation signal.
ICA algorithm as the most important blind signal extraction (BSE) method has been used to extract the ICs, whose number is the same as the measured signals, but the SOIs are unknown. Hiroshi et al. [5] proposed time-frequency based ICA method to extract SOIs, but it needs some source signals to have dominant powers. W. Lu and J.C. Rajapakse [6, 7] proposed the constrained ICA (cICA) or ICA with reference (ICA-R) algorithms by incorporating a prior information into the conventional ICA algorithm, which means that only a single statistical IC will be extracted from the mixed signals, but it does not specifically discuss how to generate a reference signal. Zhi-Lin Zhang [8] developed a morphological cICA algorithm to extract weak temporally correlated signals from a pregnant woman ECG data, this method used second-order statistics based approach to design the suitable reference signal. Zhan-Li Sun et al. [9] proposed an improved cICA by using the reference based unmixing matrix initialization, which overcame the unstable problem encountered in cICA algorithm. Changli Li et al. [10] proposed an improved ICA-R algorithm for the non-invasive extraction of the fetal ECG (FECG), which alternately maximizes the negentropy contrast function for FastICA and the closeness measure function in ICA-R. Xiang Wang et al. [11] extended the conventional cICA framework to the case of complex-valued mixing model and presented different prior information, the method is named as ICA with cyclostationary constraint (ICA-CC) and ICA with spatial constraint (ICA-SC). Zhiyang Wang et al. [12, 13] introduced cICA into the machine fault diagnosis, and attained some successful applications.
In practice, for most of the ICA-based methods, it should not be applied to the underdetermined BSS cases, in which the number of sensors is less than the source signals [4]. Especially in the extreme underdetermined BBS case, that is to say, single-channel observation signal separation, the number of sensor is only one. This is a very undesirable requirement for real-world applications because the number of active source signals is unknown in advance in most practical situations. In this case, single-channel observation signal mixing matrix is not invertible, and the traditional ICA or cICA methods fail to recover all sources, which also leads to the result that the desired signal cannot be extracted directly from the single-channel observation signal. Therefore, single-channel observation signal needs to be separated into several statistically independent components by using some approaches. Among these approaches, wavelet transform (WT) [14, 15] and empirical mode decomposition (EMD) [16, 17] are most usually employed to play the role of decomposing signal into various time scales. D.S Lee et al. [18] presented WT and PCA-based monitoring methods and illustrated its great potential in monitoring multiscale and multivariate processes. Wu, et al. [19, 20] combined continue WT with ICA to accomplish the early fault diagnosis of bearing. But WT requires choosing wavelet basis and decomposing layers, which makes it a non-self-adaptive signal processing method in nature. Empirical mode decomposition (EMD) algorithm [16, 17] can self-adaptively decompose any complex signal into a set of intrinsic mode functions (IMFs) according to the analyzed signal itself characteristic, and each IMF denotes a simple oscillatory mode in nature with different frequency component imbedded in the original signal. B. Mijovic et al. [21, 22] proposed a new method of sources separation from single-channel signal based on EMD and ICA. Q. Miao et al. [23] used EMD-based ICA method to extract the bearing fault feature. But EMD still has some disadvantages, such as end effects and modes mixing. Wu and Huang [24] developed and improved the EMD algorithm substantially, and proposed the ensemble empirical mode decomposition (EEMD) algorithm, which effectively alleviates the mode mixing of EMD algorithm. M. Žvokelj et al. [25] developed a method of multivariate and multiscale monitoring of bearings using EEMD and PCA, and then proposed an approach of non-linear multivariate and multiscale monitoring and signal denoising strategy using EEMD and KPCA [26]. Wang et al. [27] integrated EEMD and ICA to diagnosis wind turbine gearbox. After several years, Žvokelj et al. [28] again developed an EEMD-based multiscale ICA method to diagnosis the slewing bearing fault.
So far, the method of cICA combined with EEMD is seldom used to mechanical signals processing. Therefore, a so-called EEMD-based cICA method is proposed and applied to the BSE of single-channel observation signal. The validity and practicability of this proposed method are verified through simulation and experiments of gear fault characteristics extraction with a missing tooth and a chipped tooth, respectively.
This paper is organized as follows: Section 2 introduces the ICA model and the mixing model of the single-channel observation signal with source noise and measured noise. The single-channel signal separation and fault feature extraction method of EEMD-based cICA are elucidated in Section 3. Then, simulation and experiments are demonstrated in Section 4 and Section 5, respectively. Finally, Section 6 provides a conclusion.
2. Mixing model of single-channel measured signal based on ICA
2.1. Independent component analysis
In essence, ICA algorithm [1-4] assumes a set of observable measured signals to be a linear combination of unknown and statistically independent sources . The time series usually have unit variance and uncorrelation by using a linear “whitening” transform. Then ICA mixing model can be expressed as:
where is the mixing matrix, usually .
ICA algorithm must find a separating or de-mixing matrix such that:
where is an approximate estimation of source signals .
2.2. Mixing model of single-channel measured signal
In Eq. (1), if the row number of the mixing matrix is equal to 1, i.e 1, then the classical ICA mixing model is rewritten as:
where is an unknown non-singular linear mixing vector, .
Consider the additional source noise and measured noise, and rewrite the Eq. (3) as:
where and represent the source noise and measured noise, respectively.
Eq. (4) shows the noisy ICA mixing model of the single-channel observation signal . It belongs to the extreme case of the underdetermined BBS problem, and cannot be solved directly. For this reason, we developed an EEMD-based cICA method to separate fault signal from the single-channel observation signal .
3. Single-channel signal separation and fault feature extraction
3.1. Ensemble empirical mode decomposition
3.1.1. Empirical mode decomposition
Empirical mode decomposition (EMD) was pioneered by Huang et al. [16] in 1998. EMD has the ability of nonlinear multi-resolution self-adaptive signal processing, and is very applicable to processing the nonstationary data. A complicated signal can be decomposed into the sum of IMF components and a residue by EMD method:
3.1.2. EEMD algorithm
EMD method has been successfully applied to mechanical signal processing [17]. Nevertheless, EMD cannot extract mechanical fault feature accurately because of the mode mixing phenomenon, which can make physical meanings unclear. To alleviate this drawback, Wu and Huang [24] developed and improved the EMD algorithm substantially, and proposed the ensemble empirical mode decomposition (EEMD) algorithm. Y. H. Wang et al. discussed the computational complexity of EMD/EEMD algorithms [29]. The decomposition procedures of EEMD are expressed briefly as follows:
1. Add a differently generated white noise with a different magnitude to the original signal each time to generate a new signal:
2. Decompose the newly generated signal into IMFs using the EMD method:
where , and represent the th IMF, the residue and the IMFs’ number during the th trial, respectively.
3. Calculate the ensemble means of the corresponding IMFs of times decompositions, and take it as the final result:
4. Finally, the original signal is formed as follows:
3.1.3. Criterions of IMF selection
EEMD method can effectively alleviate the mode aliasing, but it will produce false components during its decomposition procedures. Therefore, we propose the following criterions of IMFs selection in order to eliminate the influence of false IMFs.
3.1.3.1. Correlation coefficient-based
The correlation coefficient between IMF and original signal is as follows:
When IMF includes some fault characteristics, the correlation coefficient between the IMF and the original signal is relatively larger, on the contrary, it is much smaller.
3.1.3.2. Kurtosis-based
However, when the signal-to-noise ratio (SNR) of the observation signal is extremely low, that is to say, the concealed fault information is very weak. In this case, even if the IMF includes effective fault information, the correlation coefficient between the corresponding IMF and the original signal could be also very small. Therefore, we must introduce another criterion of IMF section, i.e. kurtosis-based combined with the correlation coefficient-based criterion. The kurtosis of the IMF is expressed as:
In Eqs. (10-11), and are zero-mean, i.e. 0, denotes the standard deviation, and is the data length.
Usually, the larger the kurtosis value of the IMF, the more prominent the effective fault information of the corresponding IMF.
3.2. cICA principle
Constrained independent component analysis (cICA) [6, 7] method is derived from independent component analysis (ICA) algorithm. By incorporating an interesting priori information into the traditional ICA algorithm, cICA algorithm forms a constraint optimization problem, and ensures that the ICA model output is a necessarily desired independent component (IC), which is closest to a corresponding reference signal [12]. The reference signal with interesting fault feature denotes the inequality constrained condition but need not be a perfect match with the desired IC. We take as the closeness measure norm between the IC and the corresponding reference signal . Note that the desired IC, which is extracted from the new observation signal vector , is the one and only the one closest to the corresponding constructed reference signal , which is satisfied the following the inequality relationship:
where is the optimum de-mixing vector corresponding to the desired output IC, and , are any other local optimal solutions corresponding to the undesired output ICs. Thus, an inequality constraint, only when the optimum equation is satisfied, is expressed as follows:
where is a threshold parameter, the closeness measure norm is usually expressed by .
The model of cICA framework [5, 6] as a constrained optimization problem is defined as:
where denotes the negentropy function, is an any non-quadratic function, is a positive constant, is a Gaussian variable with zero-mean and unit variance, is the closeness constraint described in Eq. (13), and the equality constraints ensure that the output and the reference signal have unit-variance.
The model of cICA algorithm is efficiently solved by the use of an augmented Lagrangian function [7]. At the same time, we use the signal-to-interference ratio (SIR) index [12] to evaluate the extraction quality of the cICA algorithm. The larger the SIR, the better the extraction effect of cICA algorithm. More details about the model of cICA framework are expressed as a constrained optimization problem in Refs. [6-13].
3.3. Constructing reference signal for cICA in gearbox diagnostics
The faulty signal in gear transmission system mostly appears as a periodical impact sequence. Hence, we may select a series of pulses or square wave as the suitable reference signal, such as Eq. (13) below:
where is the gear meshing frequency, is the initial phase angle or time-delay and is the duty ratio or impulse-wide.
3.4. Procedures of the proposed approach
The proposed method is a good candidate for extracting the desired source signal from the single-channel measured signal with source noises and measured noise. Its procedures can be described as follows:
Step 1: Decompose the gearbox single-channel measured signal according to Eq. (6), and obtain IMF components.
Step 2: Compute the kurtosis of each IMF and correlation coefficient between each IMF and the original signal , select the IMF components with greater kurtosis and correlation coefficient to compose a new observation vector with the original signal , then take the new vector as the cICA algorithm input, given the new vector is , .
Step 3: Construct the reference signal with the desired fault signature, then extract the fault signal with cICA method.
Step 4: Analyze the extracted fault signal with Hilbert envelope spectrum and obtain the desired fault feature.
4. Simulation analysis
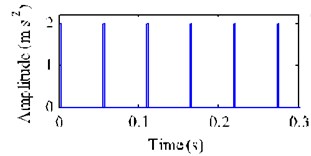
The aim of the simulation is to extract the desired low-frequency weak fault signal from the mixed data set. According to Eq. (16), we generated three source signals, , and , whose time domain waveforms are shown in Fig. 1:
where signal is desired to be extracted, but its energy is weak. The parameter values of three simulated source signals, , and in Eq. (16) are listed in Table 1.
Table 1Parameter values of the simulated signal
, | , | ||||||||||
530 Hz | 5.3 Hz | 46.5 Hz | 1.5 Hz | 6 | 2 | 0 | 1 | 0.5 | 25 Hz | 2 | 1 |
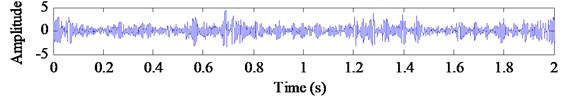
The source noise , and are respectively added to the three source signals , and with SNR of –5dB. Three noisy signals are randomly mixed by a mixing vector and get a single-channel mixed signal. Then the mixed signal is added a Gaussian white noise with the amplitude standard deviation of 2. Finally, we obtain a single-channel simulated signal , whose time-domain waveform, FFT spectrum and envelope spectrum are shown in Fig. 2. Among the three source signals, signal without source noise is expected to be extracted from the mixed signal by using the proposed method.
From Fig. 2, the low-frequency modulation frequency (1.5 Hz) is invisible except for the frequency components 2 (93 Hz), (530 Hz) and the modulated frequency (5.3 Hz).
Fig. 1Time domain waveforms of three simulated source signals without noise
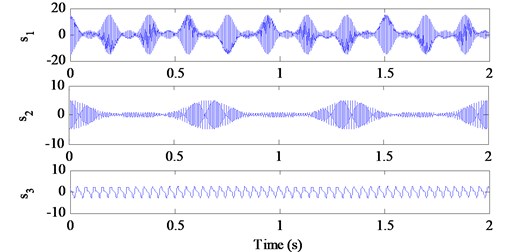
Fig. 2Mixed signal xtand its spectrum and envelope spectrum with SNR of –5 dB
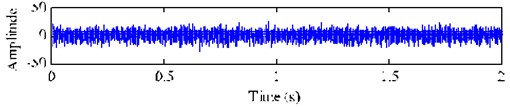
a) Mixed signal
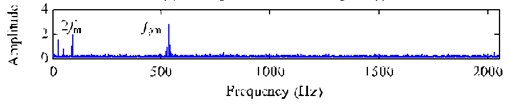
b) FFT spectrum of mixed signal
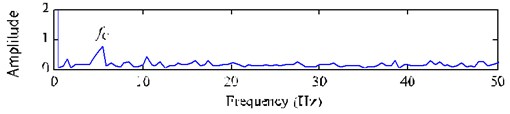
c) Envelope spectrum of mixed signal
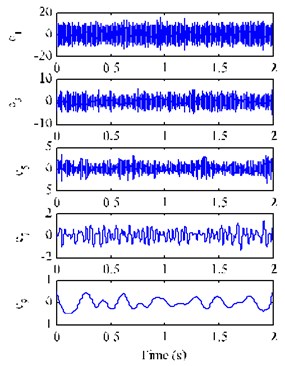
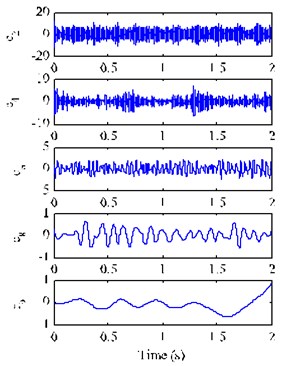
Fig. 3EEMD decomposition results of the mixed signal xt with SNR of –5 dB
a)
b)
Fig. 3 depicts the decomposition results with EEMD method for the mixed signal . The kurtosis of each IMF and the correlation coefficients between each IMF and the signal are listed in Table 2. Among the IMFs, although the correlation coefficient value of is very big, it is a high frequency noise and not to be considered. So, based on the criterions of kurtosis and correlation coefficient, we select the IMFs , , and ( 3.0 and 0.2) combined with the original signal to construct a new observation vector. We generate a suitable reference signal (shown in Fig. 4(a)) with frequency (46.5 Hz) of signal , and then use the cICA method to successfully extract a desired source signal (shown in Fig. 4(b)) as the closeness of the simulated signal . The SIR value of the extracted signal is 3.16 dB.
Table 2Kurtosis and correlation coefficients of IMFs by EEMD method with SNR of –5 dB
IMFs | ||||||||||
2.16 | 3.16 | 3.00 | 4.22 | 3.58 | 2.51 | 2.75 | 2.21 | 3.19 | 3.74 | |
0.685 | 0.552 | 0.296 | 0.298 | 0.216 | 0.192 | 0.055 | 0.031 | 0.014 | 0.008 |
Fig. 4Suitable reference signal rt and its extracted desired signal y*t using EEMD-based cICA
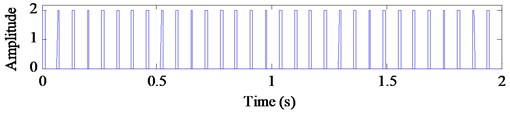
a) Constructed suitable reference signal
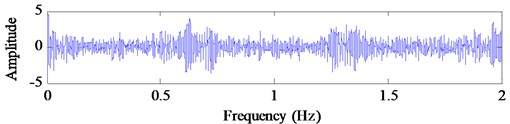
b) Extracted signal with EEMD-based cICA method
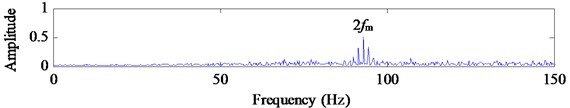
The FFT spectrum and envelope spectrum of the extracted signal are shown in Fig. 5. Apparently, the modulated sidebands of low-frequency (1.5 Hz) around the center frequency 2(93 Hz) is very evident. Of course, the original source signal is not completely recovered for the strong source noise, but the low-frequency weak feature has been extracted from the mixed signal with other strong signals and noise influence.
Fig. 5FFT spectrum and envelope spectrum of the extracted signal y*t
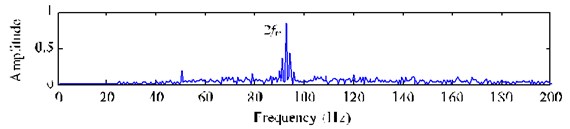
a) FFT spectrum of the extracted signal
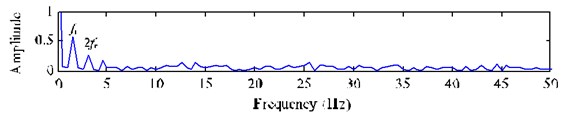
b) Envelope spectrum of the extracted signal
Fig. 6 shows the decomposition results and its FFT spectra with EMD-based cICA method for the mixed signal . The SIR value of the extracted signal is 1.58 dB. Obviously, EMD-based cICA method can also expresses the feature frequency (1.5 Hz) of signal , but its effect is a bit worse than the EEMD-based cICA method. The simulated results show that the proposed method can effectively extract the low-frequency weak gear fault signals from the single-channel observation signal.
Fig. 6Extracted signal y*t using EMD-based cICA and its FFT spectrum and envelope spectrum
a) Extracted signal with EMD-based cICA method
b) FFT spectrum of the extracted signal
c) Envelope spectrum of the extracted signal
5. Experimental signals analysis
Next, we use the real-world signal from a multi-stage gearbox to verify the effectiveness of our approach, the single-channel vibration signals with a missing tooth and a chipped tooth localized on the gear (= 36) of the two-stage fixed-shaft gearbox in this experiment are studied, respectively. The schematic diagram of gearbox test rig is shown in Fig. 7.
Fig. 7Schematic diagram of gearbox test rig
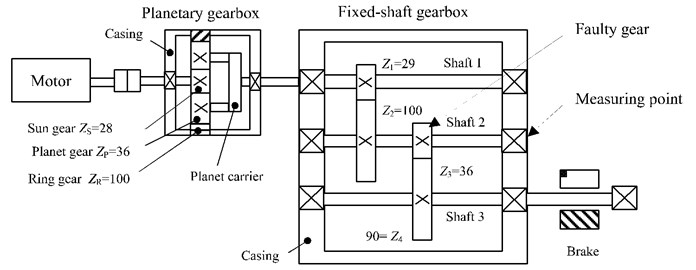
Table 3Characteristic frequencies of gearbox
Items | Single-stage planetary gearbox | Two-stage fixed-shaft gearbox | |||||
Tooth number | 28 | 36 | 100 | 29 | 100 | 36 | 90 |
Shaft rotating frequency / Hz | 24 | 5.25 | 5.25 | 1.52 | 0.6 | ||
Meshing frequency / Hz | 525.0 | 152.3 | 54.8 | ||||
Experimental fault gear photos are shown in Fig. 8. The rotating frequency of motor is 24.0 Hz, sampling frequency is 5120 Hz and data length is 15 kB samples. Characteristic frequencies are listed in Table 3, where . and denote the rotating frequency of motor, sun gear, planet carrier, respectively, and denote the meshing frequency of fixed-shaft gearbox and planetary gearbox, respectively. The gear fault characteristic frequency is (1.52 Hz), and its corresponding meshing frequency is (152.3 Hz).
Fig. 8Photos of faulty gear Z3: a) missing a tooth; b) a chipped tooth
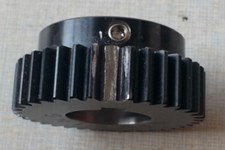
a)

b)
5.1. A missing tooth signal analysis
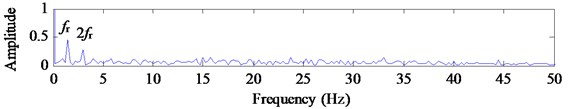
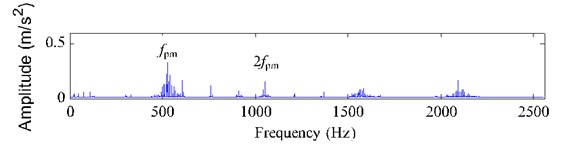
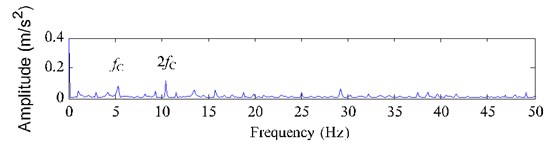
Fig. 9 illustrates the FFT spectrum and envelope spectrum of the gear vibration signal with a missing tooth. The main frequency components are the meshing frequency (525 Hz) of planetary gearbox and its harmonics, the modulated frequency is the planet carrier rotating frequency (5.25 Hz), which does not mean that the planetary gearbox has any fault according to the reference [30]. However, it is difficult to distinguish any obvious fault feature frequency (1.52 Hz) because the fault feature with a missing tooth is not apparent.
Fig. 9Single-channel signal x1t with a missing tooth and its FFT spectrum & envelope spectrum
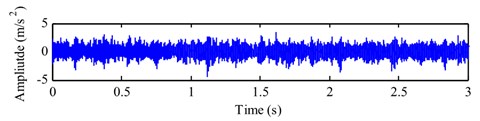
a) Single-channel observation signal with a missing toth
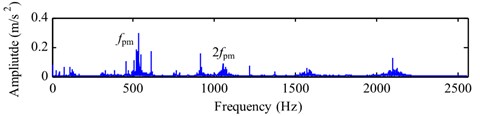
b) FFT spectrum of
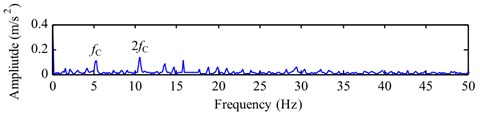
c) Envelope spectrum of
Table 4Kurtosis and correlation coefficients of IMFs by EEMD with a missing tooth
IMFs | ||||||||||
3.29 | 4.15 | 3.79 | 10.09 | 3.32 | 2.95 | 1.91 | 2.96 | 2.40 | 2.64 | |
0.693 | 0.795 | 0.530 | 0.155 | 0.139 | 0.078 | 0.048 | 0.017 | 0.007 | 0.0005 |
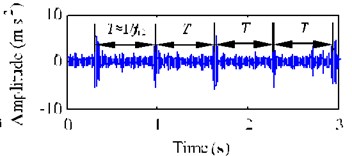
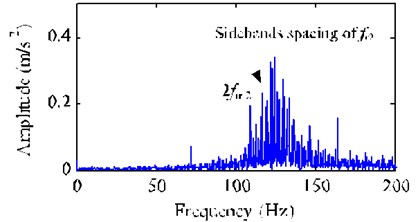
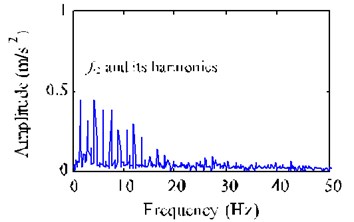
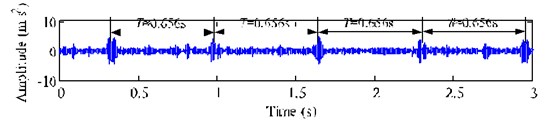
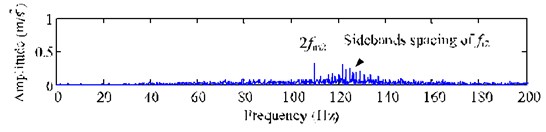
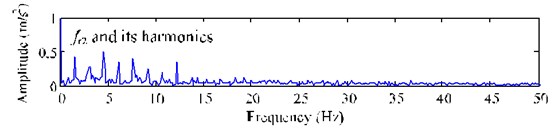
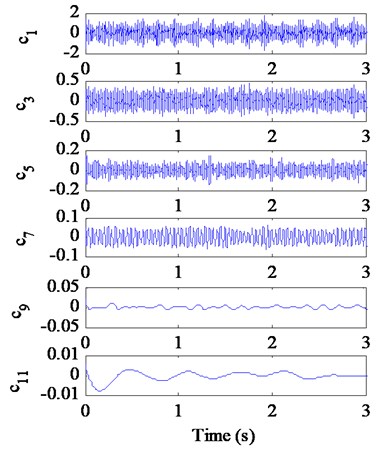
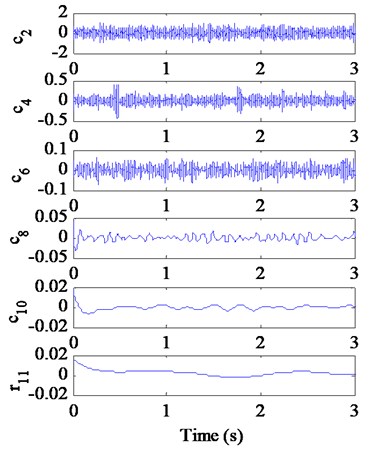
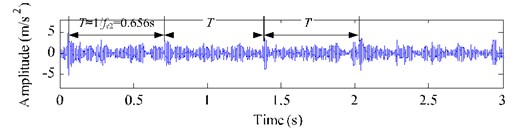
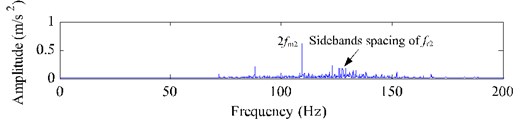
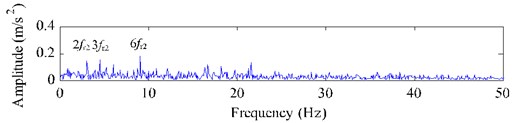
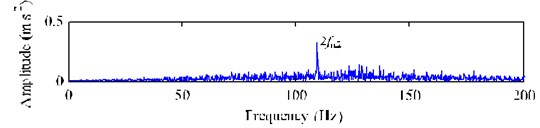
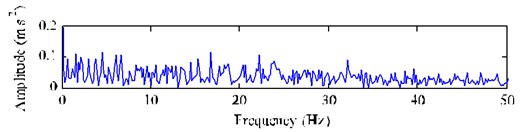
Fig. 10 depicts the decomposition results of the single-channel observation signal in Fig. 9(a) by using EEMD method. The kurtosis of each IMF (-) and the correlation coefficient between each IMF (-) and the fault signal with a missing tooth are listed in Table 4. Based on the criterions of kurtosis and correlation coefficient, we select the IMFs - ( 3.2 and 0.1) combined with the original signal to construct a new observation vector. Through generating a proper reference signal (shown in Fig. 11(a)) with the meshing frequency of (54.8 Hz), we successfully extract the desired fault signal (shown in Fig. 11(b)) with cICA method. Obviously, the periodical impacts at 0.67 s 1/1.52) in time domain are very evident. The corresponding FFT spectrum and envelope spectrum of the extracted signal are shown in Fig. 12(a) and (b), respectively. As shown in Fig. 12, it can be clearly distinguished that there are plentifully modulated sidebands around the right side of frequency 2 (109.6 Hz). The obvious fault feature frequency is (1.52Hz), which is corresponding to the shaft 2 rotating frequency of the fault gear (= 36) with a missing tooth on the fixed-shaft gearbox.
Fig. 10EEMD decomposition results of the original signal x1t with a missing tooth
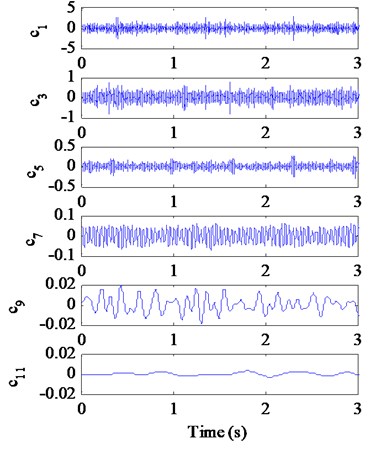
a)
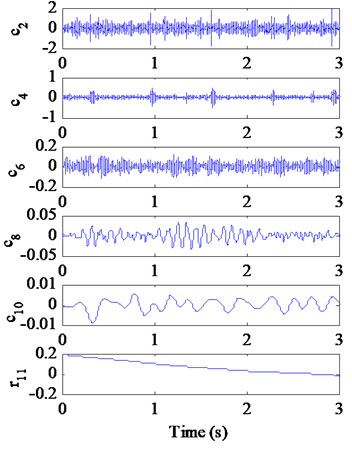
b)
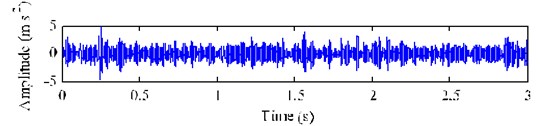
Fig. 11Proper reference signal rt and its extracted desired fault signal y1*t using EEMD-based cICA method with a missing tooth
a) Proper reference signal
b) Extracted fault signal
Fig. 12FFT spectrum and envelope spectrum of the extracted desired fault signal y1*
FFT spectrum
b) Envelope spectrum
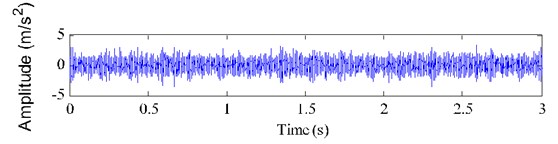
To compare the effect, the extracted result of EMD-based cICA method is shown in Fig. 13, the result is not as good as the EEMD-based cICA method.
Fig. 13Extracted results using EMD-based cICA method with a missing tooth
a) Extracted signal
b) FFT spectrum of
c) Envelope spectrum of
5.2. A chipped tooth signal analysis
Fig. 14 demonstrates the FFT spectrum and envelope spectrum of the gear fault vibration signal with a chipped tooth. The main frequency components are also the meshing frequency (525 Hz) of planetary gearbox and its high order harmonics, and the fault modulated frequency is still the planet carrier rotating frequency (5.25 Hz), which is uninterested for us. However, it is much difficult to identify the fault feature frequency (1.52 Hz) because the fault signal with a chipped tooth is much fainter.
Fig. 14Single-channel signal x2t with a chipped tooth and its FFT spectrum and envelope spectrum
a) Single-channel observation signal with a chipped tooth
b) FFT spectrum
c) Envelope spectrum
Fig. 15 shows the decomposition results of the single-channel observation signal in Fig. 14(a) using EEMD method. The kurtosis of each IMF (-) and the correlation coefficient between each IMF (-) and the fault signal with a chipped tooth are listed in Table 5. Based on the criterions of kurtosis and correlation coefficient, we select the IMF components - ( 3.2 and 0.1) combined with the original signal to construct a new observation vector. The unchanged reference signal is shown in Fig. 11(a), then we utilize cICA method to successfully extract the desired fault signal , whose time domain waveform, FFT spectrum and envelop spectrum are shown in Fig. 16. From Fig. 16(a), the periodical impacts at 0.67 s ( 1/1.52) in time domain is evident, but it is not as clear as that shown as in Fig. 11 (b). In Fig. 16 (b), we can clearly distinguish that there are some modulated sidebands around the right side of frequency 2 (109.6 Hz). The fault feature frequency is 1.52 Hz from Fig. 16(c), which is also corresponding to the shaft 2 rotating frequency of the faulty gear (= 36) with a chipped tooth on the fixed-shaft gearbox.
Similarly, if we use the EMD-based cICA method to analysis the signal , the effective low-frequency fault feature (1.52 Hz) will not be extracted, as shown in Fig. 17.
Table 5Kurtosis and correlation coefficients of IMFs by EEMD with a localized chipped tooth
IMFs | ||||||||||
4.14 | 3.44 | 4.22 | 3.63 | 3.29 | 2.71 | 2.59 | 2.74 | 2.53 | 2.48 | |
0.650 | 0.696 | 0.168 | 0.161 | 0.107 | 0.085 | 0.065 | 0.005 | 0.003 | 0.001 |
Fig. 15EEMD decomposition results of the original signal x2t with a chipped tooth
a)
b)
The experimental results indicate that the proposed method is effective and available for low-frequency fault feature extraction, especially for the weak fault feature extraction of the gearbox single-channel observation signal.
Fig. 16Extracted results using EEMD-based cICA method with a chipped tooth
a) Extracted signal
b) FFT spectrum of
c) Envelope spectrum
Fig. 17Extracted results using EMD-based cICA method with a chipped tooth
a) Extracted signal
b) FFT spectrum of
c) Envelope spectrum of
6. Conclusions
Aiming at the shortcomings of traditional ICA method and trying to solve the key problem of the extremely underdetermined single-channel blind source separation and fault feature extraction with source noise and measured noise, we proposed an approach combining the advantages of EEMD and cICA. Through simulation and experiments of gear low-frequency fault feature extraction for the single-channel observation signal, the results verify the effectiveness of this proposed method, which is suitable for the gearbox fault diagnosis, especially for the low-frequency and weak fault diagnosis of gearbox. Further study is yet required to introduce the additional denoising processes to enhance this proposed method performance in the low SNR case. Notably, this proposed method is also suitable for other signals feature extraction that show periodicity characteristics, such as the bearing fault signal, the internal combustion engine fault signal.
References
-
Hyvärinen A. Fast and robust fixed-point algorithms for independent component analysis. IEEE Transactions on Neural Networks, Vol. 10, Issue 3, 1999, p. 626-634.
-
Hyvärinen A. Independent component analysis: algorithms and applications. Neural Networks, Vol. 13, Issues 4-5, 2000, p. 411-430.
-
Hyvärinen A., Karhunen J., Oja E. Independent Component Analysis. Wiley, New York, 2001.
-
Comon P., Jutten C. Handbook of Blind Source Separation: Independent Component Analysis and Application. Academic Press, 2010.
-
Sawada H., Araki S., Mukai R., et al. Blind extraction of dominant target sources using ICA and time-frequency. IEEE Transactions on Audio, Speech and Language Processing, Vol. 14, 2006, p. 2165-2173.
-
Lu W., Rajapakse J. C. Approach and Application of Constrained ICA. IEEE Transactions on Neural Networks, Vol. 16, Issue 1, 2005, p. 203-212.
-
Lu W., Rajapakse J. C. ICA with reference. Neurocomputing, Vol. 69, 2006, p. 2244-2257.
-
Lin Zhang Zhi Morphologically constrained ICA for extracting weak temporally correlated signals. Neurocomputing, Vol. 71, 2008, p. 1669-1679.
-
Sun Zhan-Li, Li Shang An improved constrained ICA with reference based unmixing matrix initialization. Neurocomputing, Vol. 73, 2010, p. 1013-1017.
-
Li Changli, Liao Guisheng, ShenYuli An improved method for independent component analysis with reference. Digital Signal Processing, Vol. 20, 2010, p. 575-580.
-
Wang Xiang, Huang Zhitao, Zhou Yiyu, et al. Approaches and applications of semi-blind signal extraction for communication signals based on constrained independent component analysis: the complex case. Neurocomputing, Vol. 101, 2013, p. 204-216.
-
Wang Zhiyang, Chen Jin, Dong Guangming, et.al. Constrained independent component analysis and its application to machine fault diagnosis. Mechanical Systems and Signal Processing, Vol. 25, 2011, p. 2501-2512.
-
Yang Wang Zhi, Jin Chen, Bin Xiao Wen, et al. Fault diagnosis of rolling element bearing based on constrained independent component analysis. Journal of Vibration and Shock, Vol. 31, Issue 9, 2012, p. 118-122.
-
Chen Jinglong, Li Zipeng, Pan Jun, et al. Wavelet transform based on inner product in fault diagnosis of rotating machinery: A review. Mechanical Systems and Signal Processing, Vols. 70-71, 2016, p. 1-35.
-
Skrickij Viktor, Bogdevicius Marijonas, Junevicius Raimunda Diagnostic features for the condition monitoring of hypoid gear utilizing the wavelet transform. Applied Acoustics, Vol. 106, 2016, p. 51-62.
-
Huang N. E., Shen Z., Long S. R., et al. The empirical mode decomposition and the Hilbert spectrum for nonlinear and non-stationary time series analysis. Proceedings of the Royal Society, Vol. 454A, 1998, p. 903-995.
-
Lei Yaguo, Lin Jing, He Zhengjia, et al. A review on empirical mode decomposition in fault diagnosis of rotating machinery. Mechanical Systems and Signal Processing, Vol. 35, Issues 1-2, 2013, p. 108-126.
-
Lee D. S., Park J. M., Vanrolleghem P. A. Adaptive multiscale principal component analysis for on-line monitoring of a sequencing batch reactor. Journal of Biotechnology, Vol. 116, 2005, p. 195-210.
-
Senguler T., Karatoprak E., Seker S., et al. ICA and wavelet packet decomposition approaches for monitoring the incipient bearing damage in electrical motors. International IEEE Conference of Intelligent Systems, Vol. 3, 2008, p. 2413-2417.
-
Wu Q., He Q. B., Kong F. R., et al. Bearing fault diagnosis based on wavelet transform and ICA. Applied Mechanics and Materials, Vol. 48, 2012, p. 672-675.
-
Mijovic B., De Vos M., Gligorijevic I., et al. Source separation from single-channel recordings by combining empirical-mode decomposition and independent component analysis. IEEE Transactions on Biomedical Engineering, Vol. 57, Issue 9, 2010, p. 2188-2196.
-
Mijovic B., De Vos M., Van Huffel S. Combining EMD with ICA for extracting independent sources from single channel and two-channel data. International Conference of the IEEE Engineering in Medicine and Biology Society, 2010, p. 5387-5390.
-
Miao Q., Wang D., Pecht M. Rolling element bearing fault feature extraction using EMD-based independent component analysis. Proceedings of the IEEE Conference on Prognostics and Health Management, Denver, USA, 2011, p. 1-6.
-
Wu Zhaohua, Norden Huang E. Ensemble empirical mode decomposition: a noise assisted data analysis method. Advances in Adaptive Data Analysis, Vol. 1, Issue 1, 2009, p. 1-41.
-
Žvokelj M., Zupan S., Prebil I. Multivariate and multiscale monitoring of large-size low-speed bearings using ensemble empirical mode decomposition method combined with principal component analysis. Mechanical Systems and Signal Processing, Vol. 24, 2010, p. 1049-1067.
-
Žvokelj M., Zupan S., Prebil I. Non-linear multivariate and multiscale monitoring and signal denoising strategy using kernel principal component analysis combined with ensemble empirical mode decomposition method. Mechanical Systems and Signal Processing, Vol. 25, 2011, p. 2631-2653.
-
Wang Jinjiang, Gao Robert X., Yan Ruqiang Integration of EEMD and ICA for wind turbine gearbox diagnosis. Wind Energy, Vol. 17, 2014, p. 757-773.
-
Žvokelj M., Zupan S., Prebil I. EEMD-based multiscale ICA method for slewing bearing fault detection and diagnosis. Journal of Sound and Vibration, Vol. 370, 2016, p. 394-423.
-
Wang Yung Hung, Yeh Chien Hung, Young Hsu Wen Vincent, et al. On the computational complexity of the empirical mode decomposition algorithm. Physica A, Vol. 400, Issue 2, 2014, p. 159-167.
-
Feng Zhipeng, Zuo J. Ming Vibration signal models for fault diagnosis of planetary gearboxes. Journal of Sound and Vibration, Vol. 333, Issue 22, 2012, p. 4919-4939.
About this article

This work was supported by the Project of China National Coal Association (Grant No. MTKJ2015-261), Doctoral Fund of Henan Polytechnic University (Grant No. B2017-28) and Foundation of innovative research team of Henan Polytechnic University (Grant No. T2017-3). The authors would like to thank the reviewers for many valuable comments and suggestions.
