Abstract
Mechanical deformation and fatigue fracture of the steel wire layer are the main damage modes of wire reinforced hoses in automotive fuel delivery systems. To investigate the anti-vibration performance of steel wire reinforced hoses, a finite element model covering prestressed modal calculation, harmonic response analysis and random vibration analysis was constructed based on the modal superposition method. Parametric comparative analyses were carried out respectively under varied conditions of hose length (200-320 mm), wall thickness (0.75-0.9 mm) and fuel delivery pressure (0-12 MPa), and the influence laws of each parameter on the anti-vibration performance of steel wire reinforced hoses were obtained. The study revealed that the first six natural frequencies of the model ranged from 66.311 Hz to 108.877 Hz, which were highly overlapped with the energy-concentrated frequency band of 0-100 Hz in the power spectral density (PSD) of road surface excitation. Parametric analyses showed that low-frequency resonance stress could be reduced by lengthening the hose, while stress concentration at the end would be intensified. The vibration characteristics and fatigue damage mechanism of steel wire reinforced hoses under actual service conditions were clarified, which could provide reliable theoretical basis and technical support for the anti-vibration design and parameter optimization of flexible pipelines in automotive fuel systems.
Highlights
- Vibration response analysis under different structural parameters and operating parameters is carried out for steel wire reinforced hoses in automotive oil delivery systems under the working conditions of periodic engine vibration and random road impact.
- The stress response and fatigue damage mechanism of steel wire reinforced hoses under different vibration types are systematically revealed.
- The modeling system integrating static pre-stress analysis, modal extraction and random vibration response is constructed with the influence of pre-stress considered.
1. Introduction
As a core component that ensures the power output of the engine, the operational reliability of the fuel delivery system directly determines the driving safety and service life of the entire vehicle [1]. In automotive fuel delivery systems, steel wire reinforced hoses feature flexible connection, impact resistance and lightweight characteristics, making them key flexible components connecting the fuel tank and the engine [2, 3]. They are widely used in fuel transmission scenarios of various fuel-powered vehicles, and their structural integrity and vibration resistance are the core prerequisites for preventing safety accidents such as fuel leakage and fire. During vehicle operation, the periodic vibration generated by engine operation and the random impact caused by road turbulence continuously act on the steel wire reinforced hose, inducing structural vibration responses [4, 5]. Under long-term service, fatigue damage such as joint failure, fatigue fracture of the steel wire layer and cracking of the hose layer are prone to occur, which further impairs the sealing performance and safety of fuel delivery. Therefore, carrying out vibration resistance analysis of steel wire reinforced hoses and revealing their vibration characteristics and fatigue damage mechanisms has become an urgent demand in the field of automotive component design and performance optimization [6-8].
At present, research on steel wire reinforced hoses mainly focuses on the verification and optimization of static strength, including structural defect analysis, material failure analysis, dynamic characteristic analysis, fatigue analysis and so on, while there are relatively few studies on the response analysis under complex dynamic excitation vibration. Representative studies are as follows: Aiming at the defect problems of steel wire braided hoses, Ying [9] proposed an improved structural detection model to realize the identification of surface and internal defects of hoses. Taking the bellows matched with braided hoses as the research object, Sun [10] carried out failure analysis for its fracture failure, explored the core inducements of bellows fracture, clarified the correlation between fracture and structural stress, material properties and service conditions, and provided a theoretical basis for fracture prevention and reliability improvement of braided hose components. Focusing on the dynamic characteristics of flexible metal hoses, Murzin [11] conducted a special analysis on their frequency characteristics, studied the natural frequency and frequency-domain response laws of flexible metal hoses, revealed the internal relationship between structure and vibration frequency characteristics, and provided support for the anti-vibration design and dynamic performance optimization of metal hoses. Taking flexible metal tubes as the research object, Katsuya [12] explored the relationship between their internal pressure strength and the shape structure of bellows, systematically analyzed the influence laws of different bellows shapes on the internal pressure bearing capacity of metal hoses, clarified the mechanism of structural morphology on strength performance, and provided guidance for the structural optimization design of flexible metal tubes. Aiming at braided layered composite hoses, Cho [13] studied the material anisotropy, large deformation mechanical behavior and fatigue damage characteristics, revealed the deformation law and fatigue failure mechanism of the braided layered composite structure under load, and provided a theoretical reference for the structural design and life prediction of composite braided hoses.
In terms of engineering application value, the vibration response analysis scheme adopted in this paper can be effectively utilized to verify the structural safety of steel wire reinforced hoses under various working conditions. Safety accidents such as fuel leakage caused by fatigue failure of the hose can be reduced, the failure rate of automotive fuel systems can be decreased, and the driving safety of the whole vehicle can be ensured. To further acquire the random vibration characteristics and fatigue damage mechanism of steel wire reinforced hoses in oil delivery systems, simulation analyses under different parameters (length, wall thickness, oil pressure) are carried out. The vibration characteristics of steel wire reinforced hoses corresponding to different structural parameters and operating parameters are obtained, and the influence laws of each parameter on the vibration resistance and fatigue life of the hose are clarified. Compared with previous studies, the main innovation points of this study are as follows:
(1) Vibration response analysis under different structural parameters and operating parameters is carried out for steel wire reinforced hoses in automotive oil delivery systems under the working conditions of periodic engine vibration and random road impact. The limitation of performance evaluation under the traditional single load is broken through, and the simulation environment is made closer to the real service conditions.
(2) The stress response and fatigue damage mechanism of steel wire reinforced hoses under different vibration types are systematically revealed. The inducements and evolution laws of typical damages including joint failure, fatigue fracture of the steel wire layer and cracking of the hose layer are clarified, and new theoretical basis is provided for the anti-vibration design of automotive flexible pipeline components.
(3) The modeling system integrating static pre-stress analysis, modal extraction and random vibration response is constructed with the influence of pre-stress considered. The modeling accuracy is guaranteed through grid independence verification, random vibration analysis is carried out based on the mode superposition method, and the reliability verification of the dynamic characteristics of pressure-bearing hoses is realized. The laws of multi-parameter influence under random vibration conditions were investigated, including parameters such as length, wall thickness and oil pressure.
2. Analysis of vibration response characteristics
2.1. Structure composition and working principle
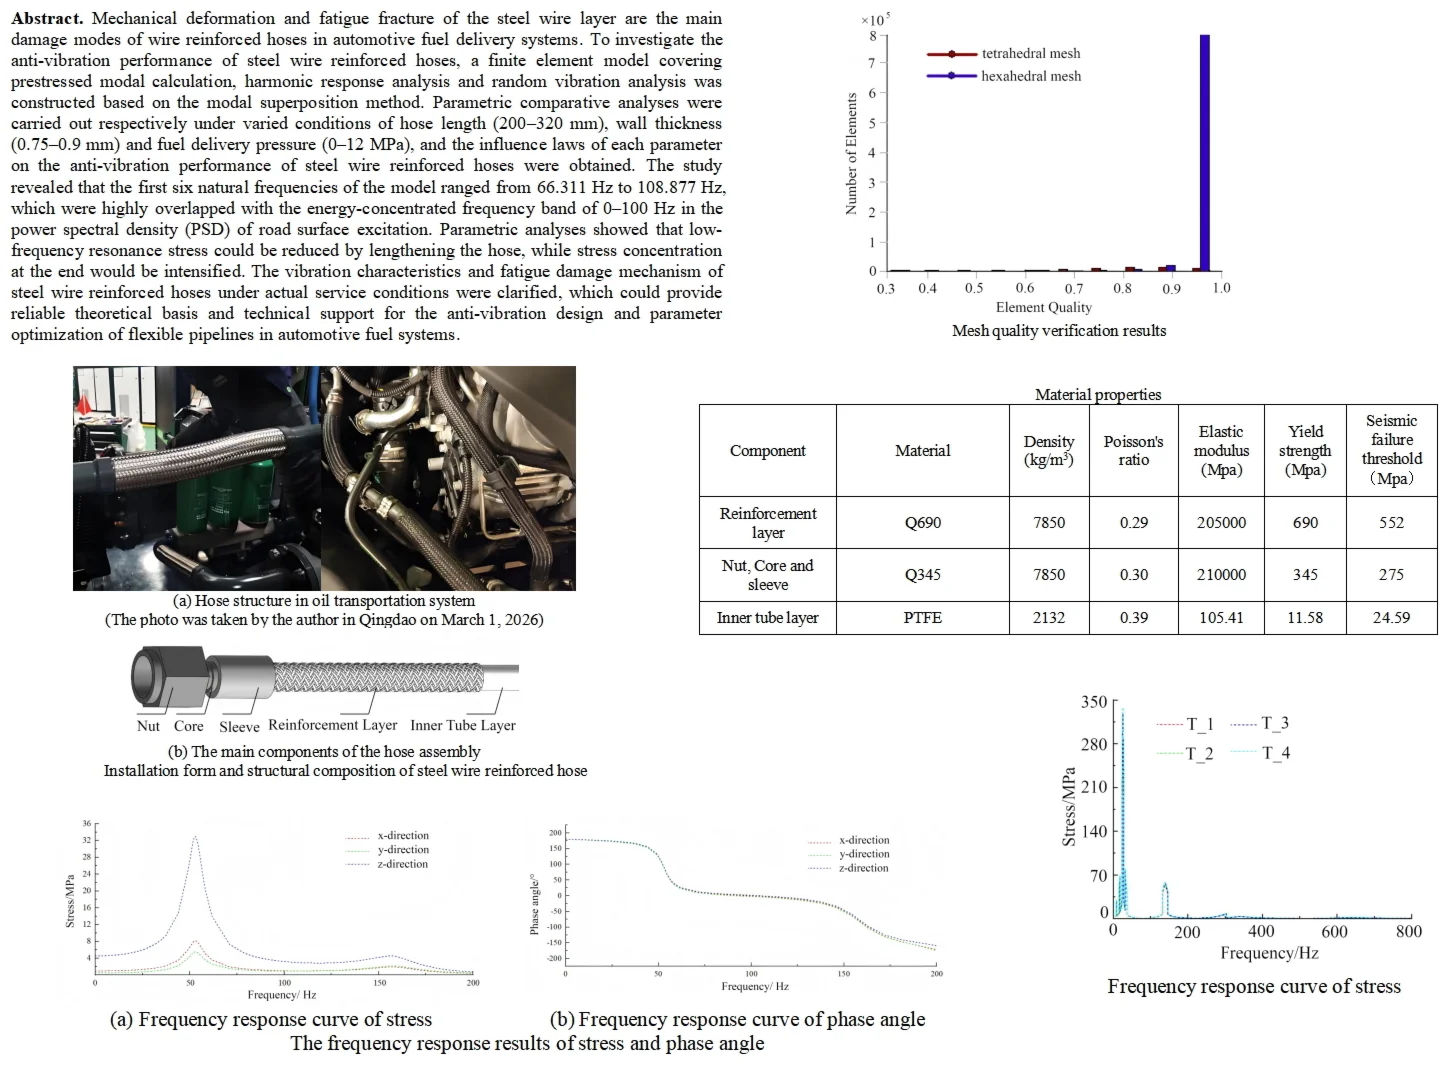
As shown in Fig. 1, The steel wire reinforced hose mainly consists of two major parts: the hose body and the end fitting. The hose body primarily includes an inner tube layer and a steel wire reinforcement layer. The inner tube layer is mostly made of thermoplastic elastomer, which is in direct contact with the conveyed medium to achieve fluid sealing and resist medium corrosion, high temperatures and low temperatures. The reinforcement layer is braided or wound with reinforced steel wires and acts as the core pressure-bearing component. It can greatly improve the burst pressure and tensile strength of the hose, and effectively restrain the expansion and deformation of the hose body. The end fitting is composed of a core, a ferrule and a nut. The core is inserted into the inner tube to provide a continuous fluid passage, and its toothed or annular surface structure enhances the mechanical interlocking force with the inner tube and the ferrule. The ferrule tightly wraps the reinforcement layer and the core through the crimping process to realize mechanical locking, so as to prevent the fitting from separating under high-pressure working conditions. The nut is used for threaded connection with external pipelines or equipment, ensuring convenient assembly and disassembly as well as connection reliability. Overall, steel wire reinforced hoses boast excellent high-pressure bearing capacity, outstanding flexibility, wide temperature adaptability and strong medium compatibility. They can adapt to complex pipeline layouts, resist fatigue damage caused by repeated bending and pressure pulses, and are widely used in high-pressure fluid transportation applications.
Fig. 1Installation form and structural composition of steel wire reinforced hose. Photo by the author in Qingdao on March 1, 2026
a) Hose structure 1 in oil transportation system
b) Hose structure 2 in oil transportation system
c) The main components of the hose assembly
2.2. Establishment of finite element model
To balance the accuracy and computational cost of the finite element model, geometric cleanup shall be performed on tiny geometric features that exert no influence on the overall mechanical behavior, such as local minor chamfers, so as to avoid meshing difficulties, element distortion or a drastic increase in computational load caused by such details. The ANSYS meshing results of the steel wire reinforced hose are presented in Fig. 2, in which two types of finite element meshes, i.e., tetrahedral and hexahedral meshes, are mainly adopted. Among them, the hexahedral mesh takes regular hexahedral elements as its core form, with mesh lines arranged in orthogonal rectangles or squares, featuring a regular and orderly structure. As shown in the locally enlarged details of the braided structure, this mesh can precisely conform to the regular geometric morphology of the interlaced steel wire braiding, and the element boundaries are highly consistent with the fibrous structure of the hose. The core advantage of this mesh type lies in its excellent element quality: the regular morphology brings the element quality closer to the ideal value of 1, which can significantly improve the calculation accuracy. Meanwhile, under the same analysis accuracy requirement, the hexahedral mesh has fewer elements and lower degrees of freedom, which can effectively reduce the computational cost and improve the solution efficiency. In addition, the regular element morphology can enhance the convergence stability of finite element solutions, reduce the risk of numerical divergence, and achieve stress-strain transfer more in line with the actual physical scenario, making it suitable for high-precision analysis of the regular braided sections of the hose. In contrast, the tetrahedral mesh is composed of tetrahedral elements as basic units, which are formed by splicing triangular faces. It is more flexible in meshing and can adaptively fit complex geometric regions such as hose cross-sectional variations and interlaced transitions of the braided structure. Mesh generation can be completed without extensive manual geometric repair. Its core advantages are reflected in strong geometric adaptability, high modeling efficiency, and the capability to realize smooth mesh transition in geometric discontinuity regions to avoid element distortion, which makes it suitable for rapid modeling and preliminary analysis of complex structural areas.
Fig. 2Mesh division results
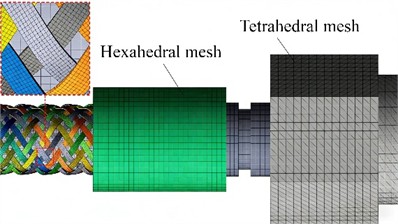
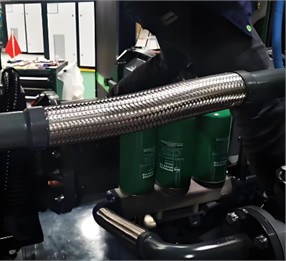
Fig. 3Mesh quality verification results
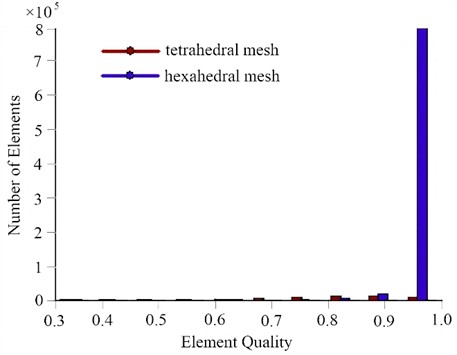
The histograms for element quality verification of the two mesh types are shown in Fig. 3, which intuitively reflect the meshing quality through quantitative statistics. The horizontal axis of the chart represents the element quality; a value closer to 1 indicates a more ideal element morphology and higher calculation accuracy. The vertical axis represents the number of elements in the corresponding quality intervals. From the distribution characteristics, the hexahedral mesh accounts for a higher proportion of elements, and there are almost no low-quality elements with a quality lower than 0.7. This distribution feature directly verifies its core advantages of high accuracy and high efficiency, enabling it to provide reliable calculation results.
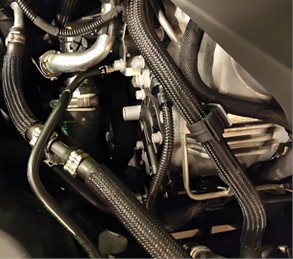
Since steel wire reinforced hoses in oil delivery systems are continuously subjected to the coupled action of engine harmonic vibration and road random excitation during service, modal analysis, harmonic response analysis and random vibration analysis are mainly performed to evaluate their dynamic characteristics and vibration reliability. The hose is composed of a reinforcement layer, an inner tube layer, and connecting components including nuts, mandrels and ferrules. The material properties of each component are given in Table 1. The reinforcement layer adopts Q690 high-strength structural steel, acting as the main load-bearing and stiffness-providing component of the hose. It provides the primary structural stiffness and transmits dynamic loads during vibration. With a yield strength of 690 MPa and a vibration failure threshold of 552 MPa, it has sufficient strength reserve and is less prone to plastic yielding or fatigue failure under random vibration and harmonic excitation, making it the core material ensuring the structural integrity of the hose. Nuts, mandrels and ferrules are made of Q345 low-alloy structural steel, which mainly performs functions of connection, fixation and boundary constraint, and serves as the key region for vibration load transmission and stress concentration. This material is highly matched with the reinforcement layer in stiffness, which can reduce the abrupt change of interfacial stiffness and avoid additional interfacial stresses during vibration. The inner tube layer is made of PTFE (polytetrafluoroethylene), which is mainly responsible for oil delivery, sealing and medium isolation. As a flexible functional layer, it barely participates in structural load-bearing. During vibration, it only deforms coordinately with the metal framework without significantly changing the structural dynamic stiffness, thus acting as a key control object for guaranteeing the reliability of the oil delivery system.
From the perspective of vibration simulation, the three types of materials show an obvious functional gradient distribution in stiffness, density and strength, which is highly compatible with modal, harmonic response and random vibration analyses. In finite element modeling, the influence of material property differences on dynamic characteristics should be fully considered. Linear elastic constitutive models are adopted for metal components to meet the requirements of linear vibration analysis. A flexible coordinated deformation relationship should be defined between metals and PTFE to truly reflect the coordinated deformation behavior of the multi-layer structure under vibration loads.
Table 1Material properties
Component | Material | Density (kg/m3) | Poisson’s ratio | Elastic modulus (MPa) | Yield strength (MPa) | Seismic failure threshold (MPa) |
Reinforcement layer | Q690 | 7850 | 0.29 | 205000 | 690 | 552 |
Nut, core and sleeve | Q345 | 7850 | 0.30 | 210000 | 345 | 275 |
Inner tube layer | PTFE | 2132 | 0.39 | 105.41 | 11.58 | 24.59 |
2.3. Modal analysis
Pre-stressed Modal Analysis is a dynamic characteristic analysis method for structures under initial loading conditions [14, 15]. Under preloads such as internal pressure, steel wire reinforced hoses will produce initial stress and deformation, which further changes the geometric stiffness matrix of the structure and ultimately affects the natural frequencies and mode shape distribution. Different from conventional non-prestressed modal analysis, this method first obtains the initial stress field under preload via static structural analysis, and then carries out modal analysis on the basis of this prestressed state [16]. It can more realistically reflect the dynamic behavior of structures in actual service conditions, and is especially suitable for flexible load-bearing structures with preloads, such as pressure-bearing hoses and pressure vessels. Fixed support constraints are applied to the nuts at both ends to restrain the translational and rotational degrees of freedom along the // directions, so as to simulate the rigid connection between the steel wire reinforced hose and the engine or pipeline. A uniform normal pressure of 6 MPa is imposed on the inner wall of the hose to simulate conventional oil delivery pressure, and static structural analysis is performed to establish the structural stiffness matrix under the prestressed state. Based on the prestressed state, the Block Lanczos method is used to extract the first 6 orders of natural frequencies and mode shapes. The post-processing module is adopted to visualize the deformation distribution of mode shapes, and key parameters such as the natural frequency of each order and the maximum relative displacement are counted to analyze the influence of prestress on the dynamic characteristics of the hose.
Fig. 4The first six modal shapes
a) The first order
b) The second order
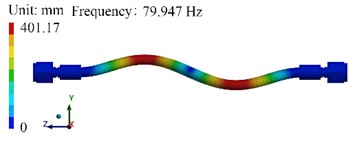
c) The third order
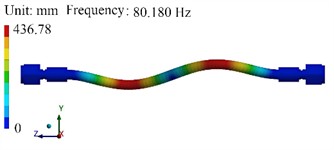
d) The fourth order
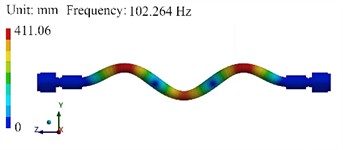
e) The fifth order
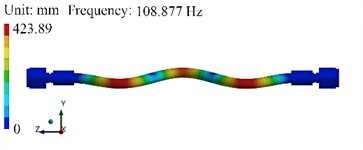
f) The sixth order
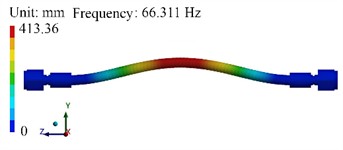
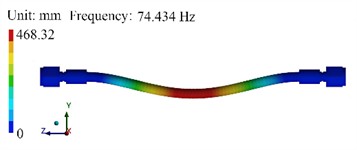
The results of modal mode shape analysis are shown in Fig. 4. It can be seen that the first 6 natural frequencies of the steel wire reinforced hose range from 66.311 Hz to 108.877 Hz, showing an increasing trend with the rise of modal order. The 1st and 2nd orders (66.311 Hz, 74.434 Hz) are medium-low frequency modes, which highly overlap with the excitation frequency band (50-200 Hz) of automobile engines during idling or low-speed operation, thus presenting a resonance risk. The 3rd and 4th orders (79.947 Hz, 80.180 Hz) are paired modes with similar frequencies, with a frequency difference of only 0.233 Hz, reflecting the stiffness symmetry of the structure in orthogonal planes. The 5th and 6th orders (102.264 Hz, 108.877 Hz) jump to above 100 Hz, corresponding to high-order complex vibration modes. It can be observed from the mode shape contour plots that the displacement of the fixed nuts at both ends approaches zero under all modes, and the mode shapes are completely dominated by the elastic deformation of the hose body. The 1st mode is single-wave overall bending, which is the first-order bending mode of a typical fixed-fixed beam, with deformation concentrated in the middle of the hose body. The 2nd mode is dominated by radial deformation near the center, which is similar to the vertical bending of the first mode and reflects the vibration characteristics in the axial plane. The 3rd and 4th modes are double-wave bending modes, with two crests or troughs appearing on the hose body. Their highly close frequencies reflect the symmetry of bending stiffness of the hose in two orthogonal planes. The 5th and 6th modes are triple-wave bending modes with more fragmented deformation and increased local stress gradient, representing high-order complex vibration modes.
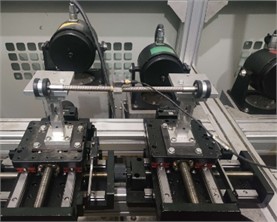
To ensure the reliability of the finite element simulation model, a natural frequency test platform for steel wire reinforced hoses was constructed based on the theory of linear vibration modal testing, as shown in Fig. 5. This test platform can accurately simulate the actual service conditions of steel wire reinforced hoses. It excites vibration via controllable excitation, collects vibration response signals and conducts frequency-domain analysis to identify dynamic characteristics such as natural frequencies. During the experiment, fixed-end constraints at both sides were realized by bottom fixtures, and an internal pressure of 6 MPa could be applied into the hose to simulate the prestressed state, which is fully consistent with the boundary and load conditions in the finite element analysis. An electromagnetic vibrator provides stable excitation, while an acceleration sensor and a force sensor collect the vibration response and excitation force signals respectively.
Fig. 5Test of natural frequency. Photo by the author in Qingdao on March 15, 2026
The time-domain signals are acquired and converted into frequency response functions through FFT transformation, so as to obtain the natural frequencies of each order, as listed in Table 2. It can be observed that the measured natural frequencies are in good agreement with the simulation results, and the maximum deviation is less than 5 %, which verifies that the finite element model satisfies the accuracy requirements.
Table 2The test and comparison results of natural frequency
Order | 1 | 2 | 3 | 4 | 5 | 6 |
Simulation value / Hz | 66.31 | 74.43 | 79.95 | 80.18 | 102.26 | 108.88 |
Test value / Hz | 65.38 | 72.09 | 77.09 | 78.44 | 101.39 | 107.43 |
2.4. Harmonic response analysis
Harmonic Response Analysis is a linear dynamic finite element method in the frequency domain, which is specially utilized to solve the steady-state forced vibration response of structures under continuous sinusoidal or cosinusoidal simple harmonic alternating excitation, and quantitative dynamic strength indicators under multi-directional excitations can be acquired through this method [17, 18]. To obtain the dynamic stresses of each material layer of the hose, especially the steel wire reinforcement layer, ensure that the stress levels are maintained below the allowable values of corresponding materials within the full frequency band and guarantee structural safety, the harmonic response analysis of steel wire reinforced hoses applied in the fuel delivery systems of automotive engines is proposed in this paper. In harmonic response analysis, modal analysis must be completed in advance as the core preliminary work, because the harmonic response solved by the mode superposition method is required to depend on the natural frequencies and mode shapes obtained from modal analysis as basic data, and only in this way can the decomposition of simple harmonic excitation and the synthesis of structural steady-state response be realized. Within the intervals of normal driving and regular engine operation, the effective value of steady-state vibration acceleration at pipeline mounting points is tested to be 1-3 g, and the peak load is concentrated at approximately 2 g. This magnitude covers more than 90 % of conventional service conditions, is deemed as the typical high-intensity vibration load endured by fuel delivery hoses in the long term, and the dynamic excitation level in the actual vehicle service environment can be truly reflected by it. Therefore, sinusoidal excitation with 2g acceleration is imposed in the , and directions, and the calculation is performed within the frequency range of 0-200 Hz. Solved by the mode superposition method, the dynamic mechanical characteristics of the hose under engine operation and road surface excitation can be faithfully restored. Owing to the small inner diameter and regular geometry of the wire-reinforced hose, the viscous damping is extremely low and can be neglected. No specific undamped configuration is adopted in the individual components of the wire-reinforced hose, and the influence of damping characteristics at the joints on the natural frequency is regarded as insignificant. A certain amount of material damping is exhibited by the PTFE inner tube, which is classified as a viscoelastic material. The model damping ratio of 0.41 is set according to the material properties of the PTFE hose.
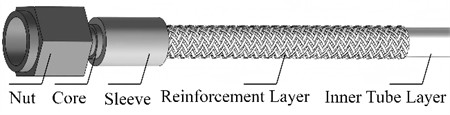
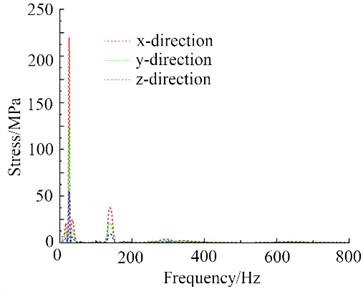
Through harmonic response analysis, the frequency response results of stress and phase angle are obtained as shown in Fig. 6. It can be seen that the dynamic response of the steel wire reinforced hose exhibits obvious frequency and direction dependence under sinusoidal excitation of 2g acceleration in the // directions within the frequency range of 0-200 Hz. The stress frequency response curve indicates that the peak stress in the direction reaches 32-33 MPa, which is much higher than that in the direction (approximately 8 MPa) and direction (approximately 5 MPa), making it the most dangerous direction for the dynamic stress of the hose. When the excitation frequency exceeds 100 Hz, the stresses in all three directions are maintained below 4 MPa in the non-resonant regions, with a weak dynamic amplification effect. The phase angle frequency response curve shows an abrupt change at the first natural frequency, dropping rapidly from approximately 180° to nearly 0°, which corresponds exactly to the position of the stress resonance peak. This further verifies the main resonance frequency of the structure and conforms to the mechanical law of 90° phase lag during simple harmonic vibration resonance. Above 60 Hz, the phase angle decreases gradually and approaches –180°, and the phase difference between the structural response and the excitation increases gradually, with no additional resonance risk. Overall, the stress level in the non-resonant regions is safe and controllable, and the dynamic strength and reliability of the steel wire reinforced hose under normal service conditions can be guaranteed.
Fig. 6The frequency response results of stress and phase angle
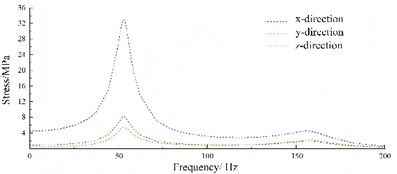
a) Frequency response curve of stress
b) Frequency response curve of phase angle
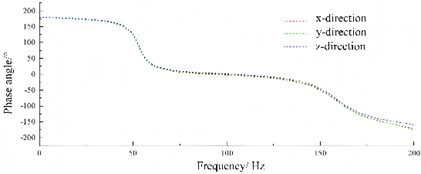
The stress results of the harmonic response analysis for the steel wire reinforced hose at the first and second natural frequencies are shown in Fig. 7. It can be seen that the hose stress exhibits a typical gradient distribution with higher values at the constraint regions at both ends and lower values in the middle of the hose body. This is because the rigid joints at both ends restrict the vibration deformation, leading to a significant stress concentration effect at the transition zones between the joints and the hose, while the flexible middle section of the hose mainly releases energy through deformation, resulting in a relatively gentle stress level. The maximum stress at the first natural frequency is 32.25 MPa, and that at the second natural frequency is 28.76 MPa, both of which appear at the transition zone between the left joint and the hose, serving as the most critical stress points of the structure. The comparison reveals that the stress peak under the first-order resonance condition is higher, which is consistent with the conclusion of the main resonance peak in the previous frequency response curve, further verifying that the first natural frequency is the core risk condition for the dynamic failure of the hose. From the axial distribution, the stress in the hose body gradually decreases from left to right in the first-order contour plot, and the stress near the right joint is significantly weaker than that near the left joint. In the second-order contour plot, a region with even lower stress appears in the middle of the hose body, and the stress concentration effect at the constraint ends is slightly weakened, reflecting the differences in deformation and stress transfer under different order modes. Overall, the constraint transition regions are the key locations for fatigue failure. Design optimization should focus on the structural transition and local strengthening of these regions, and priority should be given to avoiding the first-order main resonance frequency through modal optimization to reduce the resonance peak stress.
Fig. 7The harmonic response analysis of stress at the first and second natural frequencies
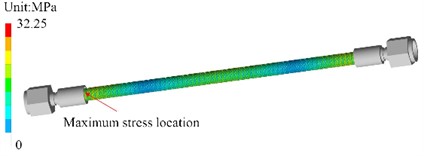
a) The first order
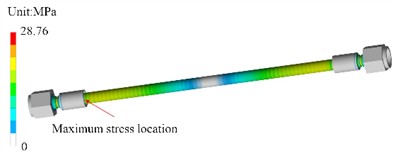
b) The second order
2.5. Random vibration analysis
Random vibration analysis is a method for analyzing the dynamic response of structures under non-deterministic, statistical excitations such as vehicle road vibration [19, 20]. Its core lies in describing the statistical characteristics of the excitation using Power Spectral Density (PSD), combining with the Frequency Response Function (FRF) of the structure, and decomposing the vibration response into contributions from each mode based on the mode superposition method, so as to finally obtain the statistical distribution of stress responses. In essence, it converts time-domain random signals into frequency-domain statistical quantities. By means of the frequency response characteristics of a linear system, it quantifies the fatigue and failure risks of the structure under random loads, which is more consistent with the actual engineering service scenario where excitations are irregular and responses exhibit statistical properties. In accordance with the national standard Test Method for Vehicle Ride Comfort (GB/T 4970-2019), the vibration PSD spectrum corresponding to typical road conditions of general roads is obtained as shown in Fig. 8(a). The random vibration analysis adopts a three-dimensional orthogonal excitation configuration. As shown in the figure, the PSD excitations are applied in three mutually perpendicular directions at both ends of the pipeline: the axial direction (-direction, along the pipeline length), and two mutually perpendicular radial directions (-direction and -direction, perpendicular to the pipeline axis). Each direction corresponds to a separate PSD curve (X_PSD, Y_PSD, Z_PSD), defining the frequency-domain characteristics of the random vibration loads. A multi-point excitation method is implemented, where the PSD excitations are simultaneously applied at both end sections of the pipeline. This approach simulates the actual multi-directional and multi-point vibration environment by synchronously loading the three-directional PSD excitations at both ends, effectively capturing the coupled dynamic responses of the pipeline under complex random vibration conditions. It can provide input loads that conform to engineering practice for the random vibration analysis of steel wire reinforced hoses, and effectively guarantee the reliability evaluation of vibration responses.
Fig. 8The result of random vibration response
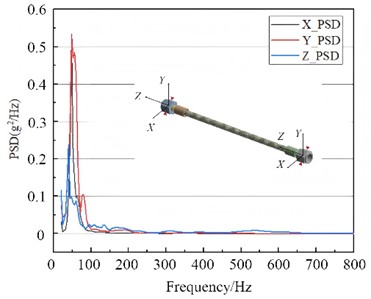
a) PSD curve of road vibration
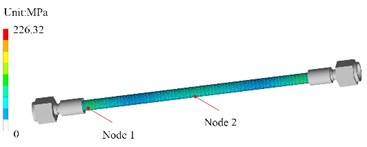
b) Cloud map of maximum stress
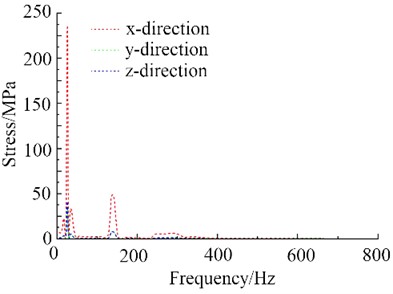
c) Response of stress peak of Node 1
d) Response of stress peak of Node 2
According to the analysis results, the contour plot of the maximum stress is shown in Fig. 8(b). It can be seen that the high-stress regions are concentrated at Node 1 near the end constraint (close to the left-end fixture) and Node 2 slightly left of the middle of the hose body. This conforms to the vibration law of stress concentration at constrained ends and stress amplification in the deformation zone of the hose body, and is fully consistent with the characteristics of fixed supports at both ends and elastic deformation of the hose body in the mode shapes. The maximum stress is 226.32 MPa, which is lower than the yield strength (345 MPa) and failure threshold (275 MPa) of Q345 connecting components, and also far lower than the yield strength (690 MPa) and failure threshold (552 MPa) of the Q690 reinforcement layer. Therefore, the metal components present no risk of strength failure under random vibration.
The stress response spectra of the key nodes are shown in Fig. 8(c) and Fig. 8(d), respectively. The results indicate that the stress responses of both nodes show prominent peaks in the low-frequency band of 0-100 Hz, which correspond exactly to the main frequency interval of the road excitation PSD and the first six modal frequencies of the hose, verifying the conclusion that low-frequency modal resonance is the core mechanism of stress amplification. The stress response decays rapidly above 200 Hz, and the influence of high-frequency excitation on structural stress is negligible. The peak stress response in the -direction is much higher than that in the - and -directions. The -direction peak of Node 1 is approximately 230 MPa, and that of Node 2 is about 220 MPa, indicating that the -direction is the dominant direction of stress response, which is consistent with the directional characteristics of the excitation PSD. The stress peak of Node 1 is slightly higher than that of Node 2, reflecting the rule of more significant stress concentration at the constrained boundary, making it the priority monitoring area for fatigue failure. The energy of road random excitation is concentrated in the low-frequency band of 0-100 Hz, which highly overlaps with the first six natural frequencies of the steel wire reinforced hose. Low-frequency modal resonance is the core cause of stress response amplification, so vibration control in this frequency band requires key attention.
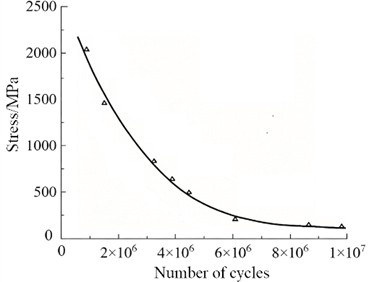
Fatigue analysis under random vibration conditions can predict the fatigue life of a specific structure under non-deterministic loads. According to the fatigue cumulative damage theory, fatigue failure of materials under variable-amplitude loads is caused by the gradual accumulation of damage from each stress cycle. Even if a single stress cycle does not exceed the material limit, failure may still occur after multiple cycles, and the core lies in quantifying the cumulative damage caused by different stress levels to the material. The S-N curve of the reinforcement layer material is shown in Fig. 9. Combined with the random vibration stress analysis results shown in Fig. 8(b), it can be concluded that the maximum stress at the end Node 1 region reaches 226.32 MPa, which falls in the medium stress range of the S-N curve, corresponding to a fatigue life of approximately 9.63×10⁶ cycles. The fatigue behavior of the steel wire reinforced hose exhibits a typical stress concentration-dominated mode. The geometric discontinuity at the transition between the end fitting and the hose leads to local stress amplification, making this region the preferred site for fatigue crack initiation. Fatigue damage accumulates approximately linearly with the number of cycles, and optimizing the end transition structure can effectively reduce stress concentration and improve the fatigue life of the hose.
Fig. 9S-N curve of reinforcement layer
3. The influence of different parameters on random vibration response
3.1. The influence of length
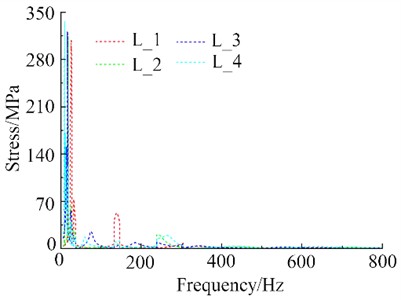
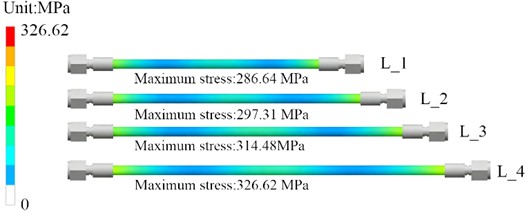
To investigate the influence of length on the anti-vibration performance of steel wire reinforced hoses, random vibration analyses were conducted at four different lengths: L_1 (200 mm), L_2 (240 mm), L_3 (280 mm), and L_4 (320 mm). The resulting stress responses are presented in Fig. 10. Regarding the effect of length on the low-frequency vibration stress peak, all four lengths of steel wire reinforced hoses exhibit the most severe stress peaks in the 0–50 Hz low-frequency band, which is the primary region of vibration energy concentration. As the hose length increases gradually from L_1 to L_4, the stress amplitude of the low-frequency main resonance peak shows a significant decreasing trend: the initial peak of L_1 approaches 330 MPa, while that of L_4 drops to below approximately 300 MPa. Meanwhile, longer lengths result in smoother and weaker secondary stress peaks in the mid-frequency band (100–300 Hz). The sharp secondary peak of the short hose L_1 at around 150 Hz nearly disappears in the long hose L_4, indicating that longer hoses can more effectively disperse vibration energy and reduce fatigue stress impacts in both low and mid-frequency bands. Concerning the effect of length on the end steady-state stress and its distribution, the maximum steady-state stress of the hose increases significantly with length, and the maximum stress for all lengths is concentrated in the transition regions between the end joints and the hose body. Shorter lengths lead to larger stress gradients in the middle pipe section and more pronounced uneven stress distribution. In contrast, longer lengths result in more uniform stress distribution in the middle region, but amplify the end stress concentration effect, with a slight expansion of the local high-stress area near the joints. This suggests that increasing length alleviates the uneven stress in the middle pipe section but exacerbates the risk of static strength failure at the ends.
Fig. 10Random vibration response results under different length conditions
a) Frequency response curve of stress
b) Cloud map of stress
To further reveal the potential effects induced by end stress concentration, mechanical mechanism analyses are conducted from the perspectives of stiffness variation, boundary constraint effects, and load transfer characteristics, respectively. In terms of stiffness variation, due to the relatively high elastic modulus or large cross-sectional stiffness of the end joint components, the deformation compatibility requirement forces stresses to concentrate at the stiffness mutation interface, resulting in stress peaks. With the change of structural parameters, the difference in stiffness ratio between the end and the main body is altered, which directly affects the magnitude and distribution range of the stress concentration factor. Regarding boundary constraint effects, the end of the pipeline is subjected to strong geometric and mechanical constraints, which restrict the free deformation of the end section and thus cause local stress accumulation. When parameters such as constraint stiffness, connection mode, or clearance fit are varied, the degree of deformation restriction at the end is adjusted. In terms of load transfer and distribution mechanism, vibration loads are transferred from the end to the pipeline main body through the joint interface. At the contact surfaces, loads are redistributed due to local contact pressure, friction, and geometric discontinuities. When parameters such as excitation frequency, PSD amplitude, or excitation direction change, the resonant responses and dynamic amplification effects at the end are modified, leading to distinct stress distribution characteristics. In particular, when the excitation frequency approaches the natural frequency of the end joint, the dynamic load amplification effect is significantly enhanced, resulting in a further increase in stress concentration.
Combining the spectral response and cloud chart results, length variation presents a bidirectional trade-off effect on hose failure risk: in terms of vibration fatigue, longer hoses (L_3, L_4) effectively suppress the main resonance and mid-frequency stress peaks, delaying the initiation and propagation of fatigue cracks, making them particularly suitable for working conditions dominated by low-frequency random vibration, such as engines and pumps. On the static strength side, excessively long hoses push end stresses close to or even beyond the material's allowable limit, increasing the risk of joint pull-out and pipe wall tearing. Short hoses (L_1, L_2), while controlling end static strength, exhibit severe low-frequency vibration responses and sharp secondary peaks, making them more prone to fatigue fracture under repeated vibration. In engineering design, length selection must be tailored to the operating conditions. If the working environment is dominated by low-frequency random vibration, L_3 is preferred: it suppresses low-frequency vibration peaks and smooths mid-frequency stresses while keeping the maximum end stress (314.48 MPa) within an acceptable range, achieving an optimal balance between fatigue life and static strength. If the material's allowable stress is low or joint stiffness is high, L_2 can be selected as a downgraded option to limit end stress to 297.31 MPa while moderately mitigating low-frequency vibration. Additionally, for the selected length, steel wire reinforcement layers or flexible transition structures can be added at the end transition regions to further offset the end stress concentration caused by longer lengths, thereby minimizing the combined negative effects of vibration and static loading.
3.2. The influence of wall thickness
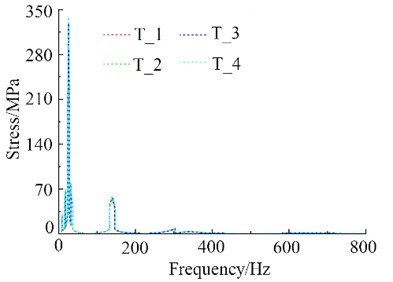
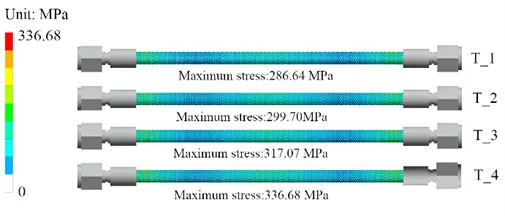
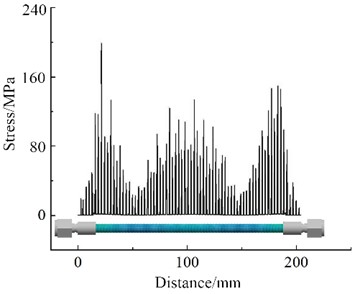
In order to obtain the influence of wall thickness on the anti-vibration performance of steel wire reinforced hoses, random vibration analyses were conducted at four different wall thicknesses: T_1 (0.9 mm), T_2 (0.85 mm), T_3 (0.8 mm), and T_4 (0.75 mm). The resulting stress responses are presented in Fig. 11. Regarding the effect of wall thickness on the low- and mid-frequency vibration stress peaks, it can be clearly seen from the stress spectrum response diagram that all four wall thicknesses of steel wire reinforced hoses exhibit the most severe stress peaks in the 0–50 Hz low-frequency band, which is the core region of vibration energy concentration. As the hose wall thickness gradually decreases from T_1 to T_4, the stress amplitude of the low-frequency main resonance peak shows a significant increasing trend: the initial peak of T_1 is approximately 320 MPa, while that of T_4 approaches nearly 340 MPa. Meanwhile, in the 100-200 Hz mid-frequency band, thinner wall thicknesses result in sharper and higher secondary stress peaks. The secondary peak of T_4 is notably higher than that of T_1, and the sharp secondary peak of the thick-walled hose T_1 at around 150 Hz is further amplified in the thin-walled hose T_4. This indicates that thinner hoses concentrate vibration energy and amplify fatigue stress impacts in both low- and mid-frequency bands, whereas thicker-walled hoses can effectively disperse vibration energy and suppress peak stresses. Concerning the effect of wall thickness on the end steady-state stress and its distribution, the stress cloud diagram results show that the maximum steady-state stress of the hose increases linearly with decreasing wall thickness, and the maximum stress for all wall thicknesses is concentrated in the transition regions between the end joints and the hose body. Larger wall thicknesses lead to smaller stress gradients in the middle pipe section and more uniform stress distribution. In contrast, smaller wall thicknesses increase the stress gradient in the middle region, while significantly amplifying the end stress concentration effect and slightly expanding the range of local high-stress areas near the joints. This suggests that reducing wall thickness exacerbates uneven stress distribution in the pipe body and substantially increases the risk of static strength failure at the ends, whereas thicker-walled hoses alleviate uneven stress and reduce the risk of high end stresses.
Combining the spectral response and cloud chart results, wall thickness variation presents a bidirectional trade-off effect on hose failure risk. In terms of vibration fatigue, thick-walled hoses (T_1, T_2) effectively suppress the main resonance and mid-frequency stress peaks, delaying the initiation and propagation of fatigue cracks, making them particularly suitable for working conditions dominated by low-frequency random vibration, such as engines and pumps. Thin-walled hoses (T_3, T_4) exhibit severe vibration responses and higher peaks, making them more prone to fatigue fracture under repeated vibration. On the static strength side, thick-walled hoses have lower maximum end stresses and greater static strength safety margins. Thin-walled hoses push end stresses close to or even beyond the material's allowable limit, significantly increasing the risk of joint pull-out and pipe wall tearing. If the working environment is dominated by low-frequency random vibration, T_2 is preferred: it suppresses low-frequency vibration peaks and smooths mid-frequency stresses while keeping the maximum end stress (299.70 MPa) within an acceptable range, achieving an optimal balance between fatigue life, static strength, and material cost. If the operating conditions involve extremely severe vibration or the material's allowable stress is low, T_1 can be selected as an upgrade to further reduce the low-frequency vibration peak and control the end stress at 286.64 MPa, maximizing safety. If further cost control is required and the material's allowable stress is high, T_3 can be cautiously selected, but the end static strength must be strictly verified. The use of T_4 is not recommended under severe vibration conditions, as both its low-frequency peak and end stress approach critical values, resulting in a relatively higher failure risk.
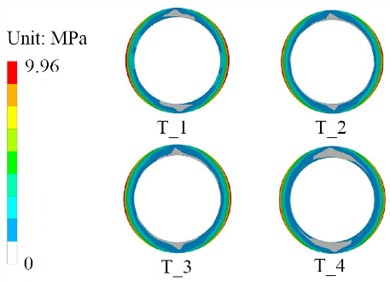
To ensure the failure risk of the inner tube layer, the stress distribution of the inner tube layer was calculated and shown in Fig. 11(c). It can be seen that under random vibration conditions, the stress distribution of the inner tube layer presents a symmetric pattern with peak stresses concentrated at the top and bottom inner walls, reaching a maximum of 9.96 MPa across all four cases (T_1 to T_4). This stress level remains below the material yield strength of 11.58 MPa, indicating no risk of yielding, and is significantly lower than the seismic failure threshold of 24.59 MPa, demonstrating sufficient safety margin against catastrophic failure. However, cases T_1 and T_4 exhibit larger high-stress regions, suggesting potential fatigue damage accumulation risks at these locations during long-term service, despite the overall stress being within safe limits.
Fig. 11Random vibration response results under different wall thickness conditions
a) Frequency response curve of stress
c) Cloud map of inner tube layer stress
b) Cloud map of overall stress
3.3. The influence of oil pressure
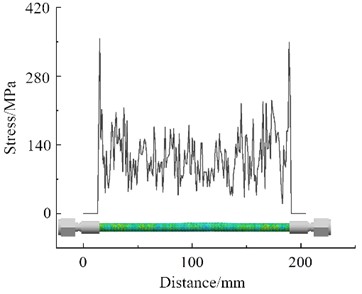
To investigate the effect of oil pressure on the vibration resistance characteristics of steel wire reinforced hoses, random vibration analyses were performed under oil pressures of P_1 (0 MPa), P_2 (6 MPa), P_3 (9 MPa) and P_4 (12 MPa) respectively. The obtained stress response results are presented in Fig. 12. With respect to the influence of oil pressure on the spectral response of vibrational stress, it can be clearly seen from the stress spectral response diagrams that changes in oil pressure significantly modify the vibrational stress distribution characteristics of steel wire reinforced hoses. Under the zero-oil-pressure condition (P_1), the stress response is dominated by discrete sharp peaks, which are mainly concentrated in the 0-200 Hz frequency band. There are a large number of peaks with relatively low amplitudes (the maximum amplitude is about 220 MPa), and the vibrational energy is distributed dispersedly. Under the high oil pressure condition (P_4), the stress response transforms into a continuous broadband fluctuation pattern, with denser peaks and a remarkably elevated overall amplitude; the maximum stress approaches 400 MPa, and the vibrational energy is concentrated and released over a wider frequency range. As the oil pressure gradually increases from P_1 to P_4, the vibrational stress evolves from “discrete narrowband peaks” to “continuous broadband high-amplitude fluctuations”, and the stress response in the high-frequency band is also significantly activated. This demonstrates that an increase in oil pressure subjects the hose to sustained high-stress impacts across a broader frequency band, thus aggravating the risk of fatigue damage. Regarding the effect of oil pressure on the maximum steady-state stress and its distribution, the stress nephogram results indicate that the maximum steady-state stress of the hose shows a linear increasing trend with the rise of oil pressure. The stress concentration effect at the end parts and the hose body is significantly amplified, leading to the widest coverage of high-stress regions. Under all working conditions, the maximum stress is concentrated in the transition zones between the end joints and the hose body. The higher the oil pressure, the more pronounced the stress concentration at the end parts, and the overall stress level of the hose body rises synchronously.
Fig. 12Random vibration response results under different oil pressure conditions
a) Frequency response curve of stress with P_1 condition
b) Frequency response curve of stress with P_4 condition
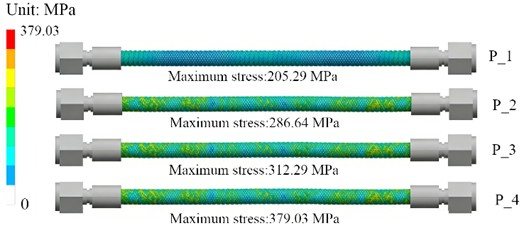
c) Cloud map of stress
By synthesizing the spectral response and nephogram results, an increase in oil pressure broadens the frequency band of vibrational energy distribution, causing the hose to withstand sustained high-amplitude stress over a wider frequency range and simultaneously raising the probability of fatigue damage in the high-frequency band. In terms of static strength, oil pressure as a preload directly elevates the baseline stress level of the hose. The maximum stress increases linearly with oil pressure, and the maximum end stress under high oil pressure conditions is close to the allowable limit of the material, which significantly increases the risk of static strength failures such as joint pull-off and pipe wall tearing. In brief, the higher the oil pressure, the more the hose is exposed to the dual threats of more severe broadband vibration fatigue and higher static strength failure, with the failure risk rising at an accelerated rate. For high oil pressure working conditions, it is recommended to add a steel wire reinforcement layer or a flexible buffer structure in the end transition zones to alleviate end stress concentration and offset the static strength disadvantage caused by elevated oil pressure. Meanwhile, optimizing the installation boundaries to avoid resonance with the main vibration frequencies of the system can further reduce fatigue damage.
4. Conclusions
1) It can be obtained from harmonic response analysis and random vibration analysis that the resonance risk and frequency response characteristics of steel wire reinforced hoses are clearly defined. The first 6 orders of natural frequencies of the model are covered in the range of 66.311-108.877 Hz, which are highly overlapped with the 0-100 Hz energy-concentrated frequency band of the road excitation PSD curve. Among them, the 1st-2nd order modes (66.311 Hz, 74.434 Hz) are consistent with the main frequency interval of excitation and are regarded as the primary resonance risk sources. The -direction peak stresses of the key nodes (Node 1, Node 2) of the model are reached to 230 MPa and 220 MPa respectively, and a coupling amplification effect is formed with the excitation direction. The low-order mode shapes are presented as single-wave overall bending deformation, and the stresses in the deformation-concentrated areas are exhibited a gradient increase with the rise of modal order, by which the fatigue damage risk is further amplified.
2) The strength safety margins of each component of the steel wire reinforced hose are significantly differentiated. Quantitative assessment of the strength and failure risk of each component of the hose is carried out based on the stress contour and node response data obtained from random vibration analysis. The maximum stress of the model is 226.32 MPa, which is concentrated in the end constraint zone. This value is far lower than the failure threshold and yield strength of Q345 connectors, indicating that no plastic yielding or fracture risk is imposed on the metal reinforcement layer and connectors under random vibration. The failure threshold of the PTFE inner tube is only 24.59 MPa. Although its stress under random vibration is not directly raised to this value, as a flexible functional layer, it is prone to large deformation under the coupling of low-order mode overall bending and high-frequency vibration, by which interface debonding and sealing failure are induced. Moreover, its stiffness is much lower than that of metal parts and its deformation coordination ability is weak, so it is regarded as the core control object for the sealing reliability of the hose. The peak stress in the end constraint zone is higher than that in the deformation zone of the hose body, which reflects the stress concentration effect caused by boundary constraints and is recognized as the priority area for fatigue crack initiation.
3) The accuracy and engineering applicability of the established finite element model are verified through the coupled verification of bench test and simulation results. The deviations between the simulated and tested values of the first 6 order modal frequencies are all controlled below 5 %. The stress response trends of key nodes are highly matched with the PSD excitation frequency band, and the high-stress distribution areas of the stress contour are completely overlapped with the deformation-concentrated areas of the mode shapes, which proves that the real vibration and stress behaviors of the hose can be accurately reflected by the model.
4) In subsequent research, emphasis will be placed on investigating the influence of thermal stress under high-temperature environments on the dynamic strength and fatigue analysis results of steel wire reinforced hoses, and temperature-structure coupled field analysis will be introduced. Meanwhile, the influence weight of temperature variation on structural reliability will be further demonstrated, and its action mechanism under extreme service conditions will be evaluated, so as to further improve the design reliability and engineering applicability of such components under complex multi-field coupling conditions.
References
-
M. Picard, C. Baelden, T. Tian, T. Nishino, E. Arai, and H. Hidaka, “Oil transport cycle model for rotary engine oil seals,” Journal of Engines, Vol. 7, No. 3, pp. 1466–1476, Apr. 2014, https://doi.org/10.4271/2014-01-1664
-
Y. Yang, F. Wang, F. Wen, and J. Jin, “Research on safety of aero-engine oil pipe under heating conditions based on fluid-solid thermal coupling,” Materials, Vol. 17, No. 21, p. 5137, Nov. 2024, https://doi.org/10.3390/ma17215137
-
X. Zhang, G. Cheng, and J. Tian, “Effects of clamp width on vibration features of fuel pipeline of aero-engine,” International Journal of Wireless and Mobile Computing, Vol. 21, No. 2, p. 153, Jan. 2021, https://doi.org/10.1504/ijwmc.2021.120020
-
A. Daşdemir, “A modal analysis of forced vibration of a piezoelectric plate with initial stress by the finite-element simulation,” Mechanics of Composite Materials, Vol. 58, No. 1, pp. 69–80, Mar. 2022, https://doi.org/10.1007/s11029-022-10012-7
-
P. Purwanto, N. F. Qaidahiyani, M. S. Ikbal, and D. Djamaluddin, “Shear strength analysis of rock due to the effect of surface roughness based on laboratory testing and numerical modeling,” Materials Science Forum, Vol. 1091, No. 1, pp. 81–92, Jun. 2023, https://doi.org/10.4028/p-q863a9
-
J. Wang, C. Xu, Y. Xu, X. Qi, Z. Liu, and H. Tang, “Vibration analysis and parameter optimization of the longitudinal axial flow threshing cylinder,” Symmetry, Vol. 13, No. 4, p. 571, Mar. 2021, https://doi.org/10.3390/sym13040571
-
D. Perfetto, C. Pezzella, V. Fierro, N. Rezazadeh, A. Polverino, and G. Lamanna, “FE modelling techniques for the simulation of guided waves in plates with variable thickness,” Procedia Structural Integrity, Vol. 52, No. 1, pp. 418–423, Jan. 2024, https://doi.org/10.1016/j.prostr.2023.12.042
-
O. Jassinbekov, M. Isametova, and G. Kaldan, “Development of a technique for computer simulation of the stress state of the drive drum shell of a belt conveyor to optimize its design parameters,” Eastern-European Journal of Enterprise Technologies, Vol. 2, No. 7 (110), pp. 31–39, Apr. 2021, https://doi.org/10.15587/1729-4061.2021.229213
-
Z. Ying, Z. Lin, Z. Wu, K. Liang, and X. Hu, “A modified-YOLOv5s model for detection of wire braided hose defects,” Measurement, Vol. 190, p. 110683, Feb. 2022, https://doi.org/10.1016/j.measurement.2021.110683
-
G. Sun, L. Mao, X. Li, X. Sun, and N. Huo, “Fracture analysis for reasons of bellows with braided hose,” IOP Conference Series: Materials Science and Engineering, Vol. 892, No. 1, p. 012109, Jul. 2020, https://doi.org/10.1088/1757-899x/892/1/012109
-
A. N. Murzin and A. I. Belousov, “Analysis of flexible metal hoses frequency characteristics,” Procedia Engineering, Vol. 176, pp. 66–70, Jan. 2017, https://doi.org/10.1016/j.proeng.2017.02.274
-
K. Fujimoto, H. Fujiki, M. Daimaruya, and H. Yamada, “Relationship between internal pressure strength of flexible metal tubes and bellows shapes,” Strength, Fracture and Complexity, Vol. 16, No. 1, pp. 27–45, Jun. 2023, https://doi.org/10.3233/sfc-232000
-
J. R. Cho, “Anisotropic large deformation and fatigue damage of rubber-fabric braid layered composite hose,” Procedia Engineering, Vol. 173, pp. 1169–1176, Jan. 2017, https://doi.org/10.1016/j.proeng.2016.12.097
-
H. D. Chalak, A. M. Zenkour, and A. Garg, “Free vibration and modal stress analysis of FG-CNTRC beams under hygrothermal conditions using zigzag theory,” Mechanics Based Design of Structures and Machines, Vol. 51, No. 8, pp. 4709–4730, Aug. 2023, https://doi.org/10.1080/15397734.2021.1977659
-
J. Wang, Y. Nie, H. Yuan, and H. Song, “Thermal-structural and prestressed modal analyses for a solar sail with nonlinear shape memory alloy spring,” Advances in Space Research, Vol. 74, No. 4, pp. 1770–1780, 2024, https://doi.org/10.1016/j.asr.2024.05.047
-
B. K. Meisuh, J. Huh, A. Haldar, and I.-T. Kim, “Comparison of seismic responses of a jumbo-size container crane retrofitted with braces, dampers, and isolation systems,” Ocean Engineering, Vol. 262, p. 112222, Sep. 2022, https://doi.org/10.1016/j.oceaneng.2022.112222
-
B. Nguyen, J. Seo, J. Huh, J.-H. Ahn, and A. Haldar, “Seismic response investigation of 1/20 scale container crane through shake table test and finite element analysis,” Ocean Engineering, Vol. 234, No. 1, p. 109266, Aug. 2021, https://doi.org/10.1016/j.oceaneng.2021.109266
-
H. T. Lima, L. E. de M. Alas, M. N. A. Nunes, D. M. de Lima, and I. Da S. Medeiros, “Experimental and numerical modal evaluation of profiled steel decking floor slabs in a container house using MEMS,” Engineering Structures, Vol. 308, p. 117991, Jun. 2024, https://doi.org/10.1016/j.engstruct.2024.117991
-
Y. Lu et al., “Modal investigation on a large-scale containership model for hydroelastic analysis,” Shock and Vibration, Vol. 2022, No. 1, pp. 1–11, May 2022, https://doi.org/10.1155/2022/2539870
-
M. Hamaguchi and T. Yajima, “Vibration control for sloshing in liquid container in cart with active vibration reducer (transfer on an uneven road),” Mechanical Engineering Journal, Vol. 10, No. 4, pp. 23–136-23-00136, Sep. 2023, https://doi.org/10.1299/mej.23-00136
About this article

The authors have not disclosed any funding.
The datasets generated during and/or analyzed during the current study are available from the corresponding author on reasonable request.
The authors declare that they have no conflict of interest.
