Abstract
Abnormal vibration is one of the primary causes of high-pressure fuel pipe failure. To investigate the vibration characteristics of a high-pressure fuel pipe under combined diesel engine excitation and fuel pressure pulsation, a two-way fluid–structure interaction (FSI) model was established. A comparative analysis of the dry and wet modal characteristics was first performed. Based on the prescribed diesel engine vibration displacement, the vibration responses of the high-pressure fuel pipe with and without diesel engine excitation were compared. Furthermore, the effects of different engine loads (50 %, 75 %, and 100 %) and inlet pressure levels (36, 38, 40, 42, and 44 MPa) on the vibration energy distribution were investigated through spectral analysis. The results show that the natural frequencies of the high-pressure fuel pipe decrease under fluid-structure interaction, with the frequency reduction becoming more pronounced in higher-order modes. When diesel engine excitation is considered, the peak vibration displacement decreases slightly, while the vibration attenuation rate decreases, resulting in a longer vibration response duration. As the engine load increases, the vibration displacement increases, and the spectral components near the second and fourth wet modal frequencies become more pronounced under the full-load condition. Increasing the inlet pressure also leads to a progressive increase in the spectral amplitude, particularly near the fourth wet modal frequency. These findings provide theoretical support for vibration assessment and structural optimization of marine high-pressure fuel pipes.
1. Introduction
The high-pressure fuel pipe is a core component of the diesel engine fuel injection system, whose primary function is to ensure stable fuel delivery under high-pressure conditions. With the development of marine diesel engines toward higher power density and lower emissions, the injection pressure continues to increase, resulting in more pronounced fuel pressure fluctuations inside the pipe. Meanwhile, structural vibrations generated during engine operation superimpose with pressure pulsations, thereby exciting more complex dynamic responses of the pipe. Under the combined effects of fluid–structure interaction (FSI) and mechanical excitation, the high-pressure fuel pipe is subjected not only to alternating loads but also to strong vibrational characteristics. Such vibrations weaken the stability and accuracy of fuel injection and may further induce sealing failures, fatigue cracks, or even fracture, posing a severe threat to the safe and reliable operation of the engine [1]. Previous studies have shown that low-frequency resonance and vibration-induced fatigue are important factors contributing to the failure of high-pressure fuel pipes [2], and these phenomena are generally associated with alternating stresses caused by pressure fluctuations and structural vibrations [3].
In recent years, there has been extensive research on the vibration issues of high-pressure fuel pipes. Early studies mainly adopted experimental methods. Many test platforms were established, and multiple acceleration sensors were used to collect vibration signals for feature extraction and characteristics analysis. Qiao et al. [4] carried out time-frequency analysis on the vibration signals of high-pressure pipes under different fault states, and proposed a fault diagnosis method for the injection system based on vibration features. Bai et al. [5] investigated the frequent fracture problem of high-pressure pipes in WD615 engines through experiments, and found that resonance frequencies overlapping with commonly used engine speeds were the main cause of failure. They further improved the support stiffness to avoid the resonance region. Du [6] analyzed vibration test data and pointed out that the Bourdon effect was one of the main mechanisms causing vibration of high-pressure pipes.
With the rapid development of computational technology, finite element method (FEM) has gradually become a key approach for studying the vibration characteristics of high-pressure pipes. Xin et al. [7] used OptiStruct software to analyze the vibration response of the high-pressure pipe system in a certain engine model. By optimizing the piping layout, they effectively reduced the dynamic response of the high-pressure pipe system, and obtained a moderate acceleration and dynamic stress level. Shen et al. [8] conducted modal analysis of both the engine body and its high-pressure pipe system. Combined with NVH vibration test results, it was identified that pipe clamp fractures and thread damage were mainly caused by vibration resonance, and some solutions, such as shortening the pipe length and adding more clamps, were proposed to adjust the natural frequency. AbiarKashani et al. [9] addressed vibration failure in high-pressure pipes by integrating finite element simulation with experimental testing. They proposed a pipe geometry optimization method based on the non-dominated sorting genetic algorithm (NSGA-II) to minimize the maximum Von Mises stress and maximize the first-order natural frequency. Otipka et al. [10] conducted experimental modal analysis and finite element modeling of high-pressure injection pipes and revealed that when the engine operating frequency coincides with the natural frequency of the pipe, cracks and failures are highly likely to occur. They further proposed enhancing the natural frequency and reducing the risk of resonance by optimizing the clamping positions. Patil et al. [11], focusing on a diesel engine injection pipe, combined finite element modal and harmonic response analyses with experimental validation, and pointed out that the position and number of clamps have a significant influence on vibration amplitude and fatigue failure.
Considering the significant influence of internal pressure pulsations on pipe vibration, Xing et al. [12] used a local stress–strain experimental method to measure vibration strain in high-pressure fuel pipes. Their results indicated that the cyclic pressure from high-pressure fuel inside the pipe was the main cause of pipe wall oscillation. Computational fluid dynamics (CFD) simulation of the internal flow field was used to identify potential failure locations. Tian et al. [13] performed CFD simulation to obtain the fuel pulse pressure distribution, and developed a coupled FSI model for the high-pressure fuel pipe to analyze its vibration characteristics. By incorporating engine vibration excitation, material properties, and transfer functions, they predicted the pipe's fatigue life using the fatigue damage accumulation theory and analyzed the impact of fuel pulse pressure on its lifespan. Fan et al. [14] established a finite element model of the high-pressure fuel pipe and investigated its vibration response under FSI. They discussed the influence of fuel pulsation ratio and fuel pressure on pipe vibration behavior. Li et al. [15] conducted a reliability analysis based on a fluid–structure interaction model and found that the presence of fuel reduces the natural frequency of the pipe, with maximum stress and vibration velocity concentrated near the first-order modal frequency. Moreover, fuel pulsations significantly increase the risk of fatigue crack initiation, highlighting the necessity of comprehensively considering fluid–structure interaction in reliability and service life predictions.
Despite these valuable contributions, most existing studies focus on a single excitation source, typically considering either mechanical excitation or fuel pressure pulsation alone. Systematic investigations into the combined effects of fluid-structure interaction and diesel engine vibration excitation remain limited. Therefore, this study establishes a two-way fluid-structure interaction model of a high-pressure fuel pipe by simultaneously considering fuel pressure pulsation and diesel engine vibration excitation. The vibration characteristics under different engine loads and inlet pressure conditions are systematically investigated. The findings are expected to provide theoretical support for the vibration assessment, structural optimization, and intelligent vibration monitoring of marine high-pressure fuel pipes.
2. Theoretical background
To facilitate the theoretical derivation, the following assumptions are adopted in this study.
The high-pressure fuel pipe is treated as a slender bent beam with small deformation.
The internal fuel is regarded as a compressible viscous fluid, and only the dominant axial pulsation along the pipe centerline is considered.
The influence of pipe geometry on the conversion of the pressure-gradient-induced axial fluid force into transverse structural excitation is represented by an equivalent geometric projection coefficient .
The diesel engine vibration is simplified as a harmonic excitation with the total firing frequency component.
2.1. Structural dynamic modeling
During operation, the high-pressure fuel pipe is subjected not only to internal fuel pulsation, but also to external vibration transmitted from the diesel engine. Since the investigated pipe is a bent slender structure with curved and inclined segments, its dynamic behavior is influenced by bending deformation, shear deformation, and rotary inertia simultaneously. Therefore, the Timoshenko beam theory is adopted to describe the structural vibration of the high-pressure fuel pipe, which provides a more accurate representation than the classical Euler-Bernoulli beam model for this type of structure [16].
For theoretical modeling, the pipe is described along its centerline, and the arc-length coordinate is denoted by . Let be the transverse displacement of the pipe and the rotational angle of the cross-section. The governing equations for the structural vibration of the pipe can be expressed as:
where is the material density of the pipe, is the cross-sectional area, is Young’s modulus, is the second moment of area, is the shear modulus, and is the shear correction factor. In addition, represents the equivalent distributed load induced by internal fuel pulsation, and denotes the external excitation transmitted from the diesel engine.
Eq. (1-2) constitute the structural dynamic model of the high-pressure fuel pipe, in which both bending and shear effects are taken into account.
2.2. Fluid pulsation pressure modeling
Under the periodic action of the high-pressure fuel pump, the fuel inside the high-pressure pipe exhibits obvious pulsating flow characteristics. In order to describe the fluid dynamic behavior in a simplified but physically meaningful manner, a one-dimensional linearized pulsation model is established along the pipe centerline [17]. The effects of fuel compressibility and viscosity are considered.
Accordingly, the continuity equation of the internal fuel can be written as:
And the momentum equation is expressed as:
where is the pulsation pressure of the fuel, is the axial flow velocity, is the fuel density, is the dynamic viscosity, and is the acoustic wave speed in the fuel.
In Eq. (3), the term on the right-hand side represents the equivalent influence of pipe wall vibration on the local fluid volume variation. This term is introduced to account for the coupling effect between the structural motion of the pipe and the pulsating flow of the internal fuel. Therefore, Eq. (3-4) describe the basic pulsation characteristics of the internal fuel and provide the fluid dynamic basis for the subsequent two-way fluid–structure interaction analysis.
2.3. Diesel engine vibration excitation
In actual operating conditions, the high-pressure fuel pipe is also affected by the vibration of the diesel engine. Such excitation mainly originates from combustion pressure fluctuations, reciprocating and rotating inertia forces of moving components, and additional dynamic loads caused by transmission and installation conditions [18]. These vibrations are transmitted to the high-pressure fuel pipe through the engine body, mounting supports, and connected structures.
For theoretical analysis, the diesel engine vibration is simplified as a harmonic excitation with a dominant low-frequency component, which can be expressed as:
where is the excitation amplitude, is the angular frequency, and is the initial phase angle.
Although the actual engine vibration may contain multiple harmonic components, the total firing frequency component generally dominates the vibration energy, whereas the higher-order harmonics contribute relatively little [19]. Therefore, the simplified harmonic excitation adopted in Eq. (5) is sufficient for describing the dominant excitation characteristics and revealing the basic dynamic response mechanism of the high-pressure fuel pipe.
2.4. Fluid-structure coupled equation
For the high-pressure fuel pipe investigated in this study, the geometric configuration includes curved and inclined segments rather than a straight uniform tube. Under such circumstances, the internal pressure pulsation and the associated flow momentum variation can generate equivalent distributed excitation on the pipe structure. Owing to the geometric effect of the bent pipe, part of the fluid-induced load can be transformed into a transverse excitation component that contributes to the vibration response of the pipe.
Therefore, the distributed force exerted by the internal fluid on the pipe is simplified as:
where is a dimensionless equivalent geometric projection coefficient used to represent the conversion of the pressure-gradient-induced axial fluid force into transverse structural excitation. Its magnitude depends mainly on the spatial orientation of the pipe, the inclination of the straight segments, and the number and curvature of the bent sections. The negative sign indicates that the equivalent fluid-induced force acts opposite to the pressure gradient, i.e., from the high-pressure region toward the low-pressure region.
It should be emphasized that is a normalized equivalent geometric projection coefficient used only in the reduced-order theoretical model, with . For an ideal straight pipe, approaches zero, while stronger curvature or inclination generally increases the transverse projection of the fluid-induced force, with approaching unity in the limiting case of nearly complete transverse projection. Its effective value depends on the pipe curvature, bend angle, and spatial configuration. In the subsequent three-dimensional FSI simulations, these geometric effects are represented directly by the actual pipe geometry and two-way coupling procedure; therefore, is not prescribed as an independent numerical parameter.
By substituting Eqs. (5-6) into the structural vibration equations and combining them with the fluid pulsation equations, the governing equations of the high-pressure fuel pipe under fluid-structure interaction can be obtained as:
where Eq. (7) represents a simplified reduced-order description of the coupled dynamic mechanism of the bent high-pressure fuel pipe. It illustrates the interaction among internal fuel pulsation, external engine-induced excitation, and structural vibration of the pipe. The equation set is introduced primarily to clarify the physical coupling relationships rather than to serve as the direct governing equations for the subsequent numerical solution. In the following three-dimensional two-way FSI analysis, the actual pipe geometry and fluid-structure interaction are directly resolved using Fluent, Transient Structural, and System Coupling.
3. Geometric model of the high-pressure fuel pipe
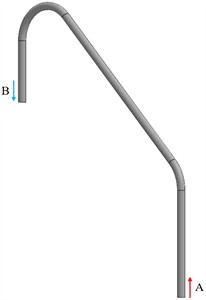
The high-pressure fuel pipe in the fuel injection system of the 6S35ME-B9 marine diesel engine was selected as the research object. A three-dimensional geometric model, as shown in Fig. 1, was established to account for the combined effects of diesel engine vibration excitation and internal fuel pressure pulsation on the vibration response of the high-pressure fuel pipe.
In the model, end A was defined as the high-pressure fuel inlet connected to the fuel pump, while end B was defined as the high-pressure outlet connected to the injector. Both ends of the high-pressure fuel pipe were fixed using bolted connections, forming fixed boundary supports.
The outer diameter of the high-pressure fuel pipe was 28 mm and the inner diameter was 20 mm. The pipe was modeled using structural steel with a density of 7850 kg/m3, a Poisson’s ratio of 0.3, and an elastic modulus of 210 GPa. The working fluid was defined as diesel-1-fuel using the ANSYS Fluent material database. Its density, dynamic viscosity, and acoustic wave speed were specified as 846 kg/m3, 0.0029 Pa·s, and 1331 m/s.
4. Wet modal analysis of the high-pressure fuel pipe
Modal characteristics represent the inherent vibration properties of mechanical structures. Since the high-pressure fuel pipe is filled with fuel during operation, a wet modal analysis is required to account for the added-mass and fluid-coupling effects of the internal fuel.
Fig. 1Geometric model of the high-pressure fuel pipe
4.1. Mesh independence verification
To ensure the reliability and accuracy of the simulation results, a mesh independence analysis was conducted. Under consistent boundary conditions, four finite element models with different mesh densities were developed. The maximum element sizes for the four mesh schemes were set to 5 mm, 4 mm, 3 mm, and 2 mm, respectively. The structural deformation response of the high-pressure pipe was calculated under steady-state conditions with an inlet pressure of 40 MPa and an outlet pressure of 1.8 MPa.
The total number of mesh elements, the corresponding maximum deformation values, and the relative errors with respect to the finest mesh (Model 4) are summarized in Table 1. The relative error decreases from 13.87 % for Model 1 to 3.18 % for Model 2 and further to 0.58 % for Model 3, indicating that the numerical solution has essentially converged. Although Model 4 provides the finest mesh, the improvement in the maximum deformation compared with Model 3 is only 0.002 mm (relative error 0.58 %), while the computational time increases from 80 min to 600 min. Therefore, Model 3 was adopted for all subsequent analyses because it provided a reasonable compromise between computational accuracy and efficiency.
Table 1Mesh independence verification results
Model number | Max element size / mm | Min element size / mm | Boundary layers | Total elements | Max deformation / mm | Relative error / % | Computational time / min |
1 | 5 | 2 | 5 | 166893 | 0.394 | 13.87 | 4 |
2 | 4 | 2 | 5 | 315048 | 0.357 | 3.18 | 18 |
3 | 3 | 2 | 5 | 715001 | 0.348 | 0.58 | 80 |
4 | 2 | 2 | 5 | 2588308 | 0.346 | 0 | 600 |
4.2. Wet modal analysis
In this study, an acoustic-structure coupling algorithm was employed, and the Modal Acoustics module in ANSYS Workbench was used to perform the wet modal analysis of the high-pressure fuel pipe.
The pipe structure was defined as a solid domain, while the fuel was defined as a fluid domain. Both domains were discretized using tetrahedral elements. The meshing results are shown in Fig. 2. The fluid domain was assigned as an acoustic fluid through the Acoustic Body setting, and the inner wall of the pipe was defined as a Fluid-Structure Interaction (FSI) interface. The inlet and outlet surfaces were set as pressure-loaded boundaries, and both ends of the pipe were fixed.
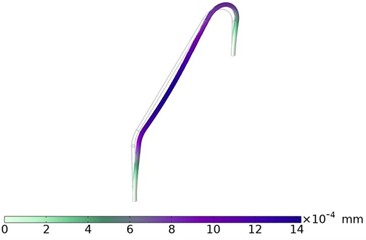
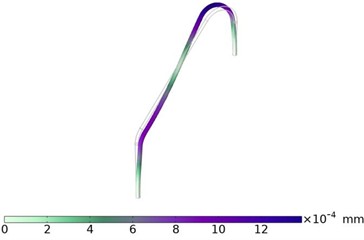
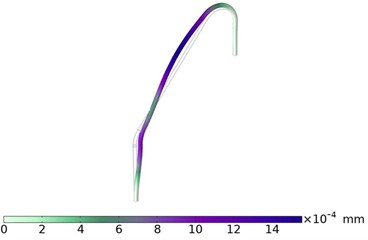
The first four wet mode shapes and each corresponding natural frequency of the high-pressure fuel pipe were obtained through this analysis, as illustrated in Fig. 3.
Fig. 2Meshing result of the high-pressure fuel pipe.
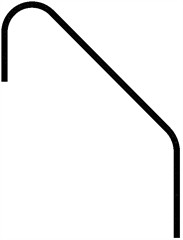
a) Overall mesh diagram
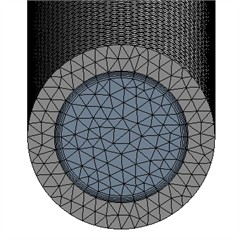
b) Local view at the inlet (blue region represents the fluid domain)
Fig. 3The first four wet mode shapes
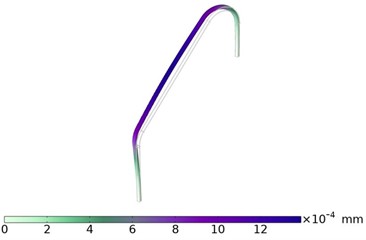
a) First mode. Eigenfrequency = 47.674 Hz
b) Second mode. Eigenfrequency = 76.716 Hz
c) Third mode. Eigenfrequency = 101.02 Hz
d) Fourth mode. Eigenfrequency = 149.8 Hz
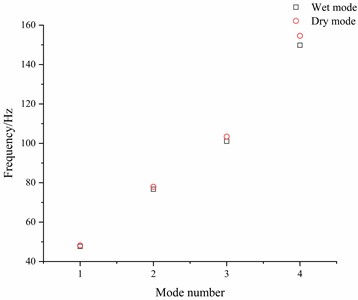
To further analyze the influence of the internal fluid on the structural modal characteristics, a comparison between the natural frequencies under dry and wet conditions was conducted. The results are presented in Fig. 4.
It can be observed that the presence of fuel inside the pipe significantly affects the modal behavior of the structure under fluid-structure interaction [20]. Specifically, all modal frequencies exhibit a degree of reduction. The frequency reduction rates for the first to fourth modes are 1.03 %, 1.61 %, 2.30 %, and 3.10 %, respectively.
This indicates that the frequency drop becomes more pronounced in higher-order modes, suggesting that the influence of the internal fluid on the structural modal characteristics becomes increasingly significant with increasing modal order.
Although the natural frequencies of the high-pressure fuel pipe decrease under fluid–structure interaction, the structural mode shapes remain unchanged and are consistent with those of the dry mode. These modes of the high-pressure fuel pipe are dominated by bending deformation within the plane, with deformation primarily concentrated at the middle part of the pipe. As the mode order increases, more nodal lines appear within the structure, leading to more localized vibration characteristics and increased complexity in the modal shapes.
Fig. 4Comparison of the dry and wet natural frequencies
5. Vibration characteristic analysis of the high-pressure fuel pipe
5.1. Vibration response analysis under fluid-structure interaction
To further investigate the influence of internal fuel pressure pulsations on the vibration characteristics of the high-pressure fuel pipe, a two-way fluid-structure interaction (FSI) simulation was performed using the Fluent and Transient Structural modules in ANSYS Workbench.
First, a computational fluid dynamics (CFD) analysis of the internal flow field was conducted via the Fluent module. The fluid domain was defined as diesel-1-fuel, with the boundary conditions set as a pressure inlet and a pressure outlet. The pressure inlet was subjected to periodic pulse pressure variations by means of a user-defined function (UDF), with the low and high pressures set to 20 MPa and 40 MPa, respectively. The injection cycle was 0.42 s, and the injection duration was 0.02 s, as illustrated in Fig. 5.
Fig. 5Periodic inlet pulse pressure used in the FSI simulation
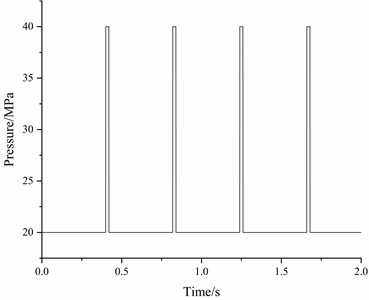
The corresponding inlet pressure can be expressed as:
where and 0.42 s. The outlet pressure was maintained at a constant 5 MPa.
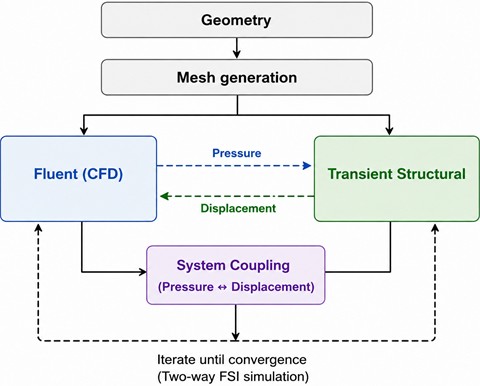
Subsequently, boundary conditions were applied to the solid domain in the Transient Structural module. As diesel engine excitation was not considered in this analysis, both ends of the pipe were constrained using fixed supports. The inner wall of the pipe was designated as the FSI interface to enable data exchange between the fluid and structural domains. Finally, the System Coupling module was used to transfer coupling data between the fluid and structural solvers, thereby completing the two-way FSI vibration simulation of the high-pressure fuel pipe. The overall simulation procedure is illustrated in Fig. 6. During each coupling step, the pressure field calculated in Fluent was transferred to the structural solver as the fluid load, while the structural displacement obtained from the transient structural analysis was transferred back to Fluent to update the fluid domain, thereby achieving two-way fluid-structure interaction. The transient analysis was performed using a fixed time step of 0.001 s. The convergence criterion for the fluid solver was set to a residual of 1×10⁻⁴, while the System Coupling convergence criterion was set to RMS ≤ 0.01.
Fig. 6Two-way fluid-structure interaction simulation workflow
In this study, vibration displacement and root mean square (RMS) value were selected as the key factors for evaluating the vibration response of the high-pressure fuel pipe. The vibration displacement directly reflects the amplitude of structural deformation under dynamic excitation, revealing the response characteristics of the pipe to periodic pressure disturbance. The RMS value, calculated from the vibration signal, represents the average energy level of the vibration and serves as a quantitative measure of vibration intensity.
Under full-load conditions, the maximum total vibration displacement of the high-pressure fuel pipe over a duration of 2 s was extracted to evaluate the vibration response under fluid-structure interaction. The reported displacement corresponds to the maximum resultant displacement extracted from the location exhibiting the largest response in the transient structural analysis, rather than the displacement in a single coordinate direction. As shown in Fig. 7(a), significant fluctuations in displacement are observed at the initial stage of vibration, which is attributed to the transient state transition from static to dynamic conditions. The sudden change in fuel pressure generates a strong transient pressure wave, and the structural system has not yet reached a new equilibrium state, resulting in notable elastic deformation and inertial response of the pipe. The system gradually stabilizes after fuel pulsation, and the vibration response exhibits periodic characteristics, with the maximum resultant displacement reaching 6.41 mm.
Since the vibration response of the pipe presents a periodic pattern, a time span from 0.82 s to 1.24 s was analyzed in detail to capture the complete characteristics of a single vibration cycle, as shown in Fig. 7(b). This time interval corresponds to the stable periodic response after the initial transient stage. Therefore, the subsequent RMS calculation and vibration analysis are not affected by the initial transient response or isolated numerical peaks.
The RMS value of the maximum vibration displacement of the high-pressure fuel pipe within the specified time interval was calculated. For discrete signals, the root mean square (RMS) value is computed using the following formula:
where is the root mean square value, is the -th discrete measurement of vibration displacement, and is the total number of measured samples.
Fig. 7Maximum total vibration displacement under fluid-structure interaction
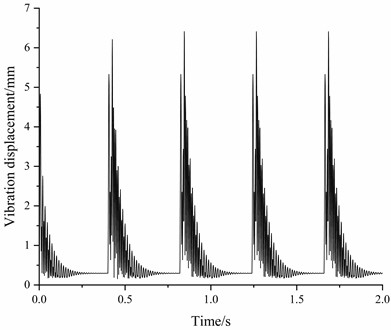
a) Vibration displacement (0 s-2 s)
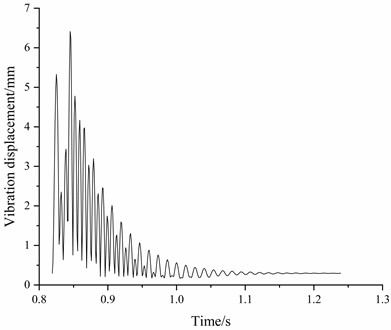
b) Vibration displacement (0.82 s-1.24 s)
Based on this formulation, the RMS value of the maximum vibration displacement of the high-pressure fuel pipe during the time interval from 0.82 s to 1.24 s was calculated to be 1.3224 mm. Since there is currently no unified displacement acceptance criterion for high-pressure fuel pipes, the vibration assessment in this study is primarily based on the RMS evaluation criteria specified in the Vibration Control Guide for Ships issued by the China Classification Society.
According to the RMS evaluation criteria specified in the Vibration Control Guide for Ships issued by the China Classification Society, the vibration level of the pipeline is relatively high under the present operating condition. This indicates that the pipeline is subjected to a relatively severe vibration environment and that vibration mitigation measures should be considered. Therefore, optimizing the pipe support structure, adjusting the pipeline layout, and implementing vibration monitoring are recommended to reduce the vibration response and improve the dynamic performance of the piping system.
5.2. Vibration response analysis under combined diesel engine excitation and fluid–structure interaction
In addition to internal fuel pressure pulsation, vibration transmitted from the diesel engine is another important excitation source affecting the dynamic response of the high-pressure fuel pipe. Therefore, diesel engine excitation was further introduced to investigate the vibration response of the pipe under combined mechanical excitation and fluid-structure interaction.
The structural vibration generated by the diesel engine is transmitted to the high-pressure fuel pipe mainly through the mounting supports at both ends. To represent this support-transmitted excitation, the boundary conditions used in the preceding FSI-only analysis were modified from zero-displacement constraints to prescribed support motion in the vertical direction. Specifically, the same support locations and constrained degrees of freedom were retained in both cases. In the FSI-only case, zero displacement was prescribed in all three directions, whereas in the engine-excitation case, the -direction boundary value was replaced by the prescribed time-dependent displacement, while the - and -direction displacements remained zero. Thus, the -direction degree of freedom was not released; rather, a nonzero kinematic boundary condition was imposed to represent the vertical vibration transmitted through the mounting structure. Consequently, the comparison between the two cases reflects the influence of the imposed support motion rather than a change in the support constraint configuration. This treatment provides a simplified representation of the primary vibration transmission path of the investigated engine–pipe system.
As discussed in Section 2.3, the diesel engine vibration was simplified as a low-order harmonic excitation dominated by the vertical component. The prescribed vertical displacement was expressed as: .
According to the Rules for Classification of Sea-Going Steel Ships, Part 3, Chapter 10 “Ship Vibration Control” issued by the China Classification Society, the general limit for vertical vibration displacement of marine main engines is 0.20 mm (peak-to-peak). Therefore, the excitation amplitude was set to 0.10 mm.
Furthermore, the rated speed of the 6S35ME-B9 diesel engine is 142 revolutions per minute (r/min), with a two-stroke cycle and six cylinders. The total firing frequency of the engine can be calculated using the following formula:
where is the engine speed, and is the number of cylinders.
Based on this, the total firing frequency of the diesel engine was calculated to be 14.2 Hz. Accordingly, the prescribed vertical displacement was expressed as: mm.
In actual diesel engine vibration, multiple harmonic components may be present. In the present study, the total firing frequency of 14.2 Hz is selected as the representative engine-induced excitation frequency. Comparison with the calculated wet modal frequencies shows no close frequency coincidence with the principal higher-order harmonics of 14.2 Hz. Therefore, significant resonance associated with these harmonic components is considered unlikely. Furthermore, considering the symmetric cylinder arrangement of the investigated six-cylinder diesel engine and the installation configuration of the high-pressure fuel pipe, the transmitted vibration is simplified as being dominated by the vertical component. Accordingly, only the 14.2 Hz firing-frequency excitation in the vertical direction is considered in the present model to characterize the principal influence of engine-induced vibration while limiting model complexity.
Under the 100 % load condition, the time-history response of the maximum total vibration displacement over the interval of 0.82-1.24 s was extracted to evaluate the response under combined diesel engine excitation and fluid-structure interaction, as shown in Fig. 8.
By comparing the time-history curves of the maximum total vibration displacement of the high-pressure fuel pipe with and without considering diesel engine excitation, the following conclusions can be drawn:
1) Slight decrease in vibration displacement amplitude without resonance induced by diesel engine excitation.
When diesel engine excitation is introduced, the vibration displacement of the high-pressure fuel pipe becomes slightly lower than that obtained under FSI alone. This behavior is closely related to the frequency relationship between the engine excitation and the structural modal frequencies. The diesel engine excitation has a dominant frequency of 14.2 Hz, which is substantially lower than the first wet modal frequency of 47.674 Hz. Therefore, the diesel engine excitation does not directly coincide with the primary wet modal frequencies of the high-pressure fuel pipe, and no evident resonance associated with the 14.2 Hz excitation is observed.
Fig. 8Maximum total vibration displacement under combined FSI and diesel engine excitation (0.82-1.24 s)
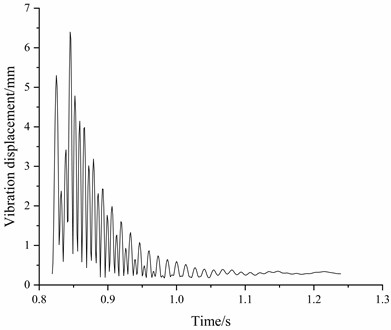
In contrast, when only FSI is considered, the periodic inlet pressure pulse has a fundamental frequency of approximately 2.38 Hz. Although the fundamental frequency is relatively low, the short-duration, high-amplitude pressure pulse contains higher-order frequency components, including components near 47.60 Hz and 76.16 Hz. These frequencies are close to the first and second wet modal frequencies of 47.674 Hz and 76.716 Hz, respectively, and can therefore contribute to pronounced modal responses and increased vibration amplitudes.
These results indicate that the relationship between the excitation frequency components and the structural modal frequencies plays an important role in determining the vibration response. In the present case, the additional 14.2 Hz diesel engine excitation does not induce evident resonance, whereas the higher-frequency components associated with the pressure pulse are closer to the wet modal frequencies and contribute more strongly to the vibration response.
2) Reduced vibration attenuation rate and extended response duration.
With the introduction of diesel engine excitation, the attenuation rate of the vibration response decreases slightly, and the vibration persists for a longer duration.
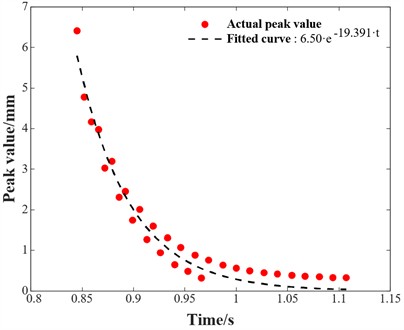
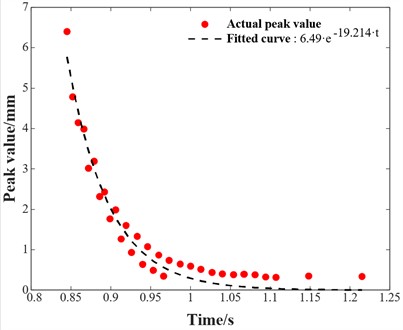
To quantitatively evaluate the vibration attenuation characteristics under different excitation conditions, the Envelope Peak Tracking method was employed to process the vibration response signals. This method extracts peak values from the time-domain signal and fits an envelope curve to characterize the overall attenuation trend of the vibration response.
The peak decay trend was fitted using an exponential function, expressed as:
where is the response amplitude at time , is the fitted initial amplitude, and is the attenuation coefficient obtained from exponential envelope fitting, which characterizes the decay rate of the vibration response. A larger value of indicates a faster attenuation of the vibration amplitude.
The envelope fitting was performed using the least-squares method. No additional material or structural damping model was prescribed in the transient structural analysis. Therefore, the fitted exponential function was used only to characterize the attenuation trend of the vibration response rather than to identify a physical or equivalent damping ratio. The coefficient of determination was for both excitation conditions, indicating that the exponential model reasonably represents the overall attenuation behavior.
As shown in Fig. 9, the fitted attenuation coefficient decreases from 19.391 under FSI alone to 19.214 when diesel engine excitation is included. The coefficient of determination is 0.81 for both cases. The slightly lower attenuation coefficient indicates that the continuous diesel engine excitation reduces the attenuation rate of the vibration response and extends its duration.
When only FSI is considered, the vibration response exhibits a pronounced transient attenuation following each pressure pulse. In contrast, after diesel engine excitation is introduced, the continuous periodic displacement input provides an additional forced-vibration component. Consequently, the attenuation rate decreases and the vibration response persists for a longer period. Although the 14.2 Hz diesel engine excitation does not coincide with the primary wet modal frequencies of the high-pressure fuel pipe, its continuous action contributes to maintaining the low-frequency forced response.
Fig. 9Envelope fitting diagram
a) Peak envelope fitting under FSI only
b) Peak envelope fitting considering FSI and diesel engine vibration excitation
Similarly, the RMS value of the maximum total vibration displacement over the interval of 0.82-1.24 s was calculated to be 1.3206 mm, compared with 1.3224 mm under FSI alone. The difference is approximately 0.14 %, indicating that the introduction of the 14.2 Hz diesel engine excitation has only a minor influence on the overall RMS vibration level under the present operating condition. This is consistent with the absence of an evident resonance response associated with the diesel engine excitation frequency.
In summary, the diesel engine excitation considered in the present model has only a minor influence on the overall vibration amplitude of the high-pressure fuel pipe, but its continuous periodic action reduces the vibration attenuation rate and prolongs the response duration. The results indicate that, although the 14.2 Hz engine excitation does not induce evident resonance, its contribution to the temporal evolution of the vibration response should still be considered when evaluating the combined dynamic behavior of the high-pressure fuel pipe.
5.3. Frequency spectrum analysis
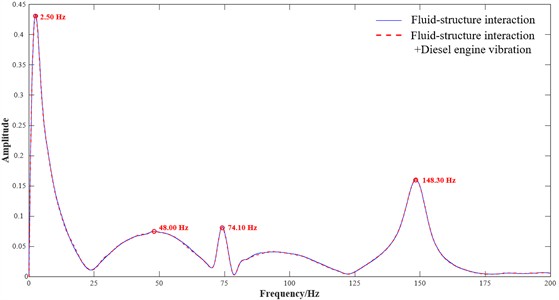
To further investigate the frequency characteristics of the high-pressure fuel pipe under different excitation conditions, the Fast Fourier Transform (FFT) was applied to the time-history data of the maximum resultant vibration displacement. FFT enables the transformation of time-domain signals into the frequency domain, thereby identifying the dominant frequency components. The analysis results are shown in Fig. 10, where the blue curve represents the response under FSI alone, while the red dashed curve represents the response under combined FSI and diesel engine excitation.
The following conclusions can be drawn from the frequency spectrum:
1) The overall spectral distributions under the two excitation conditions are similar, with a dominant low-frequency component near 2.5 Hz and several higher-frequency peaks. The positions of the principal spectral peaks remain nearly unchanged, indicating that the introduction of diesel engine excitation does not noticeably alter the dominant frequency characteristics of the response.
2) Distinct spectral peaks are observed at approximately 48.00 Hz, 74.10 Hz, and 148.40 Hz, which are close to the first, second, and fourth wet modal frequencies of the high-pressure fuel pipe, respectively. This correspondence indicates that these frequency components are closely associated with the corresponding wet modal responses. For clarity, the relationships among the first four dry modal frequencies, wet modal frequencies, and dominant spectral peaks are summarized in Table 2.
Table 2Comparison of dry modal frequencies, wet modal frequencies, and dominant spectral peaks
Mode order | Dry modal frequency / Hz | Wet modal frequency / Hz | Dominant spectral peak / Hz |
First | 48.17 | 47.67 | 48.00 |
Second | 77.97 | 76.72 | 74.10 |
Third | 103.4 | 101.02 | – |
Fourth | 154.6 | 149.80 | 148.40 |
3) The spectral amplitudes near the principal modal frequencies differ only slightly between the two excitation conditions, indicating that the additional diesel engine excitation does not significantly amplify the modal response. The overall frequency response therefore remains dominated by the vibration characteristics induced by FSI.
4) No distinct spectral peak is observed near 14.2 Hz, which is the prescribed diesel engine excitation frequency. This result is consistent with the analysis in Section 5.2 and indicates that the 14.2 Hz excitation does not produce a pronounced resonance response. Instead, its influence is mainly reflected in the temporal attenuation characteristics of the vibration response.
In summary, the frequency-domain results are consistent with the time-domain and envelope analyses presented in Section 5.2. The additional 14.2 Hz diesel engine excitation does not produce a distinct spectral peak or evident resonance amplification, while the dominant response frequencies remain concentrated near the wet modal frequencies associated with FSI. Its primary influence is reflected in the slight reduction in vibration attenuation rate and the extension of response duration rather than in a substantial increase in vibration amplitude.
Fig. 10Frequency spectra of the maximum resultant vibration displacement under different excitation conditions
5.4. Power spectral density analysis
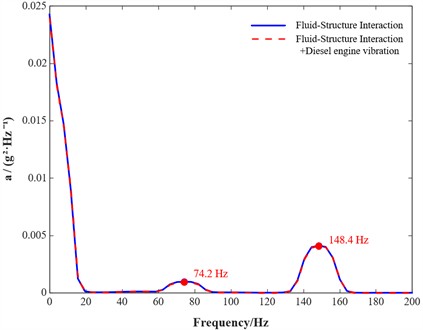
Power Spectral Density (PSD) describes the distribution of vibration signal energy in the frequency domain. To further characterize the frequency-dependent energy distribution of the high-pressure fuel pipe and complement the FFT analysis in Section 5.3, PSD analysis was performed under the two excitation conditions. The resulting PSD curves are shown in Fig. 11.
As shown in Fig. 11, distinct PSD peaks are observed near 74.2 Hz and 148.4 Hz, indicating relatively concentrated vibration energy around these frequencies. These frequencies are close to the second and fourth wet modal frequencies of the high-pressure fuel pipe, respectively, consistent with the modal analysis in Section 4.2 and the FFT results in Section 5.3. The occurrence of these PSD peaks further supports the association between the dominant vibration-energy components and the corresponding wet modal characteristics. Meanwhile, the PSD curves under the two excitation conditions remain very similar, indicating that the additional diesel engine excitation does not substantially alter the energy distribution near these frequencies.
Therefore, the frequency regions around 74.2 Hz and 148.4 Hz can be regarded as vibration-sensitive ranges in the present numerical analysis because pronounced PSD peaks are consistently observed near these frequencies. These frequency ranges should therefore receive particular attention in subsequent vibration control, structural optimization, and vibration monitoring.
Fig. 11Vibration acceleration PSD of the high-pressure fuel pipe under different excitation conditions
6. Parameter impact analysis
6.1. Vibration response characteristics of the high-pressure fuel pipe under different operating conditions
The aforementioned spectral and power spectral density analyses were conducted under the 100 % rated load condition of the diesel engine, with the applied periodic excitation determined from this operating state. However, during actual ship operation, the diesel engine may operate under different load conditions within the 50 %-100 % range, resulting in variations in engine speed, injection characteristics, and excitation frequency.
Therefore, three representative load conditions (50 %, 75 %, and 100 %) were selected to comparatively investigate the vibration responses of the high-pressure fuel pipe under different operating conditions. The analysis focused on the variations in vibration displacement and spectral characteristics with engine load.
Table 3 presents the main operating parameters under different diesel engine loads, including engine speed, injection cycle, injection duration, and excitation frequency. Based on these parameters, coupled vibration simulations were performed for the three operating conditions, and the corresponding time-domain and frequency-domain responses were compared, as shown in Fig. 12 and 13.
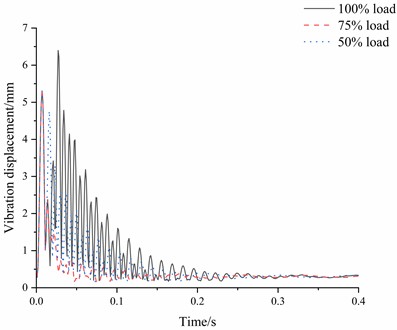
Fig. 12 illustrates the time-domain vibration displacement responses of the high-pressure fuel pipe under the 50 %, 75 %, and 100% diesel engine load conditions. As shown in Table 3, increasing engine load is accompanied by a shorter injection cycle, a longer injection duration, and a higher excitation frequency. Correspondingly, noticeable differences are observed in the vibration responses under the three operating conditions.
Table 3Diesel engine operating parameters
Operating condition | Engine speed / rpm | Injection cycle / s | Injection duration / s | Excitation frequency / Hz |
50 % | 112.8 | 0.53 | 0.011 | 11.3 |
75 % | 129 | 0.47 | 0.015 | 12.9 |
100 % | 142 | 0.42 | 0.020 | 14.2 |
1) The peak vibration displacement generally increases with engine load. Under the 100 % load condition, the maximum displacement reaches approximately 6.4 mm, which is higher than those under the 50 % and 75 % load conditions. This result indicates that the high-pressure fuel pipe exhibits a larger transient vibration response under the full-load condition.
2) The temporal characteristics of the vibration response also vary with engine load. Under the 100 % load condition, the response exhibits a larger initial amplitude and persists for a longer duration, while the oscillation interval becomes shorter. These characteristics indicate that the load condition affects not only the response amplitude but also the temporal evolution of the pipe vibration. The corresponding changes in frequency components are further examined through the spectral analysis in Fig. 13.
Fig. 12Comparison of vibration displacement responses of the high-pressure fuel pipe under different load conditions
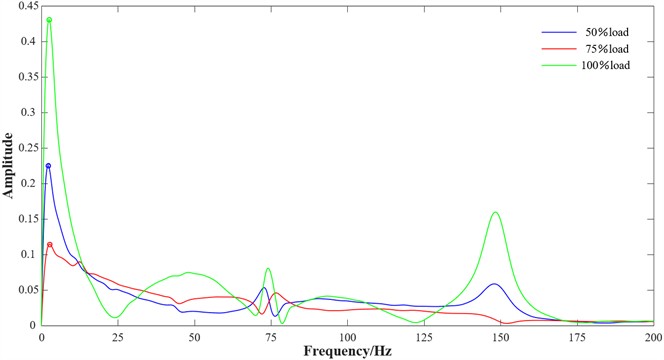
To further examine the influence of engine load on the frequency-domain characteristics, the vibration responses under the three load conditions were transformed into the frequency domain. The resulting spectra are compared in Fig. 13, from which the following characteristics can be identified:
1) Pronounced differences are observed in the low-frequency response. In the frequency range below 25 Hz, all three operating conditions exhibit dominant low-frequency components, with the largest spectral amplitude observed under the 100 % load condition. This indicates that the low-frequency vibration response becomes more pronounced at full load.
2) The spectral components near the wet modal frequencies vary noticeably with engine load. Distinct spectral peaks are observed around 74 Hz and 148 Hz, which are close to the second and fourth wet modal frequencies of 76.716 Hz and 149.8 Hz, respectively. The amplitudes near these frequencies are more pronounced under the 100 % load condition than under the 50 % and 75 % load conditions, indicating stronger modal-related vibration components at full load.
3) The overall spectral amplitudes under the 50 % and 75 % load conditions are generally lower than those under the 100 % load condition, particularly near the modal-related frequency components. This comparison indicates that engine load has a noticeable influence on both the magnitude and frequency distribution of the vibration response.
Combining the time-domain and frequency-domain results, the vibration response of the high-pressure fuel pipe is found to be more pronounced under the 100 % load condition, as reflected by the larger displacement amplitude and stronger spectral components near the second and fourth wet modal frequencies. These results indicate that engine load has an important influence on the vibration characteristics of the high-pressure fuel pipe. Therefore, the frequency ranges associated with the pronounced spectral components under high-load operation should receive particular attention in subsequent structural optimization and vibration monitoring.
Fig. 13Comparison of vibration response spectra of the high-pressure fuel pipe under different load conditions
6.2. Vibration response characteristics of the high-pressure fuel pipe under different inlet pressures
In the preceding analyses, the inlet pressure pulse was represented by a fixed combination of 20 MPa and 40 MPa. However, during actual operation, the peak fuel pressure may vary with engine operating conditions and injection-system performance. Therefore, the influence of inlet high-pressure variation on the vibration response of the high-pressure fuel pipe was further investigated.
Accordingly, five representative inlet high-pressure levels of 36, 38, 40, 42, and 44 MPa were selected based on the technical specifications of the investigated marine diesel engine, while the low-pressure level was maintained at 20 MPa. FSI simulations and frequency-spectrum analyses were then performed under these pressure conditions. The corresponding spectra are shown in Fig. 14, and the main characteristics are summarized as follows:
1) The overall spectral amplitude increases with inlet high-pressure level. In both the low-frequency region near 2.5 Hz and the modal-related frequency regions near 74 Hz and 148 Hz, the spectral amplitudes increase progressively as the inlet high pressure rises from 36 MPa to 44 MPa. This indicates that increasing inlet pulse pressure leads to a more pronounced vibration response of the high-pressure fuel pipe.
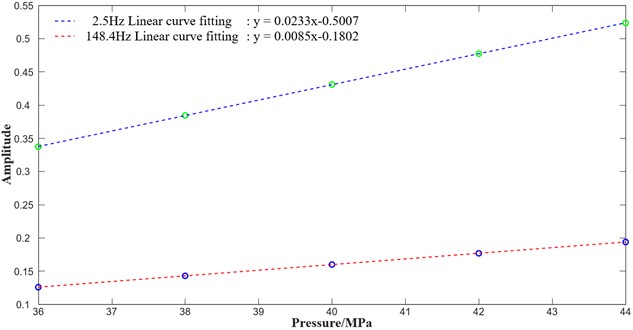
2) The spectral amplitudes at selected characteristic frequencies exhibit an approximately linear increase with inlet high-pressure level. As shown in Fig. 15, the peak amplitudes near 2.5 Hz and 148.4 Hz increase approximately linearly as the inlet pressure increases. The 148.4 Hz component is close to the fourth wet modal frequency of 149.8 Hz, indicating that the response component associated with the fourth wet mode becomes more pronounced at higher inlet pressures.
3) The position of the dominant low-frequency peak remains nearly unchanged, whereas its amplitude increases with inlet high-pressure level. A dominant peak is consistently observed near 2.5 Hz under all five pressure conditions, indicating that variation in inlet pressure mainly affects the response amplitude rather than the position of the dominant low-frequency component.
In summary, the inlet high-pressure level has a noticeable influence on both the magnitude and frequency distribution of the vibration response of the high-pressure fuel pipe. As the inlet pressure increases, the spectral amplitudes increase over both the dominant low-frequency component and the modal-related frequency components, while the corresponding peak frequencies remain nearly unchanged. In particular, the response near the fourth wet modal frequency becomes progressively more pronounced with increasing pressure. Therefore, variations in inlet pressure should be considered in the structural optimization, vibration control, and condition monitoring of high-pressure fuel pipes.
Fig. 14Vibration displacement spectra of the high-pressure fuel pipe under different inlet high-pressure levels
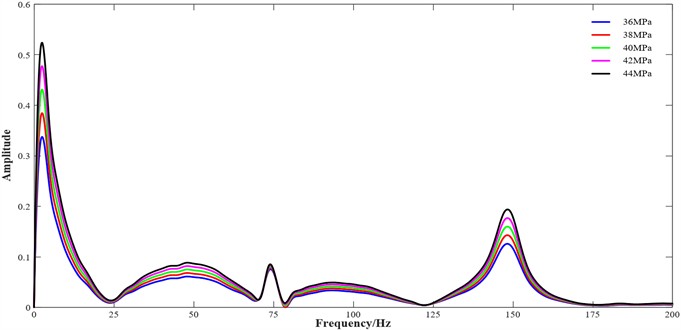
Fig. 15Variation in spectral peak amplitudes with inlet high-pressure level
7. Conclusions
This study investigates the vibration characteristics of a high-pressure fuel pipe under the combined effects of fuel pressure pulsation and diesel engine excitation. A two-way fluid-structure interaction (FSI) model was established, and numerical simulations were performed under different engine loads and inlet pressure conditions. The main conclusions are summarized as follows:
1) Fluid-structure interaction reduces the natural frequencies of the high-pressure fuel pipe, with the reduction becoming more pronounced at higher modal orders. The reduction rates of the first four natural frequencies are 1.03 %, 1.61 %, 2.30 %, and 3.10 %, respectively.
2) The additional 14.2 Hz diesel engine excitation has only a minor influence on the overall vibration amplitude but slightly affects the attenuation characteristics of the response. The RMS displacement changes from 1.3224 mm under FSI alone to 1.3206 mm under combined excitation, while the fitted attenuation coefficient decreases from 19.391 to 19.214, indicating a slightly slower attenuation rate and a longer response duration. No distinct resonance response associated with the 14.2 Hz excitation is observed.
3) Engine load has a noticeable influence on both the time-domain amplitude and frequency distribution of the vibration response. Under the 100 % load condition, the maximum displacement reaches approximately 6.4 mm, and the spectral components near the second and fourth wet modal frequencies are more pronounced than those under the 50 % and 75 % load conditions. In contrast, the vibration responses under low- and medium-load conditions remain comparatively lower.
4) Increasing the inlet high-pressure level leads to a progressive increase in the vibration spectral amplitude, while the corresponding peak frequencies remain nearly unchanged. The spectral amplitudes near 2.5 Hz and 148.4 Hz increase approximately linearly with inlet pressure, and the response component near the fourth wet modal frequency becomes more pronounced at higher pressure levels.
It should be noted that the present study is primarily based on two-way fluid-structure interaction simulations. Apart from the mesh independence verification, no dedicated experimental measurements or benchmark tests were conducted to quantitatively validate the predicted wet modal frequencies, maximum total displacement, RMS values, and PSD characteristics. Therefore, these results should be regarded as numerical predictions under the adopted geometric configuration, boundary conditions, and excitation assumptions. Although the agreement between the dominant spectral components and the calculated wet modal frequencies provides qualitative support for the internal physical consistency of the numerical model, it cannot replace independent experimental validation. Future work will focus on bench tests or onboard vibration measurements to further validate and calibrate the proposed model.
References
-
J. Zhang, W. Li, J. Lin, Y. Qiu, Y. Yuan, and T. Zhou, “Failure analysis of a high-pressure fuel pipe of engine,” Engineering Failure Analysis, Vol. 103, pp. 70–81, Apr. 2019, https://doi.org/10.1016/j.engfailanal.2019.04.040
-
D. Viderščak, Z. Schauperl, K. Ormuž, S. Šolić, and M. Nikšić, “Failure analysis of high-pressure fuel injection lines,” Engineering Failure Analysis, Vol. 121, p. 105176, Dec. 2020, https://doi.org/10.1016/j.engfailanal.2020.105176
-
H. Yu and X.-L. Xu, “Fatigue failure of high-pressure oil-pipes of truck diesel engine,” Engineering Failure Analysis, Vol. 97, pp. 145–160, Jan. 2019, https://doi.org/10.1016/j.engfailanal.2019.01.022
-
X. Y. Qiao, J. M. Liu, and X. M. Zhang, “Experimental study on vibration diagnosis of diesel engine fuel injection system fault,” (in Chinese), Internal Combustion Engine Engineering, No. 2, pp. 36–39, 2002.
-
S. Z. Bai, G. X. Li, and X. C. Zhang, “Vibration analysis and control of high-pressure fuel pipe for vehicle engine,” (in Chinese), Vehicle Engine, No. 3, pp. 58–60, 2006.
-
Y. H. Du and J. Kang, “Bourdon effect and vibration diagnosis of high-pressure fuel pipe in internal combustion engine,” (in Chinese), Journal of Dalian Nationalities University, No. 3, pp. 228–230, 2008.
-
X. J. Xin and C. M. He, “Vibration response analysis of engine high-pressure fuel pipe based on OptiStruct,” (in Chinese), Proceedings of the 2017 Altair Technology Conference, pp. 68–73, 2017, https://doi.org/10.26914/c.cnkihy.2017.004358
-
H. G. Shen et al., “Design and optimization of high-pressure fuel pipe based on frequency response analysis,” (in Chinese), Internal Combustion Engine and Powerplant, Vol. 39, No. 5, pp. 49–54, 2022, https://doi.org/10.11648/j.ajam.20210904.11
-
M. Abiarkashani, Y. Alizadeh Vaghasloo, and M. Aghamirsalim, “Optimal design of high-pressure fuel pipe based on vibration response and strength using multi-objective genetic algorithm,” Structural and Multidisciplinary Optimization, Vol. 64, No. 2, pp. 935–956, Apr. 2021, https://doi.org/10.1007/s00158-021-02908-0
-
V. Otipka, R. Zajac, A. Prokop, and K. Řehák, “Modal properties diagnostics of the high-pressure fuel injection pipes in off-road diesel engine,” Journal of Measurements in Engineering, Vol. 9, No. 1, pp. 48–57, Mar. 2021, https://doi.org/10.21595/jme.2021.21823
-
C. Patil, R. Ghorpade, A. Jomde, and R. Askhedkar, “Finite element and experimental vibration analysis of high-pressure fuel injection pipe for 8-cylinder V diesel engine,” Journal of University of Shanghai for Science and Technology, Vol. 23, No. 3, pp. 1–9, Mar. 2021, https://doi.org/10.51201/jusst12676
-
J. Q. Xing, “Failure analysis and improvement measures of high-pressure fuel pipe,” (in Chinese), Dalian University of Technology, Dalian, China, 2006.
-
X. W. Tian et al., “Vibration fatigue characteristics of high-pressure fuel pipe based on fluid-structure interaction,” (in Chinese), Vibration, Testing and Diagnosis, Vol. 38, No. 6, pp. 1234–1239, 2018.
-
L. Y. Fan et al., “Vibration characteristics of common-rail high-pressure fuel pipe based on fluid-structure interaction,” (in Chinese), Internal Combustion Engine Engineering, Vol. 45, No. 5, pp. 28–36, 2024.
-
W. Li, J. Zhang, J. Wang, and Z. Xu, “Reliability analysis on high-pressure fuel pipe of diesel engine,” MATEC Web of Conferences, Vol. 77, p. 08004, Oct. 2016, https://doi.org/10.1051/matecconf/20167708004
-
B. Shui, Y.-D. Li, Y.-M. Luo, and F. Luo, “Free vibration analysis of Timoshenko pipes conveying fluid with gravity and different boundary conditions,” Journal of Mechanics, Vol. 39, pp. 367–384, Jan. 2023, https://doi.org/10.1093/jom/ufad031
-
Y. Lu, M. Min, W. Song, Y. Zhao, and Z. Wang, “A study on the hydrodynamic excitation characteristics of pump and pipeline systems considering the weakly compressible fluid during the pump start-up condition,” Energies, Vol. 18, No. 11, p. 2911, Jun. 2025, https://doi.org/10.3390/en18112911
-
D. Y. Zheng, “Simulation study on vibration and noise of diesel engine injection system,” (in Chinese), Harbin Engineering University, Harbin, China, 2013.
-
L. Wang, Y.-L. Lee, R. Burger, and K. Li, “Multiple sinusoidal vibration test development for engine mounted components,” Journal of Failure Analysis and Prevention, Vol. 13, No. 2, pp. 227–240, Feb. 2013, https://doi.org/10.1007/s11668-013-9661-x
-
J. Duan, C. Li, and J. Jin, “Modal analysis of tubing considering the effect of fluid-structure interaction,” Energies, Vol. 15, No. 2, p. 670, Jan. 2022, https://doi.org/10.3390/en15020670
About this article

This work was supported by the National Natural Science Foundation of China (Grant No. 52471311).
The datasets generated during and/or analyzed during the current study are available from the corresponding author on reasonable request.
Lei Zhuang: methodology, formal analysis, visualization, writing-original draft. Yuchao Song: validation, writing-review and editing. Jianhua Huang: resources, investigation. Yi Wei: supervision. Guobin Li: supervision, validation.
The authors declare that they have no conflict of interest.

