Abstract
Aiming at the modal problem of fluid-filled pipeline under fluid-structure interaction. At first, from the view of simulation, the modal characteristics of the simplified U-shaped pipeline structure under fluid-structure interaction were analyzed by ANSYS Workbench software. Then, from the view of experimental, the experimental modal analysis of the liquid-filled pipeline was carried out by means of frequency sweeping and hammering. Finally, the simulation model was modified based on the results of the experiment. The experimental results verified that the modified simulation model and the boundary conditions were correct. It provides a basis for the dynamic simulation and experimental analysis of the liquid-filled pipeline under fluid-structure interaction.
1. Introduction
Liquid-filled pipes have a wide range of applications in various industrial installations such as energy, power, petroleum, and chemical industries as well as ships and aircrafts. On the one hand, when the liquid-filled pipeline is subjected to an external load, if the frequency of the external load excitation is consistent with the natural frequency of the liquid-filled pipeline, a strong resonance will occur. On the other hand, the fluid inside the pipeline is frequently to change due to the changing work conditions. The pulsating pressure of the fluid in the pipe causes the pipe to vibrate violently. These vibrations bring a hidden danger to the safety of the piping system. Therefore, the study of the dynamics of liquid-filled pipelines is very necessary, and modal analysis is the basis of dynamics research and also is the primary research content of dynamics research. The fluid-structure interaction effect has a great influence on the dynamic characteristics of the liquid-filled pipeline. Some studies have shown that [1], if the fluid-structure interaction effect is neglected, the result is inaccurate. Therefore, in order to accurately analyze the modal characteristics of the liquid-filled pipe, the fluid-structure interaction effect between the pipe structure and the fluid must be considered. The concept of fluid-structure interaction was first proposed by Asheley [2], that is, the motion of the flow field deforms the solid domain, while the deformation of the solid domain in turn affects the motion of the flow field. The fluid interacts with the solid and couples to form a variety of different vibration waves. Asheley et al. proposed a lateral vibration differential equation for the liquid-filled pipeline; Zhang L. [3] proposed a method to solve the fluid-structure interaction effect from the frequency domain perspective and obtained the time domain solution by Laplace inverse transform. Nie [4] et al. used ANSYS finite element software to calculate the natural frequency of the pipeline, and comprehensively analyzed the influence of each parameter on the natural frequency. Li [5] et al. studied the fluid-structure interaction vibration characteristics of a variable cross-section pipeline; Yu [6] studied the fluid-structure interaction modal analysis of liquid-filled pipelines under different constraints. This paper will comprehensively analyze the fluid-structure interaction modal of liquid-filled pipelines under different fluid pressures from the perspective of simulation and experiment. Through experiments, the simulation results can be verified, and the simulation model can be modified to achieve more accurate simulation.
2. Fluid-structure interaction modal analysis of liquid-filled pipeline based on finite element simulation
2.1. Establishment of finite element model
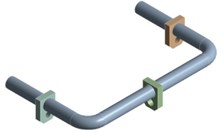
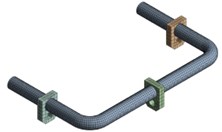
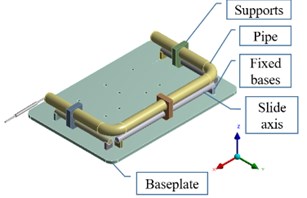
In this paper, ANSYS Workbench is used for finite element modeling analysis. The finite element simplified model of liquid-filled pipeline structure is shown in Fig. 1(a), including the fluid, the supports and the pipeline three parts. The outer diameter of the U-shaped pipeline is 60 mm, the wall of the tube is 0.7 mm thick. The meshing of the liquid-filled pipeline is shown in Fig. 1(b). The meshing method for the pipeline and fluid is multizone, and the size control of the pipeline grid is 10 mm, the rest of the structure uses automatic method. The number of mesh nodes is 142078 and the number of elements is 84430. The material of pipeline is 304 stainless steel, the material of supports is structural steel, and the material of fluid is No. 32 hydraulic oil. The relevant parameters of the materials are shown in Table 1.
Because the fluid-structure interaction between the liquid and the pipe is considered, the hydraulic oil is equivalent to the almost incompressible metal material with the same density, the bulk modulus is 160MPa [7], and the Poisson's ratio is 0, so that the hydraulic oil can be simulated by the solid element. The contact between the pipe and the supports are defined as boned, and the contact between the hydraulic oil and the inner wall of the pipe is defined as no separation, fixing the three supports.
Fig. 1Finite element model and meshing
a)
b)
Table 1Materials characteristics
Material | Density / (kg/m3) | Young’s modulus / GPa | Poisson’s ratio | Tensile limit / MPa | Dynamic viscosity / (Pa·s) |
SUS304 | 7850 | 186 | 0.3 | 520 | None |
Structural steel | 7850 | 200 | 0.3 | 250 | None |
No. 32 hydraulic oil | 872 | 4.8 | 0 | None | 0.0279 |
2.2. Modal analysis of liquid filled pipeline
For the five work conditions of the liquid filled pipeline, including the empty pipe, the fluid pressure is 0 MPa, 1 MPa, 3 MPa, 5 MPa. In the modal analysis of the empty pipe, the fluid is suppressed; in the modal analysis under the fluid-structure interaction effect, the fluid-structure interaction method adopts unidirectional fluid-structure interaction. The curve of the first 12-order modal frequencies in the five working conditions of the liquid-filled pipeline is shown in Fig. 2.
From Fig. 2, we can draw the following conclusions.
Comparing the natural frequencies of the liquid-filled pipeline between the empty pipeline and the effect of fluid-structure interaction, it can be seen that the fluid-structure interaction effect reduces the natural frequency of the pipeline, with an average reduction of 23.3 %.
As the fluid pressure increases, the natural frequency of the liquid-filled pipe is almost constant in the low frequency band (0-500 Hz) and slightly increases in the high frequency band (greater than 500 Hz).
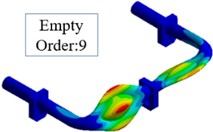
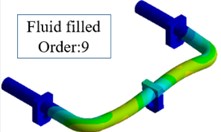
Also, we find the mode shapes of the empty pipe and the liquid-filled pipe are the same in the first six natural frequencies, but in the natural frequencies of 7-12, the mode shapes are obvious different. Fig. 3 shows the order of the 9 natural mode shapes between empty pipeline and the liquid-filled pipeline. The cause of the result is the incompressibility of the liquid.
Fig. 2The first 12-order modal frequencies of the pipeline
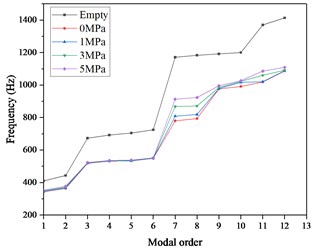
Fig. 3The mode shape of the order of 9
a)
b)
3. Fluid-structure interaction modal analysis of liquid-filled pipeline based on experiment
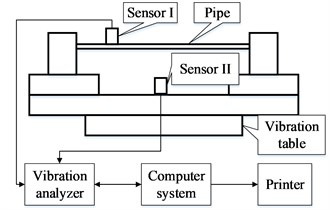
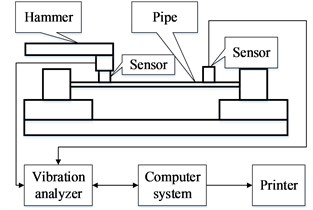
The test analyzes the modal of the liquid-filled pipeline by two methods of sweep frequency and hammering. The sweep frequency is to apply the sinusoidal signal excitation to the structure with the frequency changed. Through the sweep frequency experiment, the sensor installed on the pipeline can obtain the frequency response characteristic. The schematic diagram is shown in Fig. 4(a). The hammering method uses the hammer as the excitation device, and the frequency response function is obtained by FFT. The schematic diagram is shown in Fig. 4(b). The vibration analyzer obtains the hammer signal and the sensor signal simultaneously. The advantage of the hammering method is that not only the modal frequencies of each order can be obtained. The mode shape and the corresponding damping ratio can also be obtained.
Fig. 4The schematic diagram of: a) sweep frequency, b) hammering
a)
b)
3.1. Modal analysis of liquid-filled pipeline based on sweep frequency method
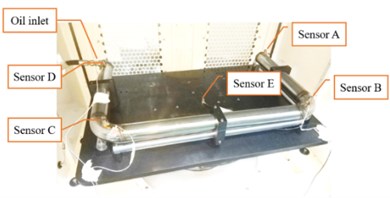
The sweep frequency experiment of the pipeline is carried out on the 5 t electromagnetic vibrating table. The experimental structural diagram is shown in Fig. 5. The pipeline structure is mainly composed of a U-shaped pipe, the pipe supports, the fixed bases, the slide axis, and a baseplate. Install four acceleration sensors A, B, C, and D at the two pipe orifices and two elbows of the pipeline. Install one acceleration sensor E at the center of the baseplate to control the vibration of the vibrating table. The sweep frequency range is 15-1500 Hz, the amplitude is 1 g.
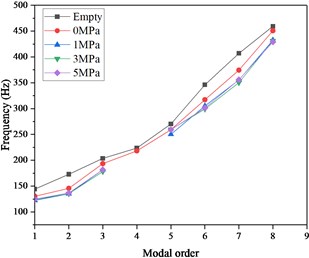
The frequency sweeping work conditions are the same as the simulation work conditions, which are divided into empty pipeline, the fluid pressure of the pipeline is 0 MPa, 1 MPa, 3 MPa and 5 MPa. We only extract the frequency response function of the sensor B (the conclusions of the remaining sensors are similar) and get the peak frequency response result of the first 4 order of the pipeline structure, as shown in Fig. 6. It can be seen that compared with the empty pipe, the modal frequencies of the fluid-filled pipelines are decreased, especially the 4th-order modal frequency decreases the most, reaching 14.5 % (from 400 Hz to 342 Hz); As the pressure of the liquid increases, the modal frequencies of the various orders of the pipe are almost constant. This is consistent with the simulation conclusions.
Fig. 5The diagram of sweep frequency experiment installation
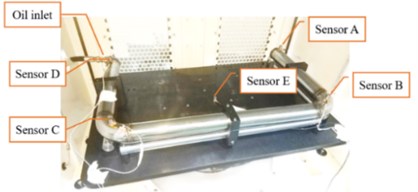
Fig. 6The result of sweep frequency experiment
3.2. Modal analysis of liquid-filled pipeline based on hammering method
The hammering modal experiment uses Danish B&K’s modal analysis equipment, including modal analysis software, interface boards, hammer, acceleration sensors, charge amplifiers, and high-quality cables. The experimental structure diagram is shown in Fig. 7. Eight acceleration sensors are arranged evenly on the surface of the pipe (only the vibration in the vertical direction is considered), and the appropriate pulse excitation is applied by the hammer. Each acceleration sensor will respond accordingly, and the vibration analyzer will record the signal of the hammer and the each acceleration sensor, these signals are analyzed by Pulse Lapshop and Reflex software. Finally, the modal parameters of the pipeline structure can be obtained.
Fig. 7The diagram of hammering modal experiment installation
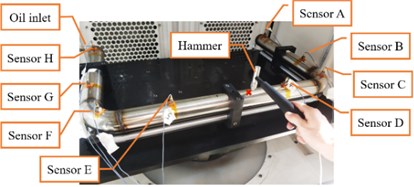
Fig. 8The result of hammering modal experiment
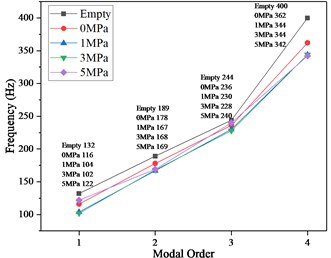
Like the work conditions of the sweep frequency analysis, the hammering method also divides into 5 work conditions. The modal frequencies of the various orders of the pipeline structure are as shown in Fig. 8 (the fourth-order modal frequency of liquid pressure 1 MPa, 3 MPa, and 5 MPa is missing). It can be seen that compared with the empty pipe, the modal frequencies of the liquid-filled pipeline structure are decreased, especially the 7th-order modal frequency decreases the most, reaching 12.5 % (from 406.8 Hz to 350.3 Hz); The pressure of the liquid has little effect on the modal frequencies of each order. This is consistent with the conclusions obtained by the sweep frequency method.
4. Modification of finite element model
According to the above experimental conclusions, it can be seen that the conclusions of the frequency sweep and the hammer experiment are consistent. For the finite element simplified model, although the result is qualitatively consistent with the experimental conclusion, in terms of quantitative, the finite element simplified model is not very good. So, the finite element model needs to be re-modeled and the boundary conditions need to be modified according to the experimental conclusions, so that the finite element model can simulate the experimental model more accurately.
In this section, the simulation model is modified by the results of the sweep frequency experiment. The simulation uses the harmonic response analysis method, which corresponds to the sweep frequency experiment. Due to the space limitation, only the model of empty pipe is simulated and analyzed. The conclusion liquid-filled is similar. The re-modeled simulation model of the pipeline structure is shown in Fig. 9(a), which is completely consistent with the experimental model. The experimental model is shown in Fig. 9(b). In order to keep boundary conditions of the experimental model, a spring-damped structure in the direction is added to the inlet of the pipe, and the damping ratio of the pipeline structure is set to 0.02 (by hammer modal analysis). A 1 g acceleration load was applied to the bottom plate to perform harmonic response analysis.
Fig. 9a) The re-modeled simulation model, b) the experimental model
a)
b)
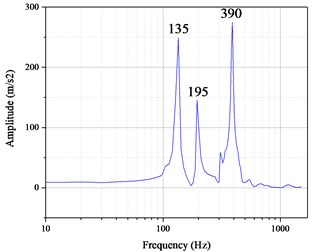
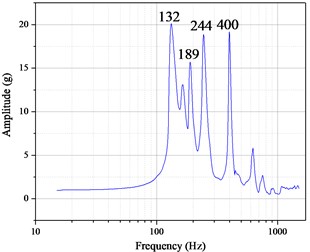
Extracting the acceleration frequency response curve at the point of sensor B in modified simulation, and the result is shown in Fig. 10(a). Also, the Fig. 10(b) shows the result of sweep frequency experiment. Table 2 shows the comparison between the modified simulation results and the sweep frequency experiment results. It can be seen that except for the 3rd-order resonance frequency in simulation model, the error between simulation and experiment is no more than 3.08 %, which can be accepted, thus verifying the correctness of the modified simulation model.
Table 2Comparison of simulation results with experimental results
Modal order | Results of simulation / Hz | Results of experiment / Hz | Error |
1 | 135 | 132 | –2.22 % |
2 | 195 | 189 | –3.08 % |
3 | None | 244 | None |
4 | 390 | 400 | 2.56 % |
Fig. 10The result of: a) modified simulation, b) experiment
a)
b)
5. Conclusions
From the perspective of simulation and experiment, this paper comprehensively analyzes the fluid-structure interaction modal characteristics of liquid-filled pipelines under different fluid pressures, and obtains the following conclusions:
1) Through the simulation and the experiment, compared with the empty pipe, the natural frequencies of the liquid-filled pipeline decrease greatly, and the pressure of the liquid have little effect on the natural frequencies of the pipe.
2) In the simulation modal analysis, it is found that the mode shapes of the empty pipe and the liquid-filled pipeline are the same in the first 6 natural frequencies, but there is a significant difference in the natural frequencies of the 7-12 order, because the incompressibility of the fluid.
3) After the simulation model is modified, it can simulate the experimental model relatively well. Comparing with the experiment results, except for the simulation of the 3rd-order modal frequency loss, the frequency errors of other orders are within 3.08 %.
References
-
Jaeger C. The theory of resonance in hydropower systems. Discussion of incidents and accidents occurring in pressure systems. Journal of Fluids Engineering, Vol. 85, Issue 4, 1963, p. 631-640.
-
Holt A., Haviland G. Bending vibrations of a pipe line containing flowing fluid. Journal of Applied Mechanics, Vol. 17, 1950, p. 229-232.
-
Zhang L., Tijsseling S. A., Vardy E. A. Fsi analysis of liquid-filled pipes. Journal of Sound and Vibration, Vol. 224, Issue 1, 1999, p. 69-99.
-
Qingde N., Wei T., Hao W. Calculation of natural frequency of multi-span U-tube. Journal of Pressure Vessel, Vol. 28, Issue 9, 2011, p. 15-21.
-
Baohui L., Xingshan G., Yongshou L., et al. Study on fluid-structure interaction vibration characteristics of variable cross-section liquid pipelines. Journal of Mechanical Science and Technology for Aerospace Engineering, Vol. 30, Issue 12, 2011, p. 2056-2060.
-
Meng Y. Analysis of fluid-structure interaction characteristics of pipeline based on ANSYS. Chinese Journal of Ship Research, Vol. 2, Issue 5, 2007, p. 54-57.
-
Yingwei C., Kun S., Zhengxing L. The measurement of volume elastic modulus of hydraulic oil. Hydraulics Pneumatics and Seals, Vol. 3, 2012, p. 17-19.
Cited by
About this article

The authors gratefully acknowledge the financial support provided by National Natural Science Foundation of China (Grant Number: 51875570) and the National Key R&D Program of China (Grant No. 2017YFC0806300).
