Abstract
This paper proposes a fast damper selection method based on a torsion-decoupled shear inter-story model. By integrating an automated design program via the SAP2000 API, a two-stage design framework with integrated control of vibration and seismic vibration for steel spring-VFD systems in metro-adjacent buildings is established. The VFD quantity estimated by the proposed simplified inter-story model is approximately 1.5 times that yielded by the refined SAP2000 model. It can serve as a conservative estimation tool for damper count at the scheme stage, providing reliable initial parameters for subsequent refined calculation. Compared with conventional manual design approaches, the automated design program developed based on the SAP2000 API significantly shortens the design cycle. The proposed method and framework are validated against the practical engineering project of Shenzhen Conservatory of Music. Validation results demonstrate that in terms of vertical vibration control, the maximum 1/3-octave vibration level of the target floor is reduced by 12.1-28.5 dB with a vibration attenuation rate of 64 %-82 %, and the secondary radiated noise is lowered by 1.4-19.1 dB(A) with a noise attenuation rate of 51 %-92 %, fully satisfying the limit requirements of relevant standards. In terms of horizontal seismic control, VFDs can effectively suppress the deformation and relative velocity of the isolation layer under multi-level seismic excitations. The automated program can balance seismic control performance and construction cost, and deliver multiple feasible schemes tailored to different design priorities.
1. Introduction
Urban rail transit has become the backbone of public transportation in major cities worldwide. By 2024, the total length of urban rail transit in China had exceeded 12,161 km, with an annual passenger volume of approximately 32.257 billion [1]. However, the vertical vibration generated during metro operation propagates through the track structure and surrounding soil, posing a serious threat to the living comfort of residents in adjacent buildings, the precise operation of medical and scientific instruments, and the structural safety of historical buildings [2-3].
Meanwhile, China is a country with high seismic activity. Buildings near subways face both routine vibration control and low-probability seismic events. When designing structures subjected to both vibration and earthquake effects, how to control the vertical vibration induced by subways while ensuring structural safety under seismic action is a practical challenge for researchers. Therefore, developing vibration-seismic dual-control technology is of crucial importance and practical significance for promoting the integrated development of urban rail transit.
Current vibration-seismic dual-control technologies can be classified into the following three design approaches [4]: (1) When the seismic precautionary intensity is relatively high or there are special seismic requirements, and the vertical environmental vibration is relatively small or the allowable vertical vibration level is relatively low, a design scheme that prioritizes seismic fortification may be adopted. (2) When the seismic precautionary intensity is relatively low, the vertical environmental vibration is significant, and the allowable vertical vibration level is strict, a design scheme that prioritizes vibration control may be employed. (3) When seismic fortification and vibration control are equally important in the local engineering design, a multi-dimensional vibration-seismic dual-control design scheme is recommended, which typically involves combining multiple types of bearings to achieve both vibration and seismic control.
Fig. 1Some three-dimensional vibration (or seismic) isolation bearings
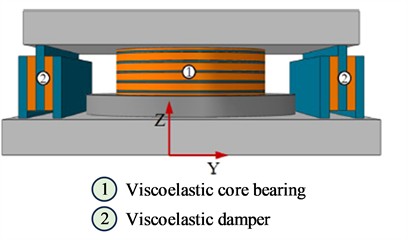
a) Schematic diagram of MEIMD [8]
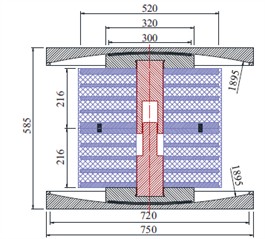
b) Diagram of 3D-VIB [17]
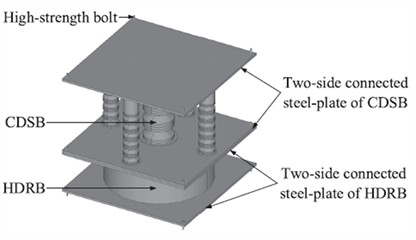
c) Diagram of 3D isolation bearing [20]
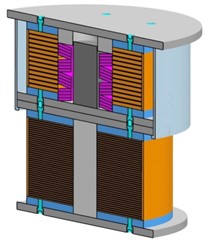
d) Diagram of TNRB-DSB-LRB [23]
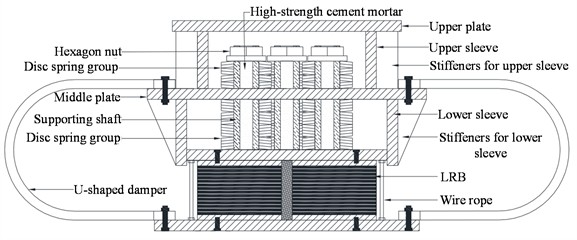
e) LRB, disc springs and U-shaped damper system [28]
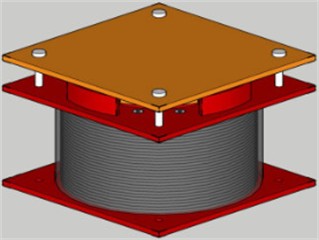
f) Diagram of MDSI [29]
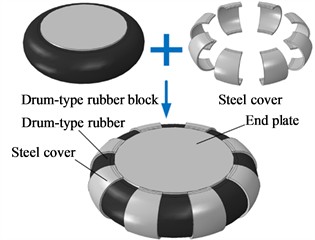
g) Diagram of steel-confined rubber bearing [30]
Conventional vibration isolation devices mainly include steel springs, disc springs, polyurethane vibration isolation pads, etc., while seismic isolation devices mainly include laminated rubber bearings, friction pendulum bearings, etc. Energy dissipation devices primarily refer to viscous dampers, etc. Generally, vibration isolation devices or seismic isolation devices only provide vertical vibration isolation or horizontal seismic isolation effects. To achieve ideal vibration-seismic dual-control performance, it is necessary to combine vibration isolation devices and seismic isolation devices through series, parallel, or mechanically integrated designs to realize the dual-control function. Consequently, researchers have developed various three-dimensional vibration (or seismic) isolation bearings, including thick laminated rubber bearings [5-8], viscoelastic material bearings [9-10], laminated rubber and air spring systems [11-12], air spring and friction pendulum systems [13], friction pendulum and viscous damper systems [14], disc spring and friction pendulum systems [15], thick laminated rubber bearings and friction pendulum devices [16-17], quasi-zero-stiffness and friction pendulum systems [18], disc springs and U-shaped metallic dampers [19], disc springs and (high-damping) laminated rubber bearings [20-24], as well as other types of combined three-dimensional vibration (or seismic) isolation bearings [25-32], as shown in Fig. 1.
Compared to the aforementioned three-dimensional isolation bearings with complex structures, steel springs (Fig. 2) are widely used in engineering projects where vertical vibration isolation is the primary focus. They offer outstanding advantages, including mature technology, good economic performance, simple installation, straightforward construction, and excellent durability. In scenarios with stringent requirements for vibration and noise control, such as museums, concert halls, and laboratories, steel springs demonstrate exceptional adaptability and have been implemented on a large scale in related engineering fields both domestically and internationally. Steel springs primarily address vibration impacts caused by subway operations, while additional seismic measures are required to mitigate earthquake effects. A commonly adopted seismic solution in current engineering practice involves a combined vibration and seismic isolation design system that integrates steel spring isolators with viscous dampers and limiters. The steel spring isolators mainly serve to reduce vertical vibration effects, where as the viscous dampers and limiters act as auxiliary seismic components. Their core function is to dissipate energy or provide displacement constraints, thereby reducing the horizontal displacement of the steel springs under seismic action and preventing isolation system failure due to excessive horizontal deformation.
Fig. 2Diagram of steel springs isolator
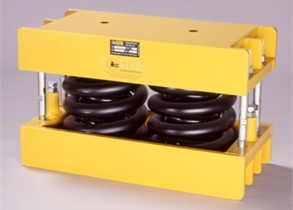
The application of steel springs was reported as early as 1980. To address the difficulty of traditional rubber isolation bearings in isolating vertical seismic motion, Hüffmann [33] proposed in 1980 a seismic isolation support system combining helical springs with viscous dampers. Subsequently, in 1985, Hüffmann [34] developed a three-dimensional seismic isolation system based on helical springs and velocity-dependent viscous dampers, achieving three-dimensional linear flexibility and efficient energy dissipation across all degrees of freedom. In 1992, Tezcan [35] and Makris [36] independently proposed their respective three-dimensional seismic isolation systems using steel helical springs and viscous dampers. Tezcan experimentally validated the system, while Makris introduced a fractional derivative model to accurately describe the complex frequency-dependent characteristics of the dampers.
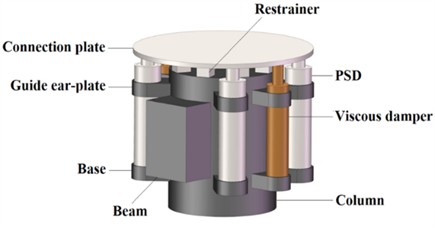
Subsequent scholars have developed various isolation systems based on steel springs to overcome the technical limitations of traditional isolation devices. In 1994, Constantinou et al. [37] developed and tested a seismic isolation system combining polytetrafluoroethylene (PTFE) sliders with helical steel springs. In 2002, Wagner [38] proposed using helical steel springs to elastically support track beds or buildings, addressing low-frequency vibrations and solid-borne noise from urban rail transit. In 2013, Li et al. [39] developed a novel three-dimensional seismic isolation bearing (3DSIB) to tackle the sensitivity of long-span spatial structures to horizontal and vertical seismic responses and the ineffectiveness of traditional devices in vertical isolation. The system integrates horizontal PTFE sliding surfaces with helical reset springs and vertical disc/helical springs, achieving multi-dimensional isolation, uplift resistance, and decoupled stiffness parameters. In 2018, Lee et al. [40] proposed a three-dimensional seismic isolation system combining triple-pendulum friction bearings with vertical helical steel springs and viscous dampers to protect high-voltage power transformers, resolving the issue of amplified vertical ground motion transmission. In 2020, Shang et al. [41] developed a low-cost three-dimensional seismic isolation bearing (3D-SAIB) using helical steel springs and asphalt composite materials, which was experimentally validated, to address the drawbacks of complex structure and high cost in existing three-dimensional seismic isolation systems. In 2023, Dong et al. [42] designed a long-period vertical isolation device with variable stiffness (as shown in Fig. 3), composed of horizontal rubber bearings and three-layer helical steel springs. Through prestress and displacement constraint design, the device achieves multi-stage vertical variable stiffness and self-centering capabilities. Between 2022 and 2024, Zhuang et al. [43-45]proposed pre-pressed spring devices (as shown in Fig. 4) to address the sensitivity of single-layer spherical reticulated shell structures to vertical ground motions. In 2024, Nie et al. [46] evaluated a novel three-dimensional isolation bearing combining horizontal springs and diagonally oriented vertical springs (as shown in Fig. 5), addressing the oversight of dynamic amplification effects and cumulative plastic damage risks in substructures in studies on long-span spatial structures. In 2025, Shi et al. [47] proposed a layered three-dimensional isolation system (as shown in Fig. 6), which combines base-level friction pendulum horizontal isolation and floor-level helical steel spring vertical isolation. Validated through full-scale shaking table tests, this system resolves the horizontal-rocking coupling effects and vertical ground motion amplification issues inherent in traditional systems.
Fig. 3Diagram of LVIVS [42]
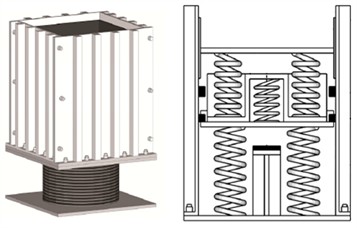
Fig. 4Diagram of DMPVIB [43-45]
In recent years, intelligent algorithms such as parameter-efficient fine-tuning [48], multimodal perception [49], and multi-scale visual feature extraction [50] have advanced rapidly. Meanwhile, a wealth of research outcomes has emerged in fields including nonlinear dynamic modeling [51-53], multi-constraint multi-objective optimization [54], iterative acceleration of convex optimization [55], and global parameter joint optimization [56], which provide theoretical support and technical insights for automated structural design driven by the secondary development of finite element software.
Although the aforementioned dynamic theories and intelligent optimization algorithms have been thoroughly validated, existing studies have not yet established a complete, standardized automated design workflow for steel spring-VFD vibration-seismic dual-control systems. At the current stage, engineering design still relies heavily on manual modeling and repeated manual parameter tuning. The design process must also simultaneously accommodate multiple constraints such as maximum frequency division vibration level, secondary radiated noise, and multi-level seismic deformation, leading to generally low efficiency.
Fig. 53D spring isolation bearing [46]
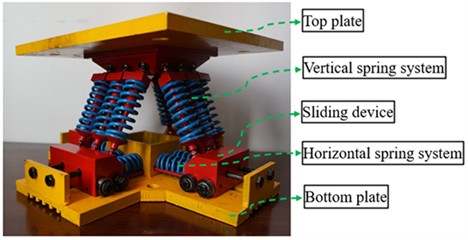
Fig. 6Diagram of L3DIS [47]
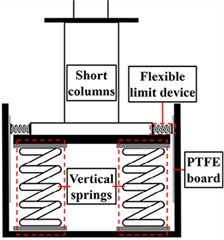
To address the above research gaps, this paper proposes a standardized automated vibration-seismic dual-control design method based on the SAP2000 API. The developed program integrates modules for rapid damper selection, automatic steel spring matching, parametric modeling, and batch post-processing visualization, with a built-in refined calculation module for noise and vibration levels. By introducing the NSGA-II algorithm to realize collaborative optimization of damper positions and parameters, the program can batch output compliant damping configuration schemes and significantly shorten the design iteration cycle. The core innovations of this paper are summarized as follows:
(1) Theoretical innovation: A torsional-decoupled shear inter-story model is established, and the coupled 2D bisection method is adopted to solve the minimum equivalent damping of VFD under multi-level seismic conditions. This forms a rapid estimation framework for damping parameters in the schematic design phase of steel spring-VFD vibration-seismic dual-control systems, with theoretical novelty.
(2) Methodological and tool innovation: A full-process automated design program is developed via secondary development of SAP2000. Through NSGA-II multi-objective collaborative optimization, it resolves the engineering pain points of low manual iteration efficiency and long design cycles in vibration-seismic dual-control design.
2. Rapid damper selection method based on shear inter-story model
2.1. General framework
For high-rise buildings fitted with a seismic isolation layer composed of steel spring-VFD, this chapter proposes a rapid damper selection method based on the shear inter-story model and the mode superposition response spectrum method. The overall workflow consists of two stages: non-isolated model calibration and VFD parameter optimization for the isolation system.
(1) Non-isolated model calibration stage.
A shear inter-story model is established by extracting floor mass and stiffness parameters from commercial finite element design software such as YJK. The accuracy of the dynamic characteristics of the inter-story model is validated by comparing its natural periods and mode shapes with those of the detailed finite element model. Meanwhile, the torsional amplification factor is calibrated against finite element displacement results under frequent earthquakes, so as to quantify the amplification effect of bidirectional torsional coupling on inter-story displacement and inter-story drift ratio.
(2) Isolation system optimization stage.
With the parameters of upper structure floors maintained unchanged, a steel spring-VFD isolation layer is installed at the building base. The complete quadratic combination (CQC) mode combination method is adopted to calculate structural displacements under both frequent and rare earthquake intensities, and the calibrated torsional correction coefficient is introduced to revise the upper story drift ratios and isolation layer deformations.
Given that isolation layer displacement decreases monotonically with increasing damping, this paper develops a coupled two-dimensional bisection search algorithm to solve for the minimum equivalent linear damping that simultaneously satisfies the isolation layer deformation limit under rare earthquakes and the inter-story drift ratio limit under frequent earthquakes. Finally, the equivalent damping value is converted into product specifications of nonlinear dampers, and the required number of dampers for deployment is determined.
The proposed method features three core innovations. First, the adoption of a torsion-decoupled shear inter-story model substantially reduces the computational cost of numerical analysis. Second, the torsional amplification factor is quantitatively calibrated based on finite element results under frequent earthquakes, enabling an approximate consideration of torsional coupling effects. Third, a 2D bisection optimization strategy is constructed leveraging the monotonic displacement-damping relationship, which markedly improves solution efficiency while guaranteeing the optimality of results. This method is highly applicable for the rapid estimation of damper parameters in the preliminary scheme design phase.
2.2. Shear inter-story model
Based on the computational parameters of the finite element model, shear inter-story models are established along the and seismic input directions respectively, in which each floor is assigned only one horizontal translational degree of freedom.
The mass matrix of the model is a diagonal matrix, and the equivalent mass of each floor is calculated from the combination of dead load and 0.5 times live load:
where, denotes the seismic direction, and is the equivalent mass of the -th floor.
The shear inter-story stiffness matrix takes the form of a tridiagonal matrix:
where for non-isolation floors, represents the lateral stiffness of the floor, defined as the ratio of the floor seismic shear force to the corresponding inter-story displacement and extracted from the finite element model results; for the isolation layer, equals the lateral stiffness of springs multiplied by the correction factor .
VFDs are centrally arranged in the isolation layer. For a system composed of substructures with different damping properties, a non-proportional damping system can be established by constructing damping submatrices for each substructure separately and then assembling them globally in accordance with the block assembly rule [57]. The overall damping matrix is obtained by superposing the damping submatrix of the upper structure and the additional damping submatrix of VFDs in the isolation layer:
The damping submatrix of the upper structure is constructed using Rayleigh damping:
where, and are Rayleigh coefficients determined by Eq. (5) below, and and are the mass and stiffness matrices of the upper substructure respectively:
where, and are the target frequencies of the whole structure, and is the damping ratio of the upper substructure, taken as 0.04 under frequent earthquakes, 0.05 under moderate earthquakes, and 0.06 under rare earthquakes. The damping of the isolation layer is composed of the additional damping provided by VFDs. After being assembled into the overall damping matrix according to the correspondence of degrees of freedom, the modal damping ratio of each vibration mode is calculated by the following equation:
where, denotes the modal damping ratio of the -th vibration mode, is the mode shape vector of the -th mode, represents the natural frequency of the -th mode, and is the generalized mass of the -th mode, which is calculated by Eq. (7). The resulting modal damping ratios of all orders are applied to calculate the seismic response coefficients for the corresponding vibration modes:
2.3. Equivalent stiffness of the isolation layer
Assume that the isolation layer is equipped with steel spring bearings. For the -th bearing, the vertical force under gravity is denoted as , the vertical stiffness as , and the static compression as Thus:
In engineering practice, it is generally required that the static compression of springs at each support point be as consistent as possible, i.e., , where is the target vertical compression. Based on this, the vertical stiffness of each spring can be estimated as follows:
Accordingly, the total vertical stiffness of the isolation layer is derived as:
where, is the vertical equivalent mass. The target vertical frequency of the isolated structure is given by:
Therefore, the total vertical stiffness of the springs can be estimated from the target vertical frequency of the isolated structure:
The equivalent horizontal shear stiffness of the springs is proportional to their vertical stiffness, expressed as:
where, 0.35 is the proportional coefficient between horizontal and vertical stiffness. is the correction factor that accounts for the reduction in the shear stiffness of the isolation layer caused by rotation induced by spring extension and compression, and is taken as 0.95 in this study.
2.4. Mode superposition response spectrum method with torsional correction
The number of vibration modes to be calculated is governed by the modal effective mass coefficient. The participation factor and effective mass coefficient of the -th mode are expressed as:
where, denotes the seismic influence vector with all elements equal to unity, and represents the total mass of the structure. Modes are accumulated in descending order of effective mass coefficient until the cumulative effective mass coefficient reaches no less than 0.9.
The characteristic value of horizontal seismic action for the -th mode is calculated in accordance with Clause 5.2.2 of the Reference [58]:
where, is the gravitational acceleration, and is the seismic influence coefficient corresponding to the -th mode. The floor displacement vector for each mode is derived by inverting the stiffness matrix:
The CQC method is adopted to compute the displacement response of each floor, based on which the inter-story drift ratios are further calculated. The effect of torsional coupling on the shear inter-story model is calibrated against finite element results:
where, is the maximum inter-story drift ratio obtained from finite element analysis under frequent earthquakes; is the maximum inter-story drift ratio calculated by the non-isolated shear inter-story model under frequent earthquakes; is defined as the torsional coupling factor, which corrects the shear inter-story model by accounting for the torsional coupling effect of the structure under bidirectional seismic excitation.
As a rapid estimation method based on response spectrum analysis, the proposed approach is normally supplemented by time-history analysis in practical finite element verification. When three ground motion records are selected for time-history analysis, the design results generally adopt the envelope value of time-history outputs, which is typically larger than the response spectrum results. To ensure that the rapid estimation method can envelope such discrepancies, an amplification factor of 1.35 is applied to the response spectrum calculation results, in accordance with the commentary on Clause 5.1.2 of the Reference [58].
2.5. 2D bisection algorithm for minimum damping search
The optimization variables are the total equivalent linear damping of VFDs in the and directions, i.e., . When the damping in one direction is fixed, increasing the damping in the orthogonal direction will not increase the isolation layer displacement, so the feasible domain exhibits monotonicity. Accordingly, a coupled 2D bisection method is employed to efficiently obtain the minimum damping solution.
For any given set of damping parameters , the following iterative search procedure is executed:
(1) The parameters are substituted into the and directions shear inter-story models respectively, to compute the directional CQC floor displacements under three seismic intensity levels: frequent earthquakes, moderate earthquakes and rare earthquakes.
(2) Based on the results obtained in Step 1, the torsional coupling factor and the 1.35-fold amplification factor are applied to derive the corrected values of design floor displacements and inter-story drift ratios for each seismic level.
(3) All constraint conditions are checked: the isolation layer displacement under rare earthquakes shall be no greater than the limit value; the inter-story drift ratios of all upper structure floors under frequent earthquakes shall be no greater than the limit value.
2.6. Parameter calculation method for nonlinear VFDs
The mode-superposition response spectrum method is formulated on the basis of equivalent linear damping, whereas VFDs widely adopted in engineering practice are nonlinear. Therefore, conversion between nonlinear damping and equivalent linear damping is necessary for estimating the parameters and quantity of dampers. The conversion approach is derived from the energy-equivalent linearization theory proposed by Syman, et al. [59], whose core principle is that the energy dissipated by a nonlinear VFD is identical to that dissipated by its equivalent linear counterpart within one period of simple harmonic vibration.
The force-velocity relationship of a nonlinear VFD is given by:
where, is the nonlinear damping coefficient of a single damper, denotes the velocity exponent, and represents the relative velocity between the two ends of the damper.
In the derivation, the dominant simple harmonic motion of the isolation layer is assumed as . By applying the principle of equal energy dissipation, the conversion formula between equivalent linear damping and nonlinear parameters can be obtained. For a damper with specified nonlinear parameters, its equivalent linear damping per unit is expressed as:
where, is the energy correction coefficient, as presented in Eq. (21); is the dominant modal circular frequency of the isolation layer, taken as the first vibration mode of the shear inter-story model; and is the displacement amplitude of the isolation layer:
where, denotes the gamma function.
Let be the total equivalent linear damping of VFDs in direction d calculated via the shear inter-story model. Then the required number of dampers to be deployed in direction is:
The equivalent damping and isolation layer displacement are mutually coupled. Hence, an inner iteration is required prior to each constraint verification: the displacement is first calculated with an initial damping value, and the equivalent damping is then updated. The constraint check described in Section 2.5 is executed only when the relative change of displacement falls below 1 %.
3. Automated design method for vibration-seismic dual control of steel spring isolation systems
3.1. Overview of the design process
Steel springs are generally used for vibration control in buildings where vertical vibration is dominant, with VFDs and limiters supplementarily controlling the horizontal deformation of the isolation layer under seismic action. Therefore, in accordance with Reference [4], the design method for steel spring isolation systems typically prioritizes vertical vibration control while treating horizontal seismic control as secondary. The specific design process is illustrated in Fig. 7.
Fig. 7Automatic design method for vibration and seismic dual control of steel spring isolation system
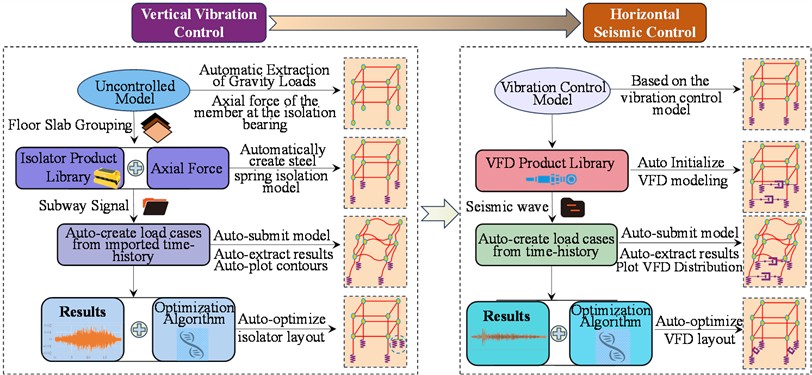
The design process for the vertical vibration control phase mainly includes:
(1) Automatically selecting isolators and establishing parametric models based on target frequency, axial force of vertical members, and product database.
(2) Importing subway excitation time-history curves and automatically setting up analysis conditions.
(3) Automatically computing and extracting results, converting floor acceleration and velocity outcomes into maximum frequency division vibration level and secondary radiated noise, and automatically generating result contour plots.
(4) If design results do not meet requirements, adjusting the layout of steel springs or updating the product database according to optimization algorithms.
The design process for the horizontal seismic control phase mainly includes:
(1) Building upon the vibration control model, initializing a finite element model incorporating VFDs in combination with the selected VFD product database.
(2) Importing ground motion time-history curves, establishing analysis conditions for different seismic levels, conducting automated analyses, extracting results, and compiling key performance indicators.
(3) Based on calculation results, employ optimization algorithms to propose several sets of damper parameters and layout schemes that satisfy structural performance requirements.
(4) Generating VFD distribution diagrams.
In the following sections, detailed explanations will be provided for five key aspects: automated modeling, calculation methods for maximum frequency division vibration level and secondary radiated noise, post-processing, and VFD optimization layout.
3.2. Automated establishment of the isolation model
This study employs the built-in API of SAP2000 to rapidly construct an isolation model from a non-isolated reference model based on a specified product database, while grouping target floor slabs to ensure the smooth execution of subsequent tasks. Prior to initiating the API-based modeling process, a validated non-isolated SAP model must be prepared, followed by implementation according to the logic outlined in Algorithm 1 (Table 1).
Table 1Algorithm 1: rapid establishment of an isolation structure from a non isolated structure
1 | Create the product library document |
2 | Define the vertical member group to be replaced with isolators |
3 | Define the node group of floor slabs to be evaluated |
4 | Extract axial forces of vertical members under gravity load conditions |
5 | Select isolators according to the axial forces of group |
6 | Record the numbers of the top and bottom nodes of vertical members in group |
7 | Establish isolators based on the results from steps 5 and 6 |
3.3. Calculation method for maximum frequency division vibration level
The vibration acceleration level defined by the Chinese National Standard Measurement Method of Environmental Vibration in Urban Areas [60] is given by Eq. (23):
where, is the vibration acceleration level, is the reference base acceleration (generally taken as 1×10⁻⁶ m/s2), and is the root-mean-square vibration acceleration.
The maximum vibration level per frequency band is an important indicator for vertical vibration control. In the automated program, it is calculated according to Algorithm 2 (Table 2), with weighting factors adopted based on reference [61].
Table 2Algorithm 2: calculation of maximum vibration level per frequency band VLmax
Parameters: – number of sampling points; – number of sampling points; – the -th segment; – overlap coefficient; – sampling frequency; – number of 1/3-octave center frequencies; – the -th frequency band; – effective acceleration of the -th waveform segment at the 1/3-octave center frequency ; – -th time-domain acceleration value obtained by applying the inverse Fourier transform to the acceleration within the -th frequency band of the -th waveform; – corresponding number of acceleration values; – vibration acceleration level at the one-third octave band center frequency for the -th calculated waveform; – maximum vibration level at the one-third octave band center frequency ; – -weighting factor for one-third octave band center frequencies; – reference vibration acceleration, taken as 10-6m/s2; Result: Maximum vibration level . | |
1 | Segment the subway vibration data into 1-second segments: , with 0.9. |
2 | Determine the 1/3-octave center, upper-bound, and lower-bound frequencies in the range of 4-200 Hz according to Table 3. |
3 | for 1 to do |
4 | for 1 to do |
5 | |
6 | |
7 | – calculate the frequency division vibration level using the peak-hold method. |
8 | – overall maximum vibration level across all frequency bands. |
Table 31/3-octave center, upper-bound, and lower-bound frequencies (Hz)
4 | 4.49 | 3.564 | 31.5 | 35.358 | 28.063 |
5 | 5.612 | 4.454 | 40 | 44.898 | 35.636 |
6.3 | 7.072 | 5.613 | 50 | 56.123 | 44.545 |
8 | 8.98 | 7.127 | 63 | 70.715 | 56.127 |
10 | 11.225 | 8.909 | 80 | 89.797 | 71.272 |
12.5 | 14.031 | 11.136 | 100 | 112.246 | 89.09 |
16 | 17.959 | 14.254 | 125 | 140.308 | 111.362 |
20 | 22.449 | 17.818 | 160 | 179.594 | 142.544 |
25 | 28.062 | 22.272 | 200 | 224.492 | 178.18 |
Note: (1) , and denote the 1/3-octave center, upper-bound, and lower-bound frequencies, respectively; (2) Calculation formulas: , , | |||||
3.4. Calculation method for secondary radiated noise
This paper adopts the method from reference [5] for predicting secondary structure-borne noise. In the prediction of secondary structure-borne noise, the equivalent A-weighted sound pressure level within the frequency range of 16-200 Hz is used as the evaluation index. Its calculation procedure is outlined in Algorithm 3 (Table 4).
Table 4Algorithm 3: calculation of equivalent a-weighted sound pressure level LAeq
Parameters: – number of 1/3-octave center frequencies; – the -th frequency band; – effective velocity at the 1/3-octave center frequency ; – the -th velocity value in the time domain obtained by inverse Fourier transform of the acceleration in the -th frequency band ; – corresponding number of velocity values; : one-third octave band vibration velocity level; : one-third octave band sound pressure level; – reference vibration velocity, taken as 10−9 m/s; – sound radiation efficiency, taken as 1; – average room height; – indoor reverberation time, generally ranging from 1.0 to 1.6 s, and taken as 1 s in this study; – a-weighting correction value (in dB) for the -th frequency band [], as detailed in Table 5. Result: Equivalent A-weighted sound pressure level . | |
1 | Determine the 1/3-octave center, upper-bound, and lower-bound frequencies in the range of 16-200 Hz according to Table 3. |
2 | for 1 to do |
3 | |
4 | |
5 | |
6 |
Table 5A-weighting grid correction values from ISO 2631-1-1985
1/3-octave center frequency (Hz) | Correction value (dB) | 1/3-octave center frequency (Hz) | Correction value (dB) |
16 | –56.7 | 63 | –26.2 |
20 | –50.5 | 80 | –22.5 |
25 | –44.7 | 100 | –19.1 |
31.5 | –39.4 | 125 | –16.1 |
40 | –34.6 | 160 | –13.4 |
50 | –30.2 | 200 | –10.4 |
3.5. Post-processing
The analysis of vertical vibration isolation models requires extracting large volumes of computational results, such as velocity and acceleration values from target floor nodes. In typical projects, the number of target nodes can reach tens of thousands, and when the time-history conditions are lengthy, the amount of extracted data may amount to hundreds of millions of records, with file sizes measured in GBs. Manual extraction is costly and time-consuming, often taking several hours, which is highly inefficient. By implementing automated result extraction via the API, the required time is reduced to only 1/4 to 1/5 of the manual approach, which significantly shortens the project design cycle. Moreover, the structured data extracted can be directly utilized in subsequent processing stages.
3.6. Optimization method for VFD layout
3.6.1. Optimization model
Manual trial-and-error adjustment of the layout positions and performance parameters of VFDs has notable limitations. It not only entails heavy computational workload, but also makes it difficult to simultaneously satisfy multiple design objectives such as engineering cost and deformation control of the isolation layer under different seismic fortification levels under multi-dimensional constraints. To address this issue, this section establishes a complete multi-objective optimization framework for VFDs. An intelligent optimization algorithm is adopted to automatically search for compliant design schemes, which can not only quickly identify feasible configurations, but also screen out the optimal scheme from a large number of feasible solutions, achieving an effective balance between design efficiency and the coordinated performance of multiple indicators.
(1) The optimization objective function.
The optimization objective function comprehensively considers economic efficiency and seismic reduction performance and is constructed as follows:
where, is the objective function, which comprehensively considers the number of VFDs (cost) and the vibration reduction performance under moderate and rare earthquakes. The first three terms of represent the economic indicator, the vibration reduction effectiveness under moderate earthquakes, and under rare earthquakes, respectively. is the set of design parameters; is the total number of positions where VFDs can be placed; is the number of VFDs placed in the model; , , , are the maximum deformation values of the isolation layer in the and directions under moderate and rare earthquakes, respectively; and are the deformation limits of the isolation layer under moderate and rare earthquakes, respectively; and is a penalty term used to account for constraint violations. The design parameters include whether a VFD is placed at the -th position, as well as the VFD's nonlinear stiffness , damping coefficient C, and exponent , totaling dimensions.
(2) Constraint conditions.
The optimization process must simultaneously satisfy two types of hard constraints: the displacement limits of the isolation layer and the lower limit of the system damping ratio. The constraint set is denoted as :
where, is the boundary damping ratio, defined as the total system damping ratio when the maximum deformation of the isolation layer exactly equals the displacement limit.
To quickly eliminate infeasible solutions that violate the constraints, a piecewise penalty term is introduced:
A large penalty value is imposed when any constraint is violated, which significantly increases the objective function value; the penalty term takes a value of 0 when all constraints are satisfied.
3.6.2. Selection of optimization algorithm
The optimization variables consist of discrete decision variables for damper layout positions and continuous parameters representing damping performance, forming a mixed-variable optimization problem. Traditional gradient-based algorithms such as gradient descent and Newton methods are only applicable to fully continuous design spaces and fail to address the discrete binary logic of “install / not install” at candidate layout positions. Accordingly, the NSGA-II multi-objective genetic algorithm is adopted in this study for heuristic optimization, and the complete iterative procedure is presented Algorithm 4 (Table 6).
Table 6Algorithm 4: VFD layout and parameter optimization
Parameters: “VFD”- link property named VFD; “FVFD”- link property named FVFD; when a link property is set to "FVFD", it indicates that no VFD is placed at that location; – denotes the -th generation population; – maximum number of generations for the genetic algorithm; – number of best individuals to be selected. Result: optimal models. | |
1 | Randomly sample the VFD database to determine the initial population. |
2 | Based on the initial population, set link properties to either “VFD” or “FVFD”. |
3 | for 1 to do |
4 | Invoke SAP to evaluate each individual in the population sequentially and compute the objective function. |
5 | Generate a new population based on NSGA-II and the objective function through selection, crossover, and mutation. |
6 | From all evaluated individuals, select individuals with the smallest objective function values, summarize their parameters, and invoke SAP for modeling. |
7 | Generate VFD distribution diagrams. |
3.6.3. Algorithm acceleration strategies
To reduce the iterative time consumption of large-scale engineering models, this paper incorporates multiple speed-up mechanisms:
(a) Early convergence termination mechanism: If the variation of the optimal objective function value of the population over ten consecutive generations is smaller than the preset threshold, the algorithm is deemed converged and the iteration is terminated directly.
(b) Pre-elimination mechanism: When the VFD deployment proportion of an individual falls below the threshold, the finite element calculation is skipped and a high penalty value is assigned directly.
(c) Parallel computing: Multiple instances of the SAP2000 program are launched simultaneously to evaluate multiple individuals in parallel, which markedly reduces the solution duration of each generation.
(d) Hierarchical iteration strategy: The population size and maximum iteration steps are dynamically adjusted according to the design stage, so as to strike a balance between computational efficiency and optimization accuracy.
4. Application case
4.1. Project overview
This study takes a building within a music academy as a representative case. The academy is located merely one hundred meters away from a subway line and houses multiple noise-sensitive spaces such as theaters and concert halls. In the architectural design, a steel spring-VFD system is employed to achieve dual control of vibration and seismic responses for the building.
4.2. Vertical vibration control
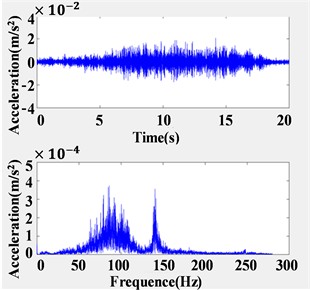
The vertical vibration control stage involves two models: the non-isolated model (M0) and the automatically generated steel-spring isolation model (M1). Subway vibration source data are input into the models as vertical acceleration time-history conditions, with a sampling frequency of 560 Hz, as illustrated in Fig. 8. The maximum vibration level per frequency band and the secondary radiated noise are calculated via the linear time-history method with direct integration. In SAP2000, isolators and viscous dampers are simulated using Link elements.
Fig. 8Input vibration source acceleration time-history curve and spectrum diagram
4.2.1. Verification of maximum vibration level per frequency band
The maximum frequency division vibration level for models , , and their difference at target floor slabs are shown in Fig. 9. The maximum frequency division vibration level for ranges between 67.7 dB and 81.8 dB, indicating that all floor slabs fail to meet the limit requirement of 62 dB specified in Reference [61].
Fig. 9Maximum frequency division vibration level for models M0 and M1
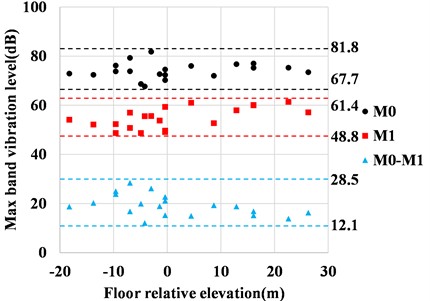
After implementing steel spring isolation, the maximum frequency division vibration level for ranges between 48.8 dB and 61.4 dB, all of which satisfy the code requirements. The difference between the two models ranges from 12.1 dB to 28.5 dB, with vibration level attenuation rates across floors ranging from 64 % to 82 %. The vibration level attenuation rate is defined by Eq. (27). The contour plots of the maximum frequency division vibration level for and at a specific relative elevation floor slab are shown in Fig. 10 and Fig.11, respectively. A comparison reveals that the vibration levels of the controlled floor slabs are significantly lower than those of the uncontrolled structure, demonstrating that the steel springs selected by the automated program achieve effective performance in the vertical vibration isolation stage:
where, is the maximum frequency division vibration level of a target floor slab in , and is the corresponding maximum frequency division vibration level of the same floor slab in .
Fig. 10Contour plot of the maximum frequency division vibration level for a specified elevation floor slab in model M0
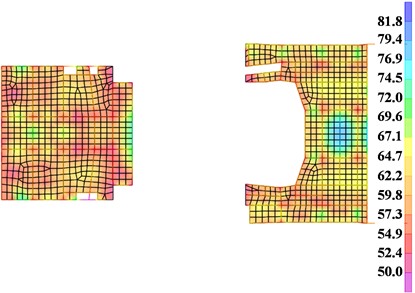
Fig. 11Contour plot of the maximum frequency division vibration level for a specified elevation floor slab in model M1
4.2.2. Verification of secondary radiated noise
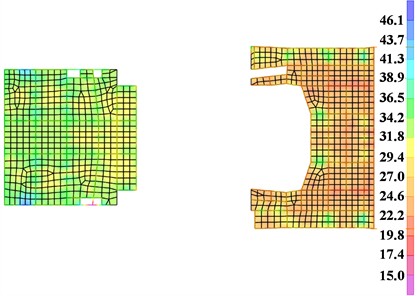
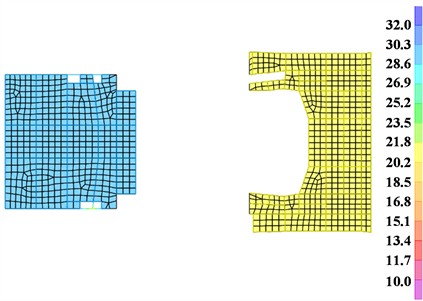
The secondary radiated noise for models , , and the difference between the two models at the target floor slabs are shown in Fig. 12. The secondary radiated noise for ranges from 17.3 dB(A) to 46.1 dB(A), with some floor slabs not meeting the limit requirement of 35 dB(A) specified in Reference [61]. After implementing steel spring isolation, the secondary radiated noise for ranges from 15.9 dB(A) to 30.1 dB(A), all of which satisfy the code requirements. The difference between the two models ranges from 1.4 dB(A) to 19.1 dB(A), with the attenuation rates of secondary radiated noise across floors ranging from 51 % to 92 %. The contour plots of the secondary radiated noise for and at a specific relative elevation floor slab are shown in Fig. 13 and Fig. 14, respectively. A comparison shows that the secondary radiated noise of the controlled floor slabs are significantly lower than those of the uncontrolled structure, and the noise amplitude distribution is more uniform, further demonstrating the effectiveness of the automated vibration isolation design method.
Fig. 12Secondary radiated noise for models M0 and M1
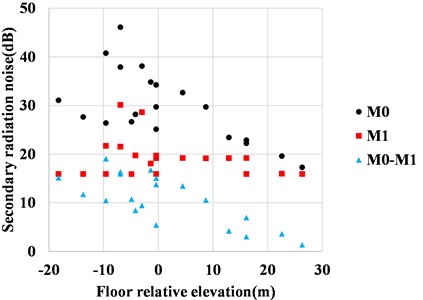
Fig. 13Secondary noise contour plot for a specified elevation floor slab in model M0
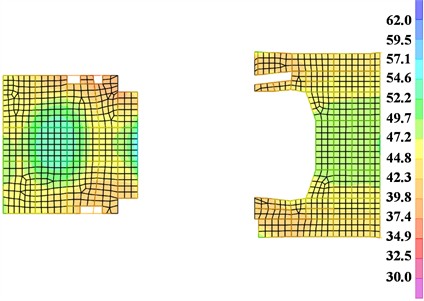
Fig. 14Secondary noise contour plot for a specified elevation floor slab in model M1
4.3. Seismic verification of the isolation system
Based on the vibration isolation analysis, seismic analysis of the structure is conducted, employing both time-history analysis and response spectrum analysis for verification. For moderate and rare earthquake levels, two natural waves and one artificial wave [58] are selected. The seismic waves are input into the model in three directions, with peak acceleration ratios of 1:0.85:0.65. The horizontal displacement limits for the isolation layer under moderate and rare earthquake conditions are set as 10 mm and 20 mm, respectively.
The maximum deformation of the isolation layer from the time-history analysis is shown in Fig. 15, and the deformations from the response spectrum analysis are presented in Table 7. In the time-history analysis, the maximum deformations of the isolation layer in the -direction under moderate and rare earthquakes are 10.82 mm and 20.08 mm, respectively. In the response spectrum analysis, the corresponding maximum deformations are 10.12 mm and 22.91 mm, both of which exceed the specified limits and do not meet the requirements. Therefore, the installation of VFDs is necessary to control the deformation of the isolation layer.
Fig. 15Deformation of the isolation layer from time-history analysis
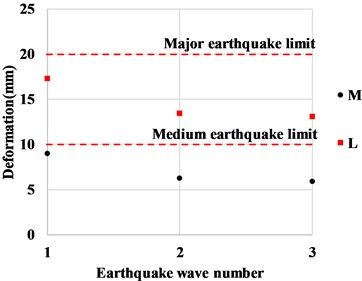
a) Isolation layer deformation in -direction
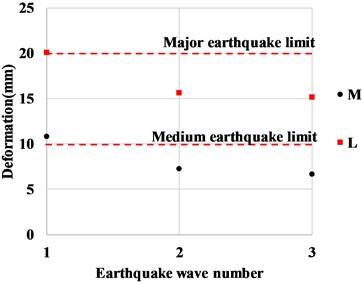
b) Isolation layer deformation in -direction
Table 7Maximum horizontal deformation of isolators under response spectrum conditions
Condition name | Deformation in -direction (mm) | Deformation in -direction (mm) |
Moderate earthquake | 8.71 | 10.12 |
Rare earthquake | 19.67 | 22.91 |
4.4. Optimization design of VFDs
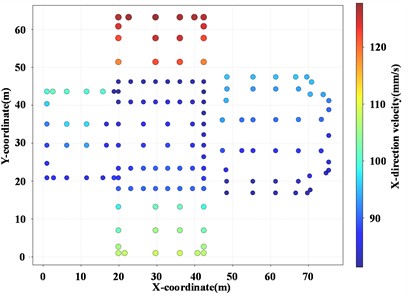
VFDs should be evenly distributed at locations where structural deformation (or velocity) is relatively large in both directions. For this purpose, the maximum velocities of the isolation springs in the and directions, along with the proposed layout of VFDs in both directions, are plotted in Fig. 16.
Fig. 16Maximum velocity of M1 isolators and proposed layout of VFDs
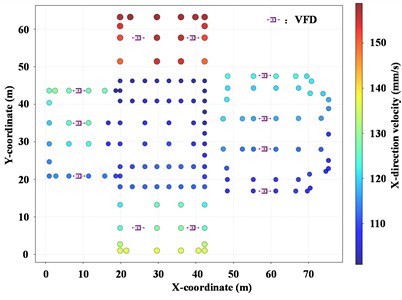
a)-direction
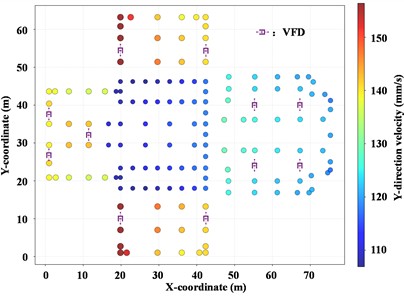
b)-direction
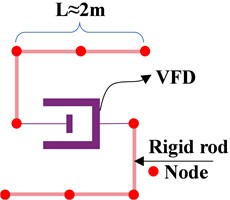
During the modeling of VFDs, it is essential to ensure that their positions align with the actual installation locations. In SAP2000, rigid bar elements are employed to simulate the upper and lower concrete short walls, thereby guaranteeing the accuracy of the VFD modeling. The modeling approach for VFDs is illustrated in Fig. 17.
Fig. 17VFD modeling method in SAP2000
According to the code requirements [58], in addition to time-history analysis, response spectrum analysis of the structure is also required. The additional damping ratio adopted in the response spectrum analysis is determined from the time-history analysis curves of the VFDs. During the response spectrum analysis, this additional damping ratio is taken as the minimum value calculated from each time-history condition. This paper employs the energy curve comparison method to calculate the additional damping ratio:
where, is the additional damping ratio, is the inherent damping ratio of the structure, is the energy dissipated by all energy-dissipating components, and is the energy dissipated corresponding to the inherent damping ratio of the structure.
Table 8Critical damping ratios
Seismic intensity | Critical damping ratio | Maximum isolation layer deformation |
Moderate earthquake | 0.0463 | 10.0 mm |
Rare earthquake | 0.0976 | 20.0 mm |
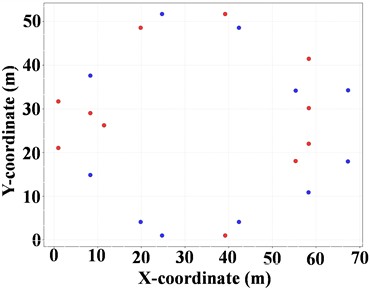
The automated program first calculates the critical damping ratios, as shown in Table 8. When performing optimization design using the automated program, either only the parameters of the VFDs can be optimized, or both the parameters and the layout positions of the VFDs can be optimized simultaneously. When optimizing only the parameters of the VFDs, the settings are configured as follows: population size of 20 and generation count of 10. The results, parameters, and objective functions for the top five optimal solutions under time-history conditions are presented in Table 9. It can be observed that the target displacements of all models meet the requirements, and the total damping ratios all exceed the critical damping ratios listed in Table 8, thereby ensuring that the results of the response spectrum calculations will satisfy the displacement limits, where is the effective stiffness of the VFD (kN/mm), with a value range of [min = 100, max = 200, interval = 25] (kN/mm); is the damping coefficient of the VFD (kN/(mm/s)), with a value range of [min = 50, max = 600, interval = 50] kN(s/mm); is the exponent of the VFD, with a value range of [min = 0.2, max = 0.4, interval = 0.05]; , , and are the maximum displacements of the isolation layer in the and directions under moderate and rare earthquakes, respectively; and are the minimum effective damping ratios of the time-history curves under moderate and rare earthquakes, respectively; is the objective function.
During VFD optimization, it is possible to optimize both the parameters and the planar layout of the VFDs. The parameter settings are as follows: population size of 10 and generation count of 20. The program generates two sets of VFD parameters and corresponding layouts that meet the requirements, as shown in Table 10. The top-ranked VFD layout is illustrated in Fig. 18. As shown in Table 6, the damping coefficients of the dampers are all set to relatively high values, indicating that the feasible solutions approach the upper bounds of the parameter ranges. This suggests that the current number of VFDs is appropriate and should not be further reduced.
Table 9Top five optimal VFD parameter sets and results without considering planar layout optimization
Rank | 1 | 2 | 3 | 4 | 5 |
82500 | 110000 | 60000 | 37500 | 60000 | |
550 | 550 | 400 | 250 | 400 | |
0.4 | 0.35 | 0.3 | 0.4 | 0.25 | |
3.38 | 3.5 | 3.76 | 3.75 | 3.75 | |
4.1 | 4.36 | 5.6 | 6.22 | 5.93 | |
6.54 | 7.01 | 9.14 | 9.59 | 10.06 | |
9.55 | 10.37 | 12.77 | 13.48 | 13.65 | |
0.0773 | 0.0786 | 0.0864 | 0.0905 | 0.087 | |
0.0987 | 0.1 | 0.101 | 0.1 | 0.098 | |
1.55 | 1.66 | 2.03 | 2.15 | 2.15 |
Table 10Two optimal VFD models considering planar layout
Rank | 1 | 2 |
60000 | 105000 | |
600 | 600 | |
0.4 | 0.35 | |
3.94 | 4.02 | |
5.47 | 4.45 | |
10.46 | 10.78 | |
13.88 | 12.96 | |
0.0838 | 0.0791 | |
0.0986 | 0.0982 | |
2.66 | 2.76 |
Fig. 18Rank 1 VFD layout diagram (VFD: blue, FVFD: red)
The hysteresis curves of the VFDs after program optimization are shown in Fig. 19, demonstrating full and well-formed damping loops. The velocity diagrams of the isolation layer in the and directions with VFDs installed are presented in Fig. 20. Compared with Fig. 16, the maximum relative velocity of the isolation layer is reduced from approximately 150 mm/s to 120 mm/s. These results collectively confirm the effectiveness of the automated VFD optimization program.
Fig. 19Hysteresis curves of VFDs
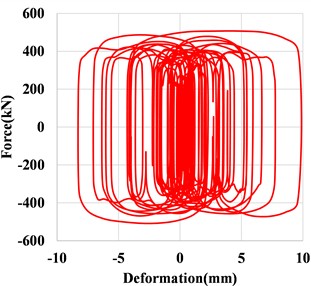
Fig. 20Maximum velocity diagram of M2 isolators
a)-direction
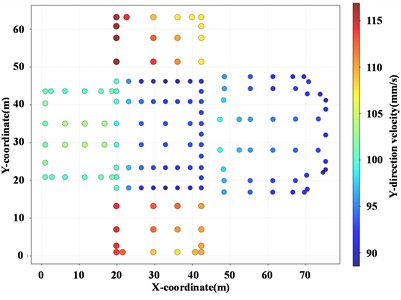
b)-direction
4.5. Rapid damper selection
In this section, the rapid VFD selection method based on the shear inter-story model introduced in Chapter 2 is adopted, and the selection results obtained are compared with those derived from refined finite element calculation via SAP2000 in Section 4.4.
To verify the accuracy of the shear inter-story model, the natural periods and mode shapes of the simplified model and the finite element model in both and directions are compared. The variation of mode shape vectors along the floor height is shown in Fig. 21, and the comparison of natural periods is summarized in Table 11. The Modal Assurance Criterion (MAC, as defined in Eq. (29)) values of the two models in the two directions reach 0.982 and 0.995 respectively, with corresponding relative errors of natural periods of 4.4 % and 4.8 %. The results demonstrate that the shear inter-story model has high calculation precision:
Table 11Natural periods of the finite element model and the non-isolated shear inter-story model
Direction | Finite element model / s | Shear inter-story model / s | Error |
0.748 | 0.715 | 4.4 % | |
0.693 | 0.660 | 4.8 % |
A vibration isolation model is constructed, and the shear inter-story model is applied to estimate the required quantity of VFDs. The model parameters are listed in Table 12. Two damper specifications are adopted, both with a damping coefficient of 600 kN/(mm/s), and the velocity exponents are set to 0.35 and 0.4 respectively. The VFD quantities estimated by the shear inter-story model and the finite element model are summarized in Table 13.
Fig. 21Comparison of mode shapes between the inter-story model and the finite element model
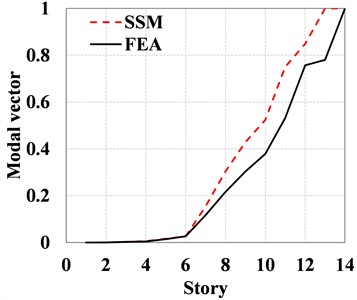
a)-direction
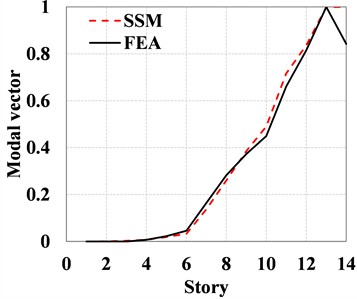
b)-direction
The table presents the VFD quantities in the and directions estimated via shear-story simulation. By comparing the estimated value from the shear inter-story model with the results from the refined finite element model, it can be observed that under the two parameter scenarios, the VFD quantities yielded by the shear inter-story model are 1.47 times and 1.55 times the accurate results, respectively.
The results demonstrate that the VFD quantity and corresponding cost estimated by the shear inter-story model are fully rational. This approach can not only ensure the design safety of the vibration isolation layer, but also guarantee the economic reasonableness of cost estimation in the schematic design phase.
Table 12Values of parameters for inter-story model
Story No. | 1 | 2 | 3 | 4 | 5 | 6 | 7 |
Story height (m) | 0.5 | 1.5 | 8.65 | 2.65 | 3.95 | 2.60 | 4.85 |
Story mass (t) | 69 | 1940 | 4090 | 2470 | 2839 | 4762 | 2670 |
Story stiffness , (kN/m) | 7682/5327 | 2423/1579 | 344/410 | 228/193 | 79/78 | 74/60 | 6/8.3 |
Story No. | 8 | 9 | 10 | 11 | 12 | 13 | 14 |
Story height (m) | 4.25 | 4.2 | 3.2 | 6.5 | 3.7 | 6.3 | 4.2 |
Story mass (t) | 2470 | 4369 | 3156 | 3450 | 1168 | 1800 | 4.5 |
Story stiffness , (kN/m) | 5/6.7 | 5.5/6.2 | 5.7/5.9 | 1.8/2.1 | 2.2/2.1 | 0.9/1 | 92/100 |
Table 13Number of VFDs estimated by the shear inter-story model and the finite element model
Velocity exponent | Direction | (N·s/m) | VFD quantity from finite element calculation | ||
0.35 | 1.08e7 | 2 | 22 | 15 | |
1.60e8 | 20 | ||||
0.4 | 1.08e7 | 1 | 17 | 11 | |
1.60e8 | 16 |
4.6. Comparison between manual design and automated design
During the implementation phase of this project, the complete design of the vibration isolation system was first completed using the traditional manual design method. After the project was delivered, the automated design method proposed in this paper was adopted to perform re-calculation and comparative verification for the project. A statistical comparison of the time consumption of the two methods was conducted covering four procedures: steel spring bearing selection, isolation model establishment, optimal VFD layout, and calculation result extraction and plotting, as presented in Table 14.
As indicated by the data in the table, the total time consumption of the automated design method is far lower than that of the traditional manual design method. Since the automated design workflow requires barely any repeated manual operations or parameter verifications, its total duration is approximately equivalent to the pure computation time of the software. It should be noted that the time statistics in the table correspond to a single complete design cycle. In practical engineering projects, the design scheme normally undergoes multiple rounds of adjustment and iterative optimization, which will greatly extend the total cycle of manual design. Under such circumstances, the efficiency advantage of the automated design method will become even more prominent.
Table 14Comparison of time consumption between manual design method and automated design method
Design phase | Manual design method | Automated design method |
Steel spring selection | 1 d | < 5 min |
Vibration isolation modeling | 2 d | < 5 min |
Optimal VFD layout | 7 d | < 2 h |
Result processing | 3 d | < 5 h |
5. Conclusions
To address the issue that the design of steel spring-VFD systems with integrated control of vibration and seismic vibration for noise-sensitive buildings along metro lines relies heavily on manual parameter tuning and lacks standardized automated workflows, this paper proposes a fast damper selection method based on the torsion-decoupled shear inter-story model, and constructs a full-process automated design framework using SAP2000 API.
The proposed method and automated design framework are validated against a practical conservatory of music project, with the main conclusions as follows:
1) The VFD quantity estimated by the proposed simplified inter-story model is approximately 1.5 times that yielded by the refined SAP2000 model, which can serve as a VFD quantity estimation tool at the scheme stage.
2) The automated design program developed based on the SAP2000 API integrates core modules including intelligent steel spring selection, parametric generation of vibration isolation models, batch extraction of vibration and noise indicators, and NSGA-II multi-objective optimization, realizing the digitalization of the entire design process for steel spring vibration isolation systems. Compared with conventional manual design methods, it significantly shortens the design cycle, and its efficiency advantage is particularly prominent in engineering projects with multiple rounds of scheme iteration.
3) The engineering case verifies that the steel spring-VFD system delivers excellent performance in integrated control of vibration and seismic vibration. In terms of vertical vibration control, the maximum 1/3-octave vibration level of the target floor is reduced by 12.1-28.5 dB with a vibration attenuation rate of 64 %-82 %; the secondary radiated noise is lowered by 1.4-19.1 dB(A) with a noise attenuation rate of 51 %-92 %, fully complying with the limit requirements of relevant standards.
4) VFDs can effectively suppress the deformation and relative velocity of the isolation layer under multi-level seismic excitations. The embedded NSGA-II optimization algorithm can balance seismic control performance and construction cost under the premise of satisfying multi-level deformation constraints, and provide multiple feasible schemes tailored to different design priorities.
Despite the research achievements in this work, systematic field tests and measurements are still required after project completion in follow-up research to verify the actual in-service performance of buildings designed by the proposed method.
References
-
“2024 annual statistics and analysis report on urban rail transit,” (in Chinese), China Urban Rail Transit Association, Beijing, China, 2025.
-
G. S. Han, “The micro vibration of urban rail transit impact on ancient building,” (in Chinese), Xi’an University of Architecture and Technology, Xi’an, China, 2011.
-
W. Geng et al., “Prediction of the influence of the proposed Beijing metro line 16 on a precise instrument of Peking University,” (in Chinese), Earthquake Engineering and Engineering Dynamics, Vol. 34, No. 6, pp. 19–25, 2014.
-
“Technical standard for integrated control of engineering vibration and seismic vibration of building engineering,” (in Chinese), China Architecture & Building Press, Beijing, China, T/CECS 1234-2023, 2023.
-
P. Pan, S. Shen, Z. Shen, and R. Gong, “Experimental investigation on the effectiveness of laminated rubber bearings to isolate metro generated vibration,” Measurement, Vol. 122, pp. 554–562, Jul. 2017, https://doi.org/10.1016/j.measurement.2017.07.019
-
H. W. Chen, “Application of thick rubber bearing in vibration isolation for metro surrounding building,” (in Chinese), Tsinghua University, Beijing, China, 2014.
-
T. Sheng et al., “Base isolation of buildings for subway-induced environmental vibration: field experiments and a semi-analytical prediction model,” The Structural Design of Tall and Special Buildings, Vol. 29, No. 16, p. e1798, 2020, https://doi.org/10.1002/tal.1798
-
T. Wang, F. Wang, and L. T. Ding, “Theoretical and experimental study on three-dimensional seismic isolation technology for nuclear power plants,” (in Chinese), China Civil Engineering Journal, Vol. 45, No. S1, pp. 238–242, 2012.
-
Z.-D. Xu, T. Zhang, and X.-H. Huang, “Dynamic analysis of three-directional vibration isolation and mitigation for long-span grid structure,” Journal of Constructional Steel Research, Vol. 202, p. 107758, Jan. 2023, https://doi.org/10.1016/j.jcsr.2022.107758
-
Z.-D. Xu, X.-H. Huang, and L.-H. Lu, “Experimental study on horizontal performance of multi-dimensional earthquake isolation and mitigation devices for long-span reticulated structures,” Journal of Vibration and Control, Vol. 18, No. 7, pp. 941–952, 2011, https://doi.org/10.1177/1077546311418868
-
J. Suhara, T. Tamura, Y. Okada, and K. Umeki, “Development of three dimensional seismic isolation device with laminated rubber bearing and rolling seal type air spring,” in Seismic Engineering, Volume 2, pp. 43–48, 2002, https://doi.org/10.1115/pvp2002-1430
-
T. Shimada, J. Suhara, and K. Inoue, “Three dimensional seismic isolation system for next-generation nuclear power plant with rolling seal type air spring and hydraulic rocking suppression system,” in Volume 8: Seismic Engineering, Vol. 8, pp. 183–190, 2005, https://doi.org/10.1115/pvp2005-71376
-
Q. Han, M. Jing, Y. Lu, and M. Liu, “Mechanical behaviors of air spring-FPS three-dimensional isolation bearing and isolation performance analysis,” Soil Dynamics and Earthquake Engineering, Vol. 149, p. 106872, 2021, https://doi.org/10.1016/j.soildyn.2021.106872
-
H. Zhang, X. Liang, Z. Gao, and X. Zhu, “Seismic performance analysis of a large-scale single-layer lattice dome with a hybrid three-directional seismic isolation system,” Engineering Structures, Vol. 214, p. 110627, Apr. 2020, https://doi.org/10.1016/j.engstruct.2020.110627
-
Y. Cao et al., “Mechanical properties and isolation effect of disc spring-single friction pendulum 3D vibration isolation device,” (in Chinese), Journal of Building Structures, Vol. 43, No. 7, pp. 44–53, 2022.
-
Y. Cao, P. Peng, H. Wang, J. Sun, G. Xiao, and Z. Zuo, “Development of an innovative three-dimensional vibration isolation bearing,” Engineering Structures, Vol. 295, p. 116890, Sep. 2023, https://doi.org/10.1016/j.engstruct.2023.116890
-
Y. Cao, P. Pan, Z. He, J. Sun, J. Wen, and G. Mao, “In situ tests of building structures isolated by innovative three-dimensional vibration isolation bearings,” Earthquake Engineering and Structural Dynamics, Vol. 54, No. 1, pp. 146–163, 2024, https://doi.org/10.1002/eqe.4250
-
Y. Zhou, P. Chen, and G. Mosqueda, “Numerical studies of three-dimensional isolated structures with vertical quasi-zero stiffness property,” Journal of Earthquake Engineering, Vol. 26, No. 7, pp. 3601–3622, May 2022, https://doi.org/10.1080/13632469.2020.1813662
-
T. Yu et al., “Experimental and numerical studies of a novel three-dimensional isolation device incorporating disc springs with U-shaped dampers,” Soil Dynamics and Earthquake Engineering, Vol. 174, p. 108164, Aug. 2023, https://doi.org/10.1016/j.soildyn.2023.108164
-
Y. Liu, J. Li, and G. Lin, “Nonlinear seismic assessment for nuclear power plants with structural-geotechnical hybrid isolation strategy,” Structures, Vol. 67, p. 107020, Aug. 2024, https://doi.org/10.1016/j.istruc.2024.107020
-
X. Zhu, G. Lin, R. Pan, and J. Li, “Design and analysis of isolation effectiveness for three-dimensional base-seismic isolation of nuclear island building,” Nuclear Engineering and Technology, Vol. 54, No. 1, pp. 374–385, 2021, https://doi.org/10.1016/j.net.2021.07.018
-
Y. Liu, J. Li, and G. Lin, “Seismic mitigation analysis of three-dimensional base-isolated nuclear structures with soil-dependent isolation system under extreme earthquakes,” Engineering Structures, Vol. 311, p. 118187, May 2024, https://doi.org/10.1016/j.engstruct.2024.118187
-
Z. Gu et al., “Seismic response analysis and damage calculation of long-span structures with a novel three-dimensional isolation system,” Buildings, Vol. 14, No. 6, p. 1715, Jun. 2024, https://doi.org/10.3390/buildings14061715
-
T. Sheng, G.-B. Liu, X.-C. Bian, W.-X. Shi, and Y. Chen, “Development of a three-directional vibration isolator for buildings subject to metro – and earthquake-induced vibrations,” Engineering Structures, Vol. 252, p. 113576, 2021, https://doi.org/10.1016/j.engstruct.2021.113576
-
G.-B. Nie, C.-X. Zhang, Z.-Y. Wang, W.-D. Xu, and Y.-J. Shi, “Shaking table test of space double-layer cylindrical reticulated shell with three-dimensional isolation bearing,” Journal of Constructional Steel Research, Vol. 189, p. 107107, Dec. 2021, https://doi.org/10.1016/j.jcsr.2021.107107
-
T. Yu, Z. Huang, C. Zhang, W. Huang, W. Bao, and Y. Liu, “Numerical investigation of three-dimensional isolator and mitigation for single-layer lattice shell structure,” Structures, Vol. 62, p. 106235, Mar. 2024, https://doi.org/10.1016/j.istruc.2024.106235
-
M. Sha, M. Guan, M. Lin, X. Tan, and X. Chen, “Experimental study on the cyclic performance of innovative self-centering three-dimensional isolation bearing,” Structures, Vol. 69, p. 107587, Oct. 2024, https://doi.org/10.1016/j.istruc.2024.107587
-
J. Li et al., “Finite element modeling and performance evaluation of a novel 3D isolation bearing,” Buildings, Vol. 15, No. 14, p. 2553, Jul. 2025, https://doi.org/10.3390/buildings15142553
-
M. M. Pourmasoud, J. B. P. Lim, I. Hajirasouliha, and D. Mccrum, “Multi-directional base isolation system for coupled horizontal and vertical seismic excitations,” Journal of Earthquake Engineering, Vol. 26, No. 3, pp. 1145–1170, Feb. 2022, https://doi.org/10.1080/13632469.2020.1713925
-
D. Wu, Y. Xiong, and Z. Yang, “Numerical and experimental study of mechanical behaviors of the steel-confined rubber bearing,” Construction and Building Materials, Vol. 352, p. 128900, Sep. 2022, https://doi.org/10.1016/j.conbuildmat.2022.128900
-
W. Eltahawy, K. L. Ryan, S. Cesmeci, and F. Gordaninejad, “Parameters affecting dynamics of three-dimensional seismic isolation,” Journal of Earthquake Engineering, Vol. 25, No. 4, pp. 730–755, Mar. 2021, https://doi.org/10.1080/13632469.2018.1537902
-
Q. Liang, W. Luo, Y. Zhou, X. Ke, and J. Li, “Seismic performance of a novel three-dimensional isolation bearing,” Journal of Building Engineering, Vol. 57, p. 104818, Jun. 2022, https://doi.org/10.1016/j.jobe.2022.104818
-
G. Huffmann, “Spring-damper systems for the support of structures to prevent earthquake damage,” in Proceedings of the 7th World Conference on Earthquake Engineering, Vol. 8, pp. 167–168, 1980.
-
G. K. Huffman, “Full base isolation for earthquake protection by helical springs and viscous dampers,” Nuclear Engineering and Design, Vol. 84, pp. 331–338, 1985.
-
S. S. Tezcan and A. Civi, “Efficiency of helical springs and viscodampers in base isolation,” Engineering Structures, Vol. 14, No. 2, pp. 66–74, Mar. 2003, https://doi.org/10.1016/0141-0296(92)90033-m
-
N. Makris and M. C. Constantinou, “Spring-viscous damper systems for combined seismic and vibration isolation,” Earthquake Engineering and Structural Dynamics, Vol. 21, No. 8, pp. 649–664, 2007, https://doi.org/10.1002/eqe.4290210801
-
T. T. Soong and M. C. Constantinou, Passive and Active Structural Vibration Control in Civil Engineering. New York, NY, USA: Springer-Verlag, 1994.
-
H. G. Wagner, “Vibration control systems for trackbeds and buildings using coil steel springs,” in Proceedings of Acoustics, pp. 99–104, 2004.
-
X. Li, S. Xue, and Y. Cai, “Three-dimensional seismic isolation bearing and its application in long span hangars,” Earthquake Engineering and Engineering Vibration, Vol. 12, No. 1, pp. 55–65, Mar. 2013, https://doi.org/10.1007/s11803-013-0151-7
-
D. Lee and M. C. Constantinou, “Combined horizontal-vertical seismic isolation system for high-voltage-power transformers: development, testing and validation,” Bulletin of Earthquake Engineering, Vol. 16, No. 9, pp. 4273–4296, 2018, https://doi.org/10.1007/s10518-018-0311-2
-
S. Shang, Z. Wang, Y. Xiao, and X. Cui, “Experimental and numerical study of the spring-asphalt 3D isolation structures under multi-component ground motions,” Bulletin of Earthquake Engineering, Vol. 18, No. 5, pp. 2461–2496, Jan. 2020, https://doi.org/10.1007/s10518-019-00778-y
-
W. Dong, Y. Shi, Q. Wang, Y. Wang, and J.-B. Yan, “Development of a long-period vertical base isolation device with variable stiffness for steel frame structures,” Soil Dynamics and Earthquake Engineering, Vol. 164, p. 107638, Nov. 2022, https://doi.org/10.1016/j.soildyn.2022.107638
-
P. Zhuang, L. Wei, W. Wang, and M. Han, “Feasibility evaluation of pre-pressed spring devices for vertical isolation of single-layer spherical lattice shell structures,” Soil Dynamics and Earthquake Engineering, Vol. 158, p. 107308, Apr. 2022, https://doi.org/10.1016/j.soildyn.2022.107308
-
P. Zhuang, W. Zhao, and T. Y. Yang, “Seismic protection of a single-layer spherical lattice shell structure using a separated three-dimensional isolation system,” Soil Dynamics and Earthquake Engineering, Vol. 172, p. 108026, May 2023, https://doi.org/10.1016/j.soildyn.2023.108026
-
P. Zhuang, H. Zhang, G. Zhang, and T. Y. Yang, “Seismic response control of large-span suspend-dome structures using multidimensional isolation systems,” Structures, Vol. 65, p. 106675, Jun. 2024, https://doi.org/10.1016/j.istruc.2024.106675
-
G. Nie, Z. Wang, J. Zhong, H. Li, and X. Zhu, “Numerical investigations of seismic responses of non-isolated and isolated double-layer cylindrical reticulated shells with substructure,” Structures, Vol. 59, p. 105804, Dec. 2023, https://doi.org/10.1016/j.istruc.2023.105804
-
Y. Shi et al., “Shaking table test of a steel frame structure with layered three-dimensional isolation,” Earthquake Engineering and Structural Dynamics, Vol. 54, No. 2, pp. 583–603, 2024, https://doi.org/10.1002/eqe.4270
-
S. Hong, X. Wang, Z. Mei, and T. B. Wickramaratne, “Cross-lingual multimodal event extraction: a unified framework for parameter-efficient fine-tuning,” ICCK Transactions on Intelligent Systematics, Vol. 2, No. 4, pp. 203–212, Oct. 2025, https://doi.org/10.62762/tis.2025.610574
-
Z. Ma, B. Zhang, and T. Yin, “A robotic system for fine-grained non-destructive grading of visually similar fruits based on improved YOLOv11 and Multi-modal Perception,” ICCK Transactions on Intelligent Systematics, Vol. 3, No. 2, pp. 94–107, Apr. 2026, https://doi.org/10.62762/tis.2025.566749
-
S. Khan, A. Khan, and D. Ali, “Visual sensing via multiscale edge-aware learning with hybrid attention for camouflaged object detection,” ICCK Transactions on Sensing, Communication, and Control, Vol. 3, No. 2, pp. 76–89, 2026, https://doi.org/10.62762/tscc.2025.439821
-
X. Kang, S. Ma, X. Wang, A. Zhang, J. Hu, and G. Xia, “Nonlinear dynamics of low frequency compact piezoelectric energy harvesting vibration system by a cucurbit flute-inspired beam with intelligent adjustable,” Chaos, Solitons and Fractals, Vol. 208, p. 118315, 2026, https://doi.org/10.1016/j.chaos.2026.118315
-
X. Wang, X. Kang, L. Ji, A. Zhang, and G. Xia, “Low frequency vibration energy harvesting of bio-inspired multi-stable piezoelectric vibration system with an adjustable device,” Chaos, Solitons and Fractals, Vol. 192, p. 116026, 2025, https://doi.org/10.1016/j.chaos.2025.116026
-
X. Kang, X. Wang, and G. Xia, “Ultra-low frequency vibration energy harvesting of piezoelectric vibration systems with an adjustable device,” Alexandria Engineering Journal, Vol. 100, pp. 92–110, May 2024, https://doi.org/10.1016/j.aej.2024.05.035
-
F. Li and J. Lv, “Multi-objective optimization for emergency material dispatch with backup centers in earthquake-induced distribution failures using improved NSGA-II,” ICCK Transactions on Intelligent Systematics, Vol. 3, No. 2, pp. 108–125, Apr. 2026, https://doi.org/10.62762/tis.2025.202079
-
Y. Lin, “Pairwise Frank-Wolfe for maximum inscribed balls: enabling real-time geometric optimization,” ICCK Transactions on Advanced Computing and Systems, Vol. 2, No. 1, pp. 61–73, Jan. 2026, https://doi.org/10.62762/tacs.2025.318429
-
X. Kang, X. Zhu, J. Wei, X. Shi, J. Qin, and D. Wang, “Enhancing seismic resilience of structures using optimally designed base-isolated impacting vibration absorbers with resonator,” ASCE-ASME Journal of Risk and Uncertainty in Engineering Systems, Part A: Civil Engineering, Vol. 12, No. 2, p. 04026009, 2026, https://doi.org/10.1061/ajrua6.rueng-1683
-
R. W. Clough and J. Penzien, Dynamics of structures. Berkeley, CA, USA: Computers & Structures, Inc., 1995.
-
“Code for seismic design of buildings,” (in Chinese), China Architecture & Building Press, Beijing, China, GB 50011-2010, 2024.
-
M. D. Symans et al., “Energy dissipation systems for seismic applications: current practice and recent developments,” Journal of Structural Engineering, Vol. 134, No. 1, pp. 3–21, Dec. 2007, https://doi.org/10.1061/(asce)0733-9445(2008)134:1(3)
-
“Measurement method of environmental vibration of urban area,” (in Chinese), Press of China Standards, Beijing, China, GB10071-88, 1989.
-
“Standard for limit and measuring method of building vibration and secondary noise caused by urban rail transit,” (in Chinese), China Architecture and Building Press, Beijing, China, JGJ/T 170-2009, 2009.
About this article

This work was supported by the Shandong Provincial Natural Science Foundation (No. ZR2025QC560) and the Youth Innovation Team Development Program of Colleges and Universities in Shandong Province (No. 2021KJ110).
The datasets generated during and/or analyzed during the current study are available from the corresponding author on reasonable request.
Jianli Wan: methodology, formal analysis, data curation, writing-review and editing. Zi’ang Kong: conceptualization, methodology, investigation, software, validation, writing-review and editing. Yanyan Han: software, formal analysis, visualization. Xingliang Gao: investigation, resources, validation. Xiufeng Xu: conceptualization, supervision, project administration, writing-review and editing.
The authors declare that they have no conflict of interest.

