Abstract
When high-speed railway lines are located close to transmission corridors, train-induced vibration may affect the dynamic response of transmission towers. To investigate the event-level vibration response characteristics of a transmission tower adjacent to a high-speed railway under short-term field monitoring conditions, this study takes a transmission tower in Shenzhen, China, as the research object. Train passage events were constructed and analyzed using horizontal acceleration, inclination, background wind speed, and train timetable data. First, train events and single- or double-train conditions were identified according to the timetable. Then, the east-west and north-south acceleration components were used to calculate the resultant horizontal acceleration, and the peak response time within each recorded event minute was determined using a 1 s moving root-mean-square method. Finally, a 20 s event window, including 10 s before and 10 s after the peak response time, was established to extract event-level features related to acceleration, inclination, wind speed, and train type. The results show that 226 actual train events were obtained from November 6 to November 11, 2025, of which 170 non-boundary events were used as the main analysis samples. The maximum RMS response and peak acceleration of double-train events were generally higher than those of single-train events, although the differences were limited. The acceleration response in the higher wind-speed group was also generally greater than that in the lower wind-speed group. However, because the wind-speed groups were partly coupled with the monitoring dates, this result should be interpreted as a tendency rather than a causal conclusion. Furthermore, response state classification was conducted based on the event-level features. The random forest model achieved relatively good identification performance, with an F1-score of 0.788 and a ROC-AUC of 0.854. Feature importance analysis indicated that maximum inclination variation, mean wind speed, and peak offset time made relatively large contributions to response state identification. The results provide a reference for short-term monitoring data analysis and event-level response assessment of transmission towers adjacent to high-speed railways.
Highlights
- Field monitoring reveals the transient vibration characteristics of a transmission tower adjacent to a high-speed railway.
- Consecutive train passages increase peak acceleration and prolong the duration of structural vibration.
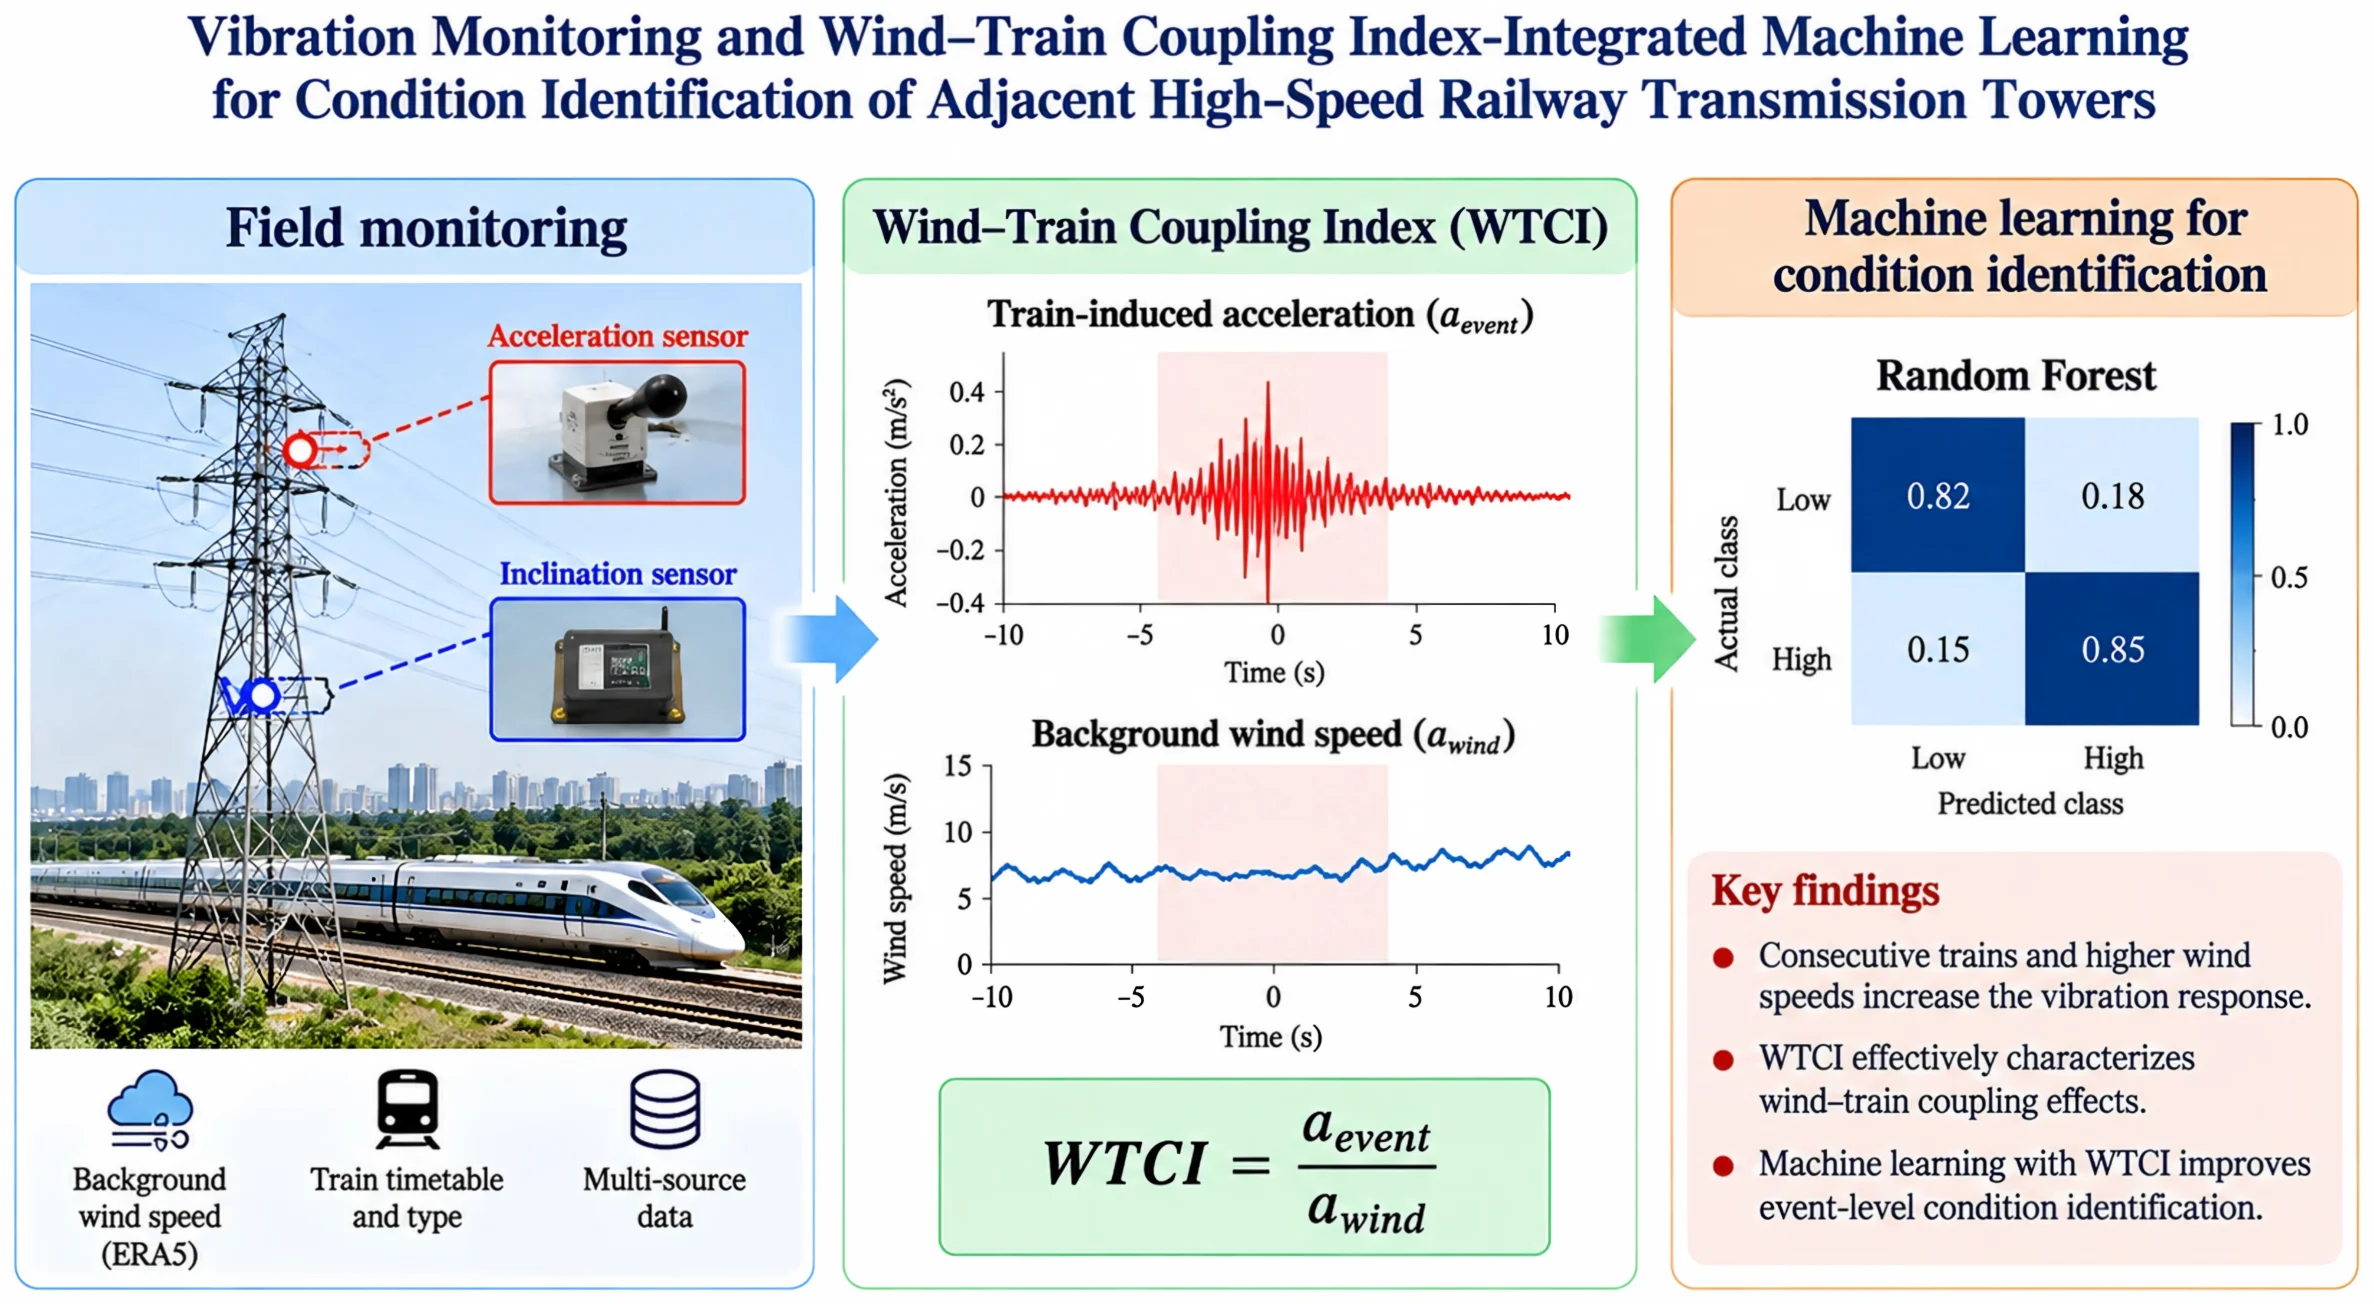
- Wind–Train Coupling Indices (WTCIs) are developed to characterize acceleration and inclination responses under varying wind conditions.
- Integrating WTCIs into machine learning models improves event-level vibration state classification.
1. Introduction
With the continued expansion of high-speed railway and transmission network construction, the proximity between railway lines and transmission corridors has become increasingly common. For transmission towers adjacent to high-speed railways, structural responses may be affected not only by the ambient wind environment but also by ground vibration and aerodynamic disturbance induced by train passage. Transmission towers are tall and flexible structures that are sensitive to wind loads, foundation vibration, and external dynamic excitation. When short-term train-induced actions are superimposed on the ambient wind environment, the tower response may exhibit transient characteristics and condition-dependent variability. Therefore, analyzing the vibration response of transmission towers near high-speed railways under train passage and background wind conditions is important for field monitoring and operational response assessment.
Ground vibration induced by train operation and its propagation characteristics have received considerable attention. Auersch [1] analyzed the formation mechanism of railway-induced ground vibration from the perspective of vehicle-track-soil interaction. Kouroussis et al. [2] reviewed the effects of vehicle-related factors on railway-induced ground vibration. Connolly et al. [3] systematically summarized railway vibration issues in terms of track, vehicle, foundation, and adjacent building responses. Nielsen et al. [4] pointed out that vehicle design and wheel-rail conditions significantly affect train-induced ground vibration levels. Regarding adjacent structural responses, Luo et al. [5] analyzed the propagation and distribution characteristics of train-induced vibration in track-structure systems, showing that train speed and structural transmission paths influence vibration responses. These studies indicate that train-induced vibration has distinct propagation features and condition dependency, which should be considered in the dynamic response analysis of adjacent tall and flexible structures.
The influence of train operation on transmission towers and tower-line systems has also been investigated. Zhao et al. [6] established a high-speed train-foundation-tower-line system model and analyzed the effects of high-speed-train-induced ground vibration on the dynamic responses of transmission tower-line systems, showing that train speed, soil conditions, and distance from the track affect tower responses. Huang et al. [7] conducted vibration analysis and online monitoring of transmission towers adjacent to railways and found that train passage causes short-term changes in tower dynamic responses and modal parameters. These studies provide a basis for dynamic response analysis of transmission towers near high-speed railways. However, most existing studies focus on train excitation itself, and the event-level response characteristics under background wind conditions remain insufficiently clarified.
Wind loads are a key environmental factor affecting the dynamic response of transmission tower-line systems. Abd-Elaal et al. [8] reviewed the response characteristics of transmission line systems under strong winds such as downbursts, indicating that tower-line systems are highly wind-sensitive. Fang et al. [9] studied wind-induced responses of transmission tower-line systems under downburst wind fields and showed that wind field parameters and tower-line coupling significantly affect structural dynamic responses. Fu and Li [10] analyzed the dynamic responses of transmission tower-line systems under combined wind and rain loads, demonstrating that multiple environmental factors can jointly alter structural response levels. Jiang et al. [11] further pointed out that joint connections and modeling accuracy affect the dynamic response analysis of transmission towers. Overall, existing studies have extensively discussed wind-induced responses, tower-line coupling, and structural modeling of transmission towers, but less attention has been paid to short-term train events occurring under different background wind conditions.
With the development of structural health monitoring (SHM), data-driven state identification methods have been increasingly applied to engineering structures. Sohn et al. [12] placed SHM within a statistical pattern recognition framework and emphasized state identification and anomaly detection based on response features. Farrar and Worden [13] systematically described the fundamental concepts and application framework of SHM. In recent years, machine learning methods have been widely used in SHM and damage identification. Malekloo et al. [14] summarized the progress of machine learning applications in SHM and noted that data-driven models can process multi-source monitoring data, while their interpretability depends on the physical meaning of the input features. Kouchaki et al. [15] applied machine learning methods to damage identification of transmission towers and showed that vibration features can provide useful information for state identification. For transmission towers adjacent to high-speed railways, however, the applicability of event-level features for identifying relative response states under limited field monitoring samples still requires further examination.
This study employs ERA5 reanalysis wind speed data to characterize the ambient wind environment in the study area. ERA5 is a global reanalysis dataset released by ECMWF, capable of providing continuous and unified regional meteorological background information [16]. It should be noted that ERA5 wind speeds reflect regional-scale ambient wind conditions and do not represent the local instantaneous wind speeds at the tower site during train passage. Therefore, this paper uses ERA5 wind speeds as background environmental variables in event-level response analysis, rather than directly equating them to instantaneous wind load inputs.
In summary, existing research still has the following limitations: first, the event-level response characteristics of transmission towers adjacent to high-speed railways under the combined influence of train passage and the ambient wind environment remain insufficiently understood; second, the response differences associated with train number and wind-speed conditions have not been fully described using field monitoring data; third, the applicability of event-level features for response state identification remains to be further examined under limited field monitoring samples. To address these issues, this study identifies train passage events by combining the train timetable with measured acceleration responses, extracts event-level features from acceleration, inclination, wind speed, and train operation records, and analyzes the vibration response characteristics of the transmission tower under different train and wind-speed conditions. In addition, several machine learning models are used to explore the identifiability of relative response states based on event-level features. The findings provide a reference for short-term monitoring data analysis and event-level response assessment of transmission towers adjacent to high-speed railways.
2. Multi-source monitoring data and preprocessing
2.1. Engineering overview
This study focuses on a transmission tower adjacent to a high-speed railway. The monitored tower is located near the railway line and may be affected by both train-induced vibration and the background wind environment during operation. Train-induced excitation is characterized by short-term transient effects, whereas wind loading usually shows continuous and low-frequency characteristics. Therefore, tower response, wind speed, and train operation records were combined for event-level analysis.
Table 1Types and uses of multi-source monitoring data
Data type | Sampling frequency / resolution | Main purpose |
Acceleration | 50 Hz | Extract train-induced vibration responses |
Inclination | 1 Hz | Extract low-frequency deformation responses of the tower |
Wind speed | 1 h or event matching after interpolation | Characterize the background wind environment |
Train timetable | Minute-level | Determine train events and single-/double-train types |
The field monitoring data include horizontal acceleration, inclination, background wind speed, and the train timetable. The acceleration data were sampled at 50 Hz and used to characterize the dynamic response of the tower during train passage. The inclination data were sampled at 1 Hz and used to describe the low-frequency deformation of the tower. Wind speed was used to represent the background wind environment during each event, while the train timetable was used to determine train events and distinguish between single and double-train conditions. Continuous monitoring data from November 6 to November 11, 2025, were selected for analysis. During this period, the train operation records were relatively complete and included single-train events, double-train events, and different wind-speed conditions. It should be noted that the monitoring period lasted only six days; therefore, the results mainly reflect the vibration response characteristics during this short-term observation period.
Fig. 1Monitoring system layout of the investigated transmission tower. Photos by the authors at the investigated transmission tower in Longgang District, Shenzhen, China, during the installation of the monitoring system in November 2025
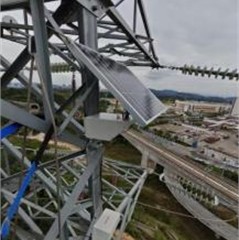
a) Accelerometer installation
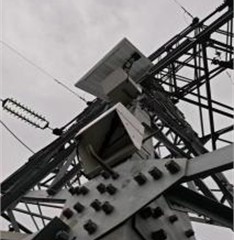
b) Inclinometer installation
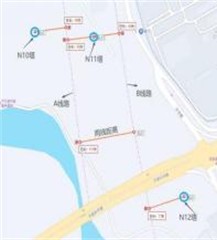
c) Location of transmission tower and railway line
2.2. Train event matching method
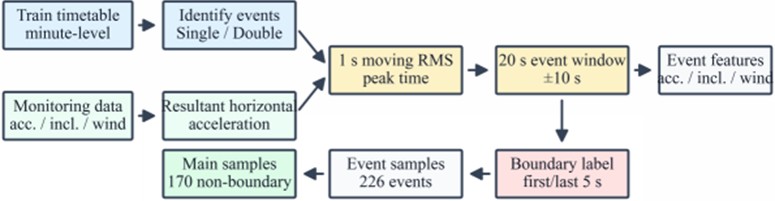
To avoid possible misidentification caused by relying solely on a global threshold, this study constructed event samples by combining the train timetable with the measured structural response. First, the scheduled train passage time was determined according to the field train timetable, and the events were classified as single-train or double-train events based on the operation records. Then, within each recorded train event minute, the east-west and north-south acceleration components were used to calculate the resultant horizontal acceleration. A 1 s moving root-mean-square value was further calculated to determine the peak vibration response time corresponding to each event.
The resultant horizontal acceleration is defined as:
where is the resultant horizontal acceleration amplitude of the transmission tower at time , and and are the instantaneous acceleration components measured by the accelerometer in the east-west (EW) and north-south (NS) directions, respectively, with units of m/s2.
The moving root-mean-square value is defined as:
where is the length of the moving window, which was set to 1 s in this study. The moving RMS value was not used as a train-event identification criterion based on a global threshold. Instead, it was used to determine the peak response position within the corresponding timetable event minute. After the peak response time was determined, a 20 s event window was constructed using 10 s before and 10 s after the peak time, and event-level response features were extracted within this window.
Fig. 2Flowchart of train event construction and feature extraction
2.3. Event feature extraction
Within each event window, features related to acceleration, inclination, wind speed, and train type were extracted. The acceleration features included the mean RMS response, the maximum moving RMS response, and the peak resultant acceleration within the event window, denoted as Acc_RMS, Acc_RMS_Max, and Acc_Max, respectively. The inclination feature was represented by the maximum inclination variation, denoted as Angle_Max. The wind feature was represented by the event mean wind speed, denoted as WindSpeed_mean. Train type was represented by TrainCount, where single-train events were assigned a value of 1 and double-train events were assigned a value of 2.
Because the wind speed changed only slightly within each event window, WindSpeed_mean was mainly used in the subsequent analysis to represent the background wind environment, while WindSpeed_max was retained only as an auxiliary record. These features formed the data basis for the subsequent analysis of the train-induced response of the transmission tower.
2.4. Sample composition and quality control
Based on the above method, a total of 226 train-induced events were extracted from November 6 to November 11, 2025. Among them, 191 were single-train events and 35 were double-train events. Since the valid monitoring records on November 11, 2025 ended at 10:47, only 26 events were extracted on that day, while 40 events were extracted for each of the other complete monitoring days.
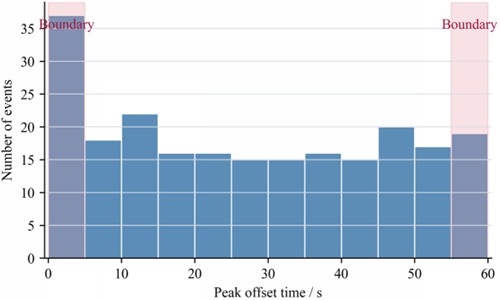
Considering that the maximum response of some events occurred near the beginning or end of the recorded minute, these events may have been affected by adjacent trains, record boundaries, or the minute-level accuracy of the timetable. Therefore, a boundary event label was introduced. When the maximum response of a train event occurred within the first 5 s or the last 5 s of the recorded minute, the event was labeled as a boundary event. The results showed that 56 of the 226 events were boundary events, and the remaining 170 non-boundary events were used as the main samples for subsequent analysis.
For wind-speed grouping, the samples were divided into W1 and W2 groups according to the mean wind speed of each event. W1 represents the lower wind-speed group, while W2 represents the higher wind-speed group. Among all events, 80 belonged to W1 and 146 belonged to W2. Among the main analysis samples, 60 belonged to W1 and 110 belonged to W2. It should be noted that the wind-speed groups were partly coupled with the monitoring dates in this short-term dataset. Therefore, the subsequent analysis of wind-speed effects was used mainly to describe the response differences between wind-speed groups, rather than to establish a causal conclusion for wind effects alone.
In summary, this study adopted an event construction method in which train events were determined from the timetable and the peak response time was determined from measured acceleration data. This method clarified both the source of train events and the feature extraction procedure, thereby providing a consistent data basis for the subsequent analysis of train-induced vibration responses under short-term field monitoring conditions.
Table 2Statistics of train event samples
Sample category | Number |
All train events | 226 |
Single-train events | 191 |
Double-train events | 35 |
Boundary events | 56 |
Main analysis events | 170 |
W1 group events | 80 |
W2 group events | 146 |
3. Vibration response characteristics of the transmission tower under train-induced excitation
3.1. Overall characteristics of train events
Based on the event construction method described in Section 2, a total of 226 train-induced events were obtained from November 6 to November 11, 2025. Among them, 191 were single-train events and 35 were double-train events. Considering that the maximum response of some events occurred near the boundary of the recorded minute, events with peak responses located within the first 5 s or the last 5 s of the recorded minute were labeled as boundary events. The statistical results showed that 56 events were boundary events, and the remaining 170 non-boundary events were used as the main samples in this chapter.
In terms of event distribution, 40 events were extracted each day from November 6 to November 10, 2025. Since the valid monitoring records on November 11 ended at 10:47, 26 events were extracted on that day. Boundary events accounted for 24.8 % of all events, indicating that some train-induced responses may have been affected by the minute-level accuracy of the timetable, adjacent trains, or record-window truncation. Therefore, the subsequent response statistics were mainly conducted based on the 170 non-boundary events.
Table 3Statistics of train event counts
Date | All events | Main analysis events | Boundary events | Single-train events | Double-train events |
2025-11-06 | 40 | 32 | 8 | 34 | 6 |
2025-11-07 | 40 | 28 | 12 | 34 | 6 |
2025-11-08 | 40 | 28 | 12 | 34 | 6 |
2025-11-09 | 40 | 32 | 8 | 34 | 6 |
2025-11-10 | 40 | 33 | 7 | 34 | 6 |
2025-11-11 | 26 | 17 | 9 | 21 | 5 |
Total | 226 | 170 | 56 | 191 | 35 |
Fig. 3Distribution of Peak_Offset_s
3.2. Comparison between single-train and double-train events
To analyze the influence of train number on the vibration response of the transmission tower, the single-train and double-train events among the 170 main analysis samples were compared statistically. The results showed that the acceleration responses of double-train events were generally higher than those of single-train events.
As shown in Table 4, the mean and median Acc_RMS_Max values of single-train events were 0.389 m/s2 and 0.345 m/s2, respectively, while those of double-train events were 0.414 m/s2 and 0.402 m/s2, respectively. the mean Acc_RMS_Max of double-train events was approximately 6.4 % higher than that of single-train events. Meanwhile, the mean Acc_Max of double-train events was 0.785 m/s2, which was also slightly higher than the corresponding value for single-train events, 0.762 m/s2.
Table 4Response statistics under different train types
Train type | Number of events | Mean Acc_RMS_Max / m/s2 | Median Acc_RMS_Max / m/s2 | Mean Acc_Max / m/s2 | Median Acc_Max / m/s2 | Mean Angle_Max |
Single-train | 145 | 0.389 | 0.345 | 0.762 | 0.634 | 0.046 |
Double-train | 25 | 0.414 | 0.402 | 0.785 | 0.861 | 0.044 |
Fig. 4Boxplot of Acc_RMS_Max under different train types
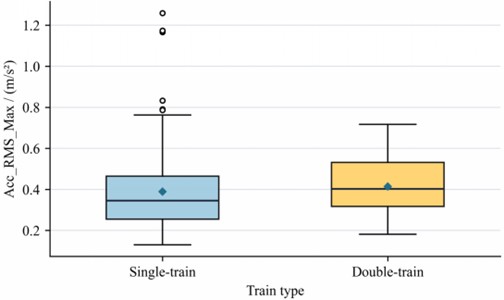
Fig. 5Boxplot of Acc_Max under different train types
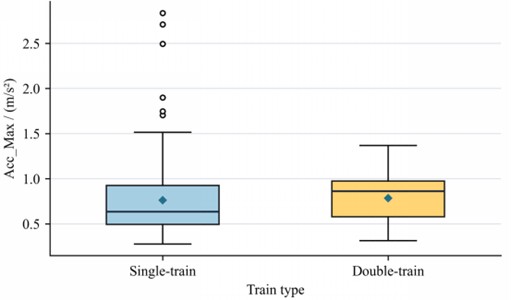
Overall, the acceleration response of the transmission tower under double-train events was slightly higher than that under single-train events, but the difference was limited. Considering the relatively small number of double-train samples and the influence of wind speed and date-related differences on the field response, this result is interpreted as a tendency rather than a statistically significant conclusion.
3.3. Response differences under different wind-speed groups
To analyze the influence of the background wind environment on train-induced responses, the samples were divided into W1 and W2 groups according to the mean wind speed of each event. W1 corresponds to the lower wind-speed group, while W2 corresponds to the higher wind-speed group. Among the 170 main analysis samples, 60 events belonged to W1 and 110 belonged to W2.
As shown in Table 5, the mean Acc_RMS_Max of the W1 group was 0.362 m/s2, while that of the W2 group was 0.409 m/s2. The mean Acc_RMS_Max of the W2 group was approximately 13.1 % higher than that of the W1 group. Acc_Max showed a similar trend, with mean values of 0.695 m/s2 for W1 and 0.804 m/s2 for W2. These results indicate that the train-induced response of the transmission tower was generally stronger in the higher wind-speed group.
Table 5Response statistics under different wind-speed groups
Wind-speed group | Number of events | Mean wind speed / m/s | Mean Acc_RMS_Max / m/s2 | Median Acc_RMS_Max / m/s2 | Mean Acc_Max / m/s2 | Mean Angle_Max |
W1 | 60 | 1.329 | 0.362 | 0.333 | 0.695 | 0.045 |
W2 | 110 | 4.403 | 0.409 | 0.363 | 0.804 | 0.046 |
Fig. 6Boxplot of Acc_RMS_Max under different wind-speed groups
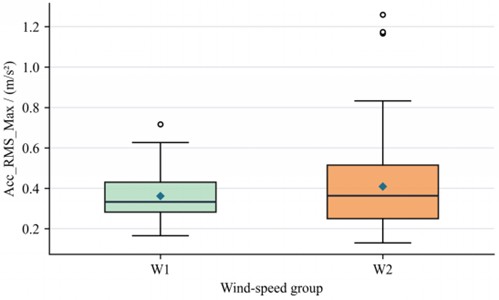
Fig. 7Comparison of daily mean response and mean wind speed
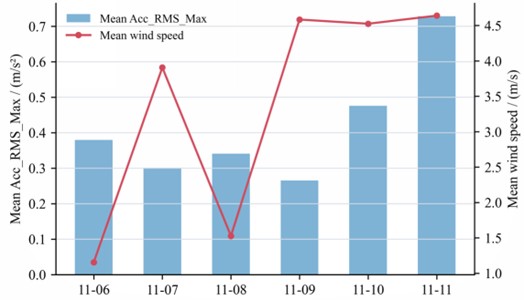
It should be noted that the wind-speed groups in this monitoring dataset were partly coupled with the monitoring dates. W1 events were mainly obtained on November 6 and November 8, 2025, while W2 events were mainly obtained on November 7 and from November 9 to November 11, 2025. Therefore, the above results only indicate a tendency toward stronger responses under the higher wind-speed group and should not be interpreted as a causal conclusion for wind effects alone.
From the daily results, the mean Acc_RMS_Max of the main analysis samples was highest on November 11, 2025, reaching 0.728 m/s2, and lowest on November 9, 2025, with a value of 0.265 m/s2. The obvious differences among monitoring dates indicate that the short-term measured responses were jointly affected by the operating environment and background vibration conditions.
Overall, the statistical results based on the 170 non-boundary events show that the acceleration responses of double-train events were generally slightly higher than those of single-train events, and that the responses in the W2 wind-speed group were generally higher than those in the W1 group. However, due to the short monitoring period and the partial coupling between wind-speed groups and monitoring dates, these results mainly reflect response differences during the short-term observation period and should not be directly regarded as long-term statistical patterns or causal conclusions based on a single factor.
4. Vibration response state identification based on event-level features
4.1. Response state definition and feature selection
To further analyze the identifiability of the vibration response states of the transmission tower under train-induced excitation, event-level classification analysis was conducted based on the 170 non-boundary events obtained in Section 3. Because no obvious structural damage occurred during the monitoring period, the response states defined in this study represent only relative differences in vibration intensity within the samples, rather than structural damage levels or safety states.
In this study, the maximum moving RMS response of each event, Acc_RMS_Max, was used as the basis for response state classification. According to the median Acc_RMS_Max value of the 170 main analysis samples, the events were divided into normal-response and higher-response states. Events with Acc_RMS_Max values higher than the median were defined as higher-response states, while the remaining events were defined as normal-response states. After classification, each class contained 85 samples, resulting in a balanced dataset.
To reduce the risk of feature leakage, Acc_RMS_Max was not used as an input feature. Considering that Acc_Max and Acc_RMS_Max both directly reflect acceleration response intensity and are strongly correlated, Acc_Max was also excluded from the input features. Finally, train number (TrainCount), event mean wind speed (WindSpeed_mean), maximum inclination variation (Angle_Max), and peak offset time (Peak_Offset_s) were selected as input features.
Table 6Sample division of response states
Response State | Number of Samples | Mean Acc_RMS_Max | Median Acc_RMS_Max | Mean Acc_Max | Mean Angle_Max | Mean wind speed | Number of double-train events |
Normal response | 85 | 0.259 | 0.257 | 0.494 | 0.032 | 3.085 | 9 |
Higher response | 85 | 0.526 | 0.483 | 1.038 | 0.06 | 3.551 | 16 |
4.2. Model development and evaluation method
To compare the ability of different algorithms to identify event response states, nine classification models were selected: logistic regression, support vector machine, K-nearest neighbors, naive Bayes, decision tree, random forest, extremely randomized trees, AdaBoost, and gradient boosting. Logistic regression and naive Bayes were used as relatively simple baseline models; support vector machine and K-nearest neighbors were used to reflect the effects of sample-space distance and decision-boundary division; and decision tree, random forest, extremely randomized trees, AdaBoost, and gradient boosting were used to analyze the influence of nonlinear feature combinations on response state identification.
Considering the limited sample size, five-fold cross-validation was used to evaluate model performance. The evaluation metrics included accuracy, precision, recall, F1-score, and ROC-AUC. The F1-score comprehensively considers precision and recall, while ROC-AUC evaluates the overall discriminative ability of the models for the two response states.
4.3. Multi-model identification result analysis
Table 7 presents the cross-validation results of the different models. Overall, the F1-scores mainly ranged from 0.718 to 0.788, indicating that the selected event-level features had a certain ability to distinguish between normal-response and higher-response states. Among the models, random forest performed best, with an accuracy of 0.806, an F1-score of 0.788, and a ROC-AUC of 0.854. The extremely randomized trees model ranked second, with an F1-score of 0.780.
Table 7Identification results of response states using different models
Model | Accuracy | Precision | Recall | F1-score | ROC-AUC |
Logistic regression | 0.759 | 0.772 | 0.729 | 0.748 | 0.838 |
Support vector machine | 0.729 | 0.754 | 0.694 | 0.718 | 0.830 |
K-nearest neighbors | 0.741 | 0.766 | 0.694 | 0.722 | 0.825 |
Naive Bayes | 0.776 | 0.809 | 0.706 | 0.751 | 0.817 |
Decision tree | 0.753 | 0.814 | 0.659 | 0.725 | 0.792 |
Random forest | 0.806 | 0.873 | 0.729 | 0.788 | 0.854 |
Extremely randomized trees | 0.794 | 0.839 | 0.74 | 0.780 | 0.848 |
AdaBoost | 0.771 | 0.807 | 0.718 | 0.758 | 0.850 |
Gradient boosting | 0.782 | 0.837 | 0.718 | 0.768 | 0.834 |
Fig. 8Identification results of response states using different models
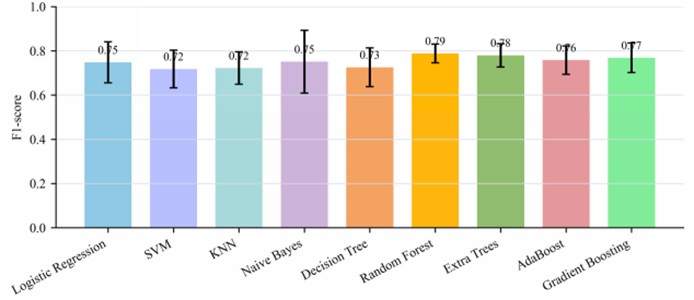
In terms of model type, nonlinear ensemble models such as random forest, extremely randomized trees, and gradient boosting generally outperformed logistic regression, support vector machine, and K-nearest neighbors. This indicates that the event response state of the transmission tower was not simply linearly related to inclination, wind speed, peak position, and train number. The naive Bayes model also achieved results close to those of the ensemble models, suggesting that different response states showed a certain degree of separability in some features. However, the performance differences among the models were not large, indicating that the identification ability of the models was still limited by the sample size and the number of features under short-term monitoring conditions.
Taking the random forest model as an example, the cross-validation confusion matrix showed that the model had a certain ability to identify both normal-response and higher-response states, although some misclassifications still existed. This suggests that the current model could capture the main differences in event response intensity, but it should not be regarded as a stable or generalizable engineering decision model.
Table 8Confusion matrix of the random forest model
Actual / Predicted | Normal response | Higher response |
Normal Response | 75 | 10 |
Higher Response | 23 | 62 |
4.4. Feature importance analysis
To further analyze the contribution of each input feature to response state identification, the feature importance values of the random forest model were extracted. The results showed that Angle_Max had the highest importance, with a value of 0.538. The importance values of WindSpeed_mean and Peak_Offset_s were 0.220 and 0.211, respectively, while the importance of TrainCount was 0.031.
Table 9Feature importance of the random forest model
Feature | Importance |
Angle_Max | 0.538 |
WindSpeed_mean | 0.220 |
Peak_Offset_s | 0.211 |
TrainCount | 0.031 |
Fig. 9Feature importance of the random forest model
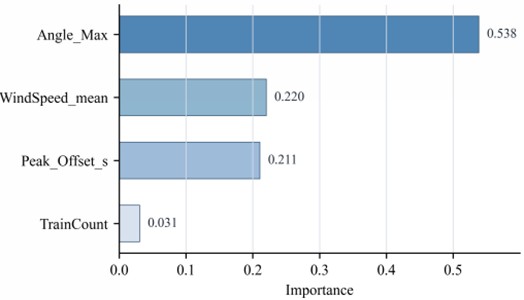
The results indicate that, in the short-term monitoring samples used in this study, maximum inclination variation made the largest contribution to response state classification. This suggests that the low-frequency deformation characteristics of the transmission tower were related to event response intensity to some extent. WindSpeed_mean also showed relatively high importance, indicating that the background wind environment may affect the structural response level during train passage. Peak_Offset_s also contributed to the classification, suggesting that the peak response position within the recorded minute was associated with the event response state. in contrast, TrainCount had relatively low importance, indicating that train number alone could not fully explain the differences in response states in the current dataset.
It should be noted that the low importance of TrainCount does not mean that train number had no influence on the response. The statistical results in Section 3 showed that the acceleration response of double-train events was generally slightly higher than that of single-train events. However, in the multi-feature model, the contribution of train number may have been jointly explained by inclination, wind speed, and peak position features. in addition, the limited number of double-train samples may also weaken the stability of the importance estimation for this feature.
Fig. 10ROC curves of main models
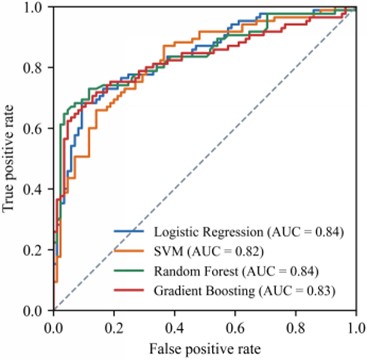
In summary, the multi-model identification results based on the 170 non-boundary events indicate that event-level features can distinguish between normal-response and higher-response states to a certain extent. Among the tested models, random forest achieved relatively good identification performance, suggesting that nonlinear ensemble models are more suitable for handling multi-factor response differences in the short-term field monitoring samples used in this study. However, due to the limited monitoring duration, sample size, and date-related coupling, the model results should be regarded mainly as an exploratory analysis under short-term field monitoring conditions and should not be used as evidence for long-term generalized inference or structural safety assessment.
5. Conclusions
Based on short-term field monitoring data collected from November 6 to November 11, 2025, this study analyzed the event-level vibration response characteristics of a transmission tower adjacent to a high-speed railway by combining horizontal acceleration, inclination, background wind speed, and train timetable data. the main conclusions are as follows:
1) A train event construction method combining the train timetable and measured structural response was adopted. This method can avoid the problems of excessive candidate events and unclear event sources caused by relying solely on global-threshold identification. A total of 226 actual train events were extracted, including 191 single-train events and 35 double-train events. Considering the influence of peak responses occurring near the boundary of the recorded minute, 170 non-boundary events were selected as the main analysis samples.
2) The comparison between single-train and double-train events showed that the acceleration response of the transmission tower under double-train events was generally slightly higher than that under single-train events. in the main analysis samples, the mean Acc_RMS_Max of double-train events was approximately 6.4 % higher than that of single-train events, and the mean Acc_Max was also slightly higher. Due to the limited number of double-train samples and the combined influence of multiple field factors, this result should be interpreted as a tendency rather than a definitive difference.
3) The comparison between different wind-speed groups showed that the acceleration response of the transmission tower was generally stronger under the higher wind-speed group. the mean Acc_RMS_Max of the W2 group was approximately 13.1 % higher than that of the W1 group, and the mean Acc_Max of the W2 group was also higher. However, the wind-speed groups in this short-term dataset were partly coupled with the monitoring dates; therefore, this result should not be interpreted as a causal conclusion for wind effects alone.
4) The response state classification results based on the 170 non-boundary events showed that event-level features could distinguish normal-response and higher-response states to a certain extent. Among the tested classification algorithms, the random forest model achieved relatively good performance, with an F1-score of 0.788 and a ROC-AUC of 0.854. Feature importance results indicated that Angle_Max, WindSpeed_mean, and Peak_Offset_s contributed more to response state identification, whereas the individual contribution of TrainCount was relatively low.
5) This study was based on six days of short-term field monitoring data. The conclusions mainly reflect the response characteristics of the transmission tower under the combined effects of train passage and the background wind environment during the observation period. They should not be directly generalized as long-term statistical patterns or used as a basis for structural safety assessment. Future studies should incorporate longer-term monitoring data and more train operation conditions to further verify the stability of the conclusions.
References
-
L. Auersch, “The excitation of ground vibration by rail traffic: theory of vehicle-track-soil interaction and measurements on high-speed lines,” Journal of Sound and Vibration, Vol. 284, No. 1-2, pp. 103–132, 2005, https://doi.org/10.1016/j.jsv.2004.06.017
-
G. Kouroussis, D. P. Connolly, and O. Verlinden, “Railway-induced ground vibrations: a review of vehicle effects,” International Journal of Rail Transportation, Vol. 2, No. 2, pp. 69–110, 2014, https://doi.org/10.1080/23248378.2014.897791
-
D. P. Connolly, G. Kouroussis, O. Laghrouche, C. L. Ho, and M. C. Forde, “Benchmarking railway vibrations: track, vehicle, ground and building effects,” Construction and Building Materials, Vol. 92, pp. 64–81, 2014, https://doi.org/10.1016/j.conbuildmat.2014.07.042
-
J. C. O. Nielsen et al., “Reducing train-induced ground-borne vibration by vehicle design and maintenance,” International Journal of Rail Transportation, Vol. 3, No. 1, pp. 17–39, Jan. 2015, https://doi.org/10.1080/23248378.2014.994260
-
X. Luo, X. Jiang, Q. Feng, W. Hu, Q. Tu, and Y. Chen, “Analysis of train-induced vibration transmission and distribution characteristics in double-layer metro depot,” Buildings, Vol. 14, No. 6, p. 1702, Jun. 2024, https://doi.org/10.3390/buildings14061702
-
G. Zhao, M. Wang, Y. Liu, and M. Zhang, “Dynamic response of transmission tower-line systems due to ground vibration caused by high-speed trains,” Buildings, Vol. 13, No. 11, p. 2884, Nov. 2023, https://doi.org/10.3390/buildings13112884
-
X. Huang, Z. Liu, L. Zhao, P. Yuan, and Y. Zhang, “Research on vibration analysis and online monitoring technology of transmission tower near railway,” IEEE Instrumentation and Measurement Magazine, Vol. 26, No. 8, pp. 34–41, 2023, https://doi.org/10.1109/mim.2023.10292619
-
E.-S. Abd-Elaal, J. E. Mills, and X. Ma, “A review of transmission line systems under downburst wind loads,” Journal of Wind Engineering and Industrial Aerodynamics, Vol. 179, pp. 503–513, Jul. 2018, https://doi.org/10.1016/j.jweia.2018.07.004
-
Z. Fang, Z. Wang, R. Zhu, and H. Huang, “Study on wind-induced response of transmission tower-line system under downburst wind,” Buildings, Vol. 12, No. 7, p. 891, Jun. 2022, https://doi.org/10.3390/buildings12070891
-
X. Fu and H.-N. Li, “Dynamic analysis of transmission tower-line system subjected to wind and rain loads,” Journal of Wind Engineering and Industrial Aerodynamics, Vol. 157, pp. 95–103, Aug. 2016, https://doi.org/10.1016/j.jweia.2016.08.010
-
W. Q. Jiang, Z. Q. Wang, G. Mcclure, G. L. Wang, and J. D. Geng, “Accurate modeling of joint effects in lattice transmission towers,” Engineering Structures, Vol. 33, No. 5, pp. 1817–1827, Apr. 2011, https://doi.org/10.1016/j.engstruct.2011.02.022
-
H. Sohn, C. R. Farrar, N. F. Hunter, and K. Worden, “Structural health monitoring using statistical pattern recognition techniques,” Journal of Dynamic Systems, Measurement, and Control, Vol. 123, No. 4, pp. 706–711, Dec. 2001, https://doi.org/10.1115/1.1410933
-
C. R. Farrar and K. Worden, “An introduction to structural health monitoring,” Philosophical Transactions of the Royal Society A: Mathematical, Physical and Engineering Sciences, Vol. 365, No. 1851, pp. 303–315, 2007, https://doi.org/10.1098/rsta.2006.1928
-
A. Malekloo, E. Ozer, M. Alhamaydeh, and M. Girolami, “Machine learning and structural health monitoring overview with emerging technology and high-dimensional data source highlights,” Structural Health Monitoring, Vol. 21, No. 4, pp. 1906–1955, Aug. 2021, https://doi.org/10.1177/14759217211036880
-
M. Kouchaki, M. Salkhordeh, M. Mashayekhi, M. Mirtaheri, and H. Amanollah, “Damage detection in power transmission towers using machine learning algorithms,” Structures, Vol. 56, p. 104980, Aug. 2023, https://doi.org/10.1016/j.istruc.2023.104980
-
H. Hersbach et al., “The ERA5 global reanalysis,” Quarterly Journal of the Royal Meteorological Society, Vol. 146, No. 730, pp. 1999–2049, Jun. 2020, https://doi.org/10.1002/qj.3803
-
G. Lombaert and G. Degrande, “Ground-borne vibration due to static and dynamic axle loads of InterCity and high-speed trains,” Journal of Sound and Vibration, Vol. 319, No. 3-5, pp. 1036–1066, Aug. 2008, https://doi.org/10.1016/j.jsv.2008.07.003
-
G. Degrande and L. Schillemans, “Free field vibrations during the passage of a Thalys high-speed train at variable speed,” Journal of Sound and Vibration, Vol. 247, No. 1, pp. 131–144, Sep. 2002, https://doi.org/10.1006/jsvi.2001.3718
-
C. Madshus and A. M. Kaynia, “High-speed railway lines on soft ground: dynamic behaviour at critical train speed,” Journal of Sound and Vibration, Vol. 231, No. 3, pp. 689–701, Sep. 2002, https://doi.org/10.1006/jsvi.1999.2647
-
T. Okamura, T. Ohkuma, E. Hongo, and H. Okada, “Wind response analysis of a transmission tower in a mountainous area,” Journal of Wind Engineering and Industrial Aerodynamics, Vol. 91, No. 1-2, pp. 53–63, Jan. 2003, https://doi.org/10.1016/s0167-6105(02)00322-7
-
Q. Xie, Y. Cai, and S. Xue, “Wind-induced vibration of UHV transmission tower line system: wind tunnel test on aero-elastic model,” Journal of Wind Engineering and Industrial Aerodynamics, Vol. 171, pp. 219–229, Oct. 2017, https://doi.org/10.1016/j.jweia.2017.10.011
-
Y. Zou et al., “Full-scale measurements of wind structure and dynamic behaviour of a transmission tower during a typhoon,” Structure and Infrastructure Engineering, Vol. 16, No. 5, pp. 820–830, May 2020, https://doi.org/10.1080/15732479.2019.1670679
-
F. Chen et al., “Influence of conductors on the wind-induced stability of transmission tower-line systems,” Advances in Wind Engineering, Vol. 2, No. 1, p. 100029, Jan. 2025, https://doi.org/10.1016/j.awe.2024.100029
-
H. Sohn, “Effects of environmental and operational variability on structural health monitoring,” Philosophical Transactions of the Royal Society A: Mathematical, Physical and Engineering Sciences, Vol. 365, No. 1851, pp. 539–560, 2007, https://doi.org/10.1098/rsta.2006.1935
-
A.-M. Yan, G. Kerschen, P. de Boe, and J.-C. Golinval, “Structural damage diagnosis under varying environmental conditions-Part I: a linear analysis,” Mechanical Systems and Signal Processing, Vol. 19, No. 4, pp. 847–864, Feb. 2005, https://doi.org/10.1016/j.ymssp.2004.12.002
-
L. Breiman, “Random forests,” Machine Learning, Vol. 45, No. 1, pp. 5–32, Dec. 2002, https://doi.org/10.1023/a:1010933404324
-
J. H. Friedman, “Greedy function approximation: a gradient boosting machine,” the Annals of Statistics, Vol. 29, No. 5, pp. 1189–1232, 2001, https://doi.org/10.1214/aos/1013203451
-
R. Kohavi, “A study of cross-validation and bootstrap for accuracy estimation and model selection,” in Proceedings of the 14th International Joint Conference on Artificial Intelligence (IJCAI’95), pp. 1137–1143, 1995.
About this article

This research was supported by the Liaoning Provincial Department of Education Basic Research Project for Universities (Grant No. LJ232611258001), the Dalian University Research Platform Project (Grant No. 202301ZD01), the Department of Science and Technology Guidance Plan Foundation of Liaoning Province (Grant No. 2019JH8/10100091), and the Open Fund of the Research Center for Geotechnical and Structural Engineering Technology of Liaoning Province (Grant No. DLSZD2025007).
The author would like to thank the assistance provided by the Key Laboratory for Prediction and Control on Complicated Structure System of the Education Department of Liaoning Province and for the experimental work undertaken by graduate students, Fangfang Zhang and Shuai Wang. Additionally, we would like to express our gratitude to the editors and reviewers for their valuable suggestions on this manuscript.
The datasets generated during and/or analyzed during the current study are available from the corresponding author on reasonable request.
Fangfang Zhang: conceptualization, software, data curation, writing-original draft. Qiang Pei: validation, supervision, funding acquisition. Shuai Wang: methodology, formal analysis. Zhanpeng Yan: formal analysis, resources. Huiyan Yu: visualization. Hailin Kang: project administration. Bo Wang: Writing: review and editing.
The authors declare that they have no conflict of interest.

