Abstract
Single point incremental forming (SPIF) has become a versatile and economical method to manufacture sheet metal components, especially for low volume and bespoke production. However, the approach is limitwed by the limited formability of materials and the development of failure modes (cracking) strongly dependent on process parameters. In this paper, a prediction framework is proposed to detect the failures in SPIF based on artificial neural network (ANN) and Non-dominated Sorting Genetic Algorithm II (NSGA-II). The experimental data were obtained from a three-axis CNC machine, using circular galvanized steel sheets, and the effects of spindle speed, feed rate and tool path movement on the thickness distribution and crack formation were investigated. The prediction task is defined as a binary classification problem (crack vs. non-crack). To enhance the performance of the model, a multi-objective optimization method is applied in which the accuracy, precision, recall, mean squared error (MSE) and feature selection are assessed simultaneously. In this multi-objective framework, the NSGA-II approach is used to determine the optimal configuration of the ANN. The results from different simulation scenarios demonstrate that the proposed NSGA-II-ANN model can achieve a desirable trade-off between the predictive accuracy and the generalization ability. This model has great potential for early prediction of thickness related failures, allowing selection of parameters prior to physical investigation. This approach provides a practical decision support tool to improve the process reliability in industrial SPIF applications.
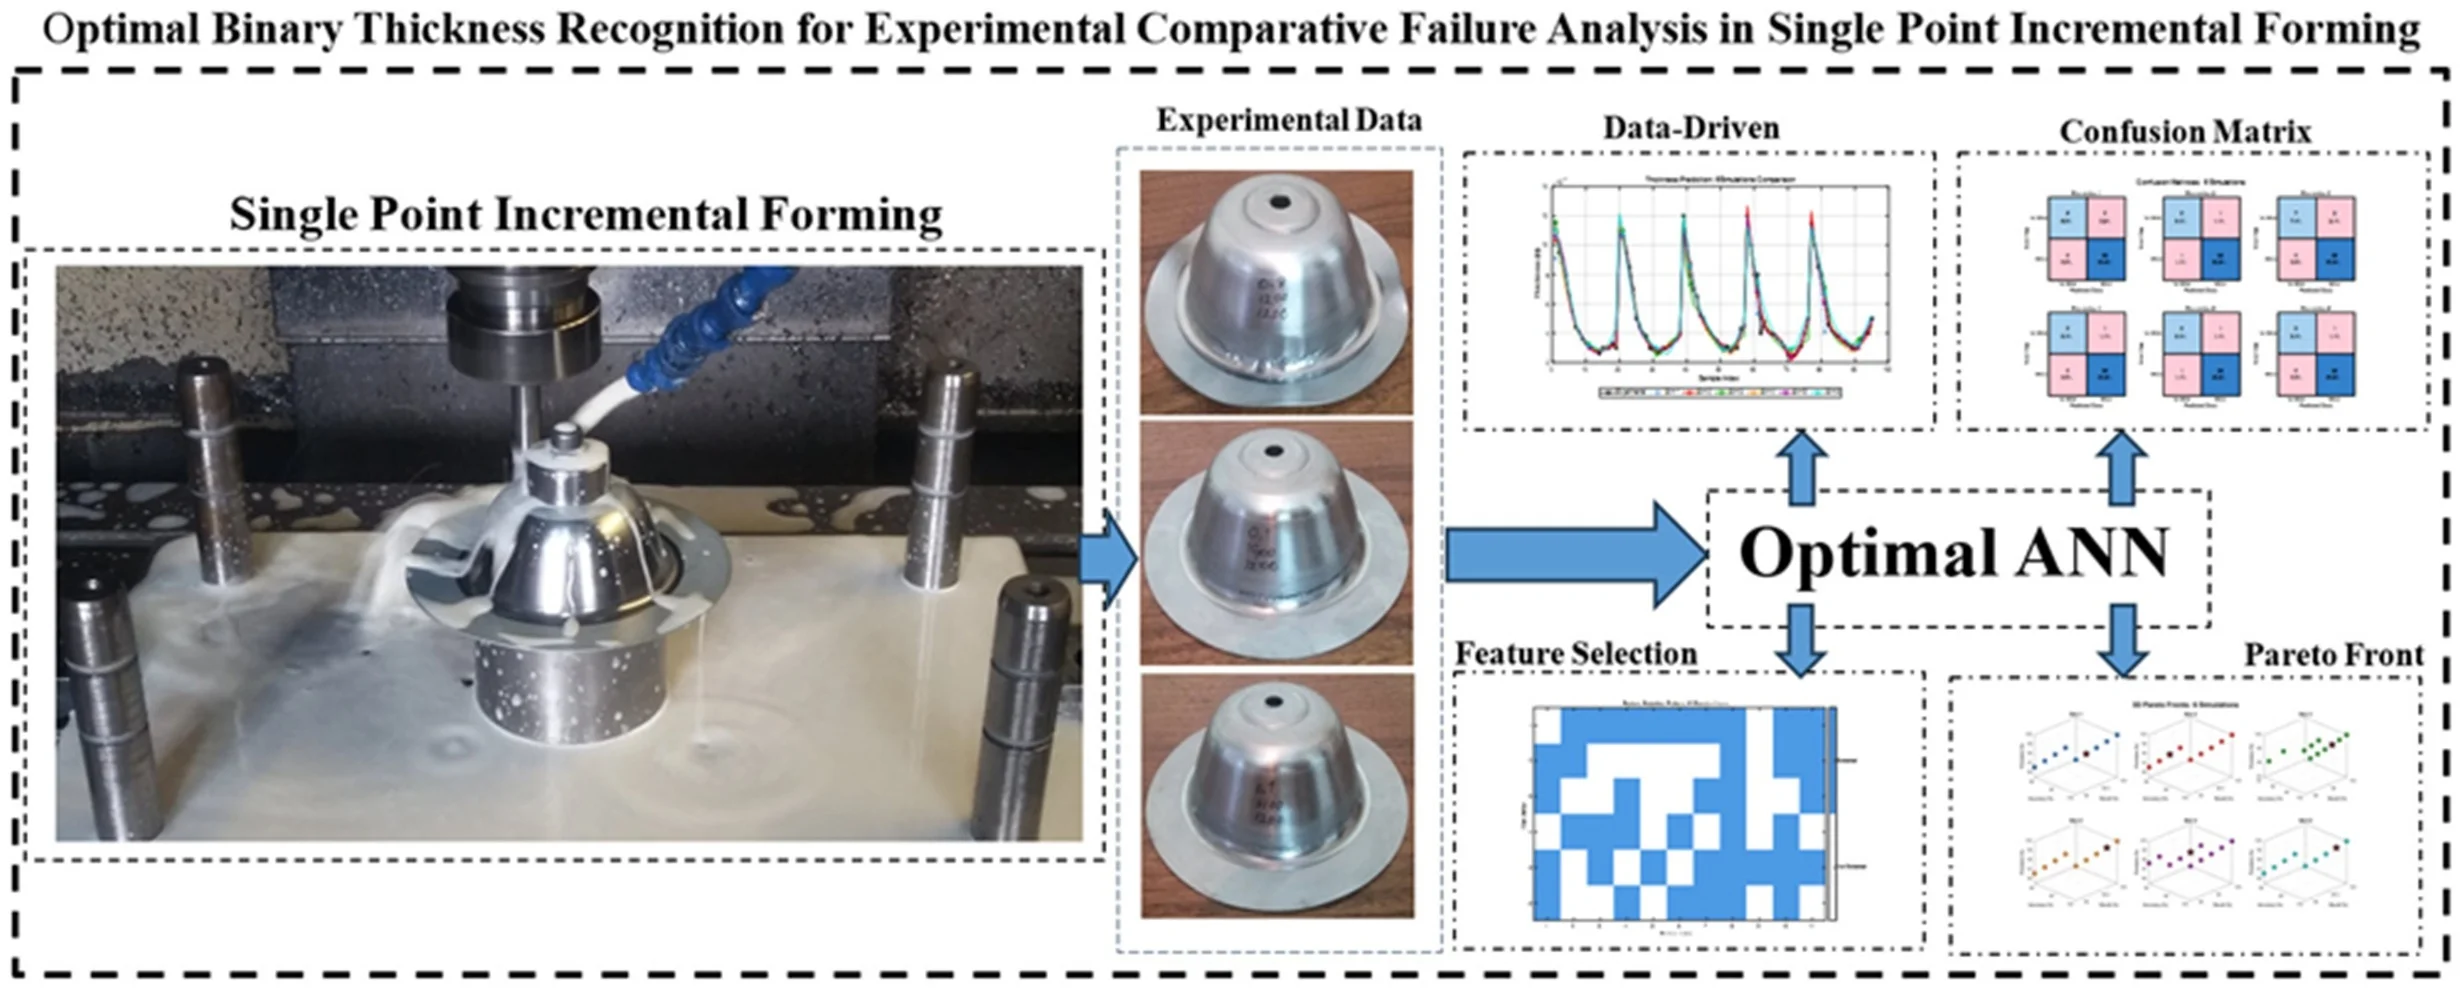
Highlights
- Experimental investigation of single-point incremental forming using a CNC machine.
- Classification crack and non-crack zones using optimal confusion matrix.
- Multi-objective optimization of artificial neural networks for sheet thickness detection.
1. Introduction
Incremental sheet forming (ISF) is a versatile manufacturing technology, which provides high flexibility and efficiency to manufacture complex geometries from sheet metal. In contrast to traditional forming processes that require expensive dies specific to each part, ISF employs a simple hemispherical tool guided by a computer numerical control (CNC) path to cause localized plastic deformation. This process is particularly cost-effective for low-volume production and rapid prototyping in high-precision sectors, such as aerospace, automotive, and biomedical engineering [1, 2]. The ISF also offers the advantage of enabling sustainable manufacturing by minimizing material waste and energy consumption when compared to conventional stamping or subtractive processes [3, 4]. Recently, the improvement of the formability and the geometric accuracy of single-point incremental forming (SPIF) has been the subject of research. Different approaches have been proposed, including parameterized multi-step forming to avoid overthinning components with high wall angles [1] and the use of magnetic field assistance to control the forming forces [5]. The material-specific characteristics of different alloys, such as stainless steel, aluminum (AA5754, AA6061), and commercially pure titanium, have been investigated in terms of their mechanical behavior, residual stress distribution, and surface integrity [6-9]. Innovations such as toolpaths based on fractal geometry and circumferential hammering tools have further demonstrated potential for improving dimensional accuracy and stress management [10, 11]. Furthermore, multi-path strategies and multi-sheet forming (MS-SPIF) have also been developed to allow for more complex geometries to be produced without sacrificing structural integrity [12, 13]. Despite these advances, reliable prediction of material failure (fracture) remains an important challenge. Analytical models and forming limit diagrams (FLDs) provide theoretical insight into deformation mechanics [14, 15]. However, the stochastic nature of experimental parameters such as spindle speed, feed rate, and stepdown makes it challenging to analyze failure in real time. Therefore, data-driven and machine learning (ML) methods have been a powerful tool to predict process outcomes such as the “pillow effect” and geometric deviations [16, 17]. A number of recent research works have shown the increasing usefulness of artificial intelligence (AI) and machine learning (ML) techniques in solving complex engineering prediction problems. A hybrid ANN-based framework for prediction of the axial load capacity of elliptical concrete-filled steel tubular (ECFST) columns was proposed by Asteris et al. [18]. The study investigated over 1.5 million neural network architectures and successfully predicted them by SHAP analysis. Hence, it provides a practical graphic user interface (GUI) for engineering applications. Also, Asteris et al. [19] developed AI based models for the prediction of axial compression capacity of concrete-filled steel tube (CFST) columns. The authors developed optimized ANN models with experimental data and calibrated finite element simulations and the firefly algorithm provided the best performance. The GUI generated in this way is a user-friendly tool for structural design and assessment. Bendriss et al. [20] studied progressive ML techniques for the prediction of the seismic bearing capacity of shallow strip footings considering P-wave and S-wave effects in geotechnical engineering. CatBoost was found to have higher prediction accuracy as compared to some models and was significantly better than the traditional analytical approaches, indicating the potential of ML in seismic foundation design. The deflection of reinforced concrete beams was predicted by Bai et al. [21] using hybrid soft-computing models. The results of the two showed that ensemble models, especially the SVM-ANFIS combination, significantly improved the prediction accuracy compared to the individual learning algorithms. The study emphasizes the significance of ensemble learning for structural engineering applications. Additionally, Ke et al. [22] suggested optimized Naïve Bayes models to predict rock bursts in underground projects. Particle swarm optimization greatly improved the classification accuracy by feature selection and optimization techniques. The study showed that the maximum tangential stress is the most important parameter for rock-burst occurrence, which highlights the value of optimized ML approaches for geotechnical hazard prediction. However, a clear research gap exists in the application of multi-objective evolutionary algorithms for the optimization of artificial neural networks (ANNs) for the specific binary failure classification (“crack” vs. “non-crack”) from experimental thickness data. This research closes this gap by a comprehensive failure analysis of the SPIF on circular galvanized plates. Experimental data on sheet thickness and coordinates were gathered using three-dimensional scanning, varying the main parameters of the CNC machine (spindle angular velocity, feed rate and table speed). The major contribution of this work is the development of a multi-objective optimized ANN framework. The black-box ANN model is optimized using the non-dominated sorting genetic algorithm II (NSGA-II) for five performance metrics: mean square error (MSE), accuracy, precision, recall, and feature selection. The results of this study demonstrate an optimal predictive function through six different simulations that can determine the failure pattern with high confidence. This framework provides a powerful approach for pre-experimental validation and allows for prediction of sheet thinning and potential fracture during industrial SPIF applications. Finally, the cross-validation studies suggest that the NSGA-II-ANN framework, when trained and validated properly on experimental data, offers generalizable and robust prediction tools for a broad class of engineering failure and deformation problems. Such application-related insights, especially with respect to model choice, design of the objective function and feature importance analysis, are directly portable to the SPIF failure prediction problem studied here.
2. Methodology
In this section, the experimental and computational methodology used to study the failure behavior in single-point incremental forming (SPIF) is described in detail. The proposed methodology is composed of controlled SPIF experiments and a predictive model based on artificial neural networks (ANN) optimized by multi-objective optimization by the non-dominated sorting genetic algorithm (NSGA-II). The aim is to establish a strong correlation between process parameters, thickness growth and failure events so that crack development can be predicted accurately before physical testing. In the experimental investigation, the SPIF method was performed on circular galvanized steel sheets using a three-axis CNC milling machine. The tensile test is a common test for finding the mechanical properties of a material under axial loading. It gives important data on tensile properties such as limits of elastic and plastic deformation, elongation, Young’s modulus, ultimate tensile strength, yield point and yield strength. Specimens for tensile testing were prepared according to ASTM E8, to ensure consistency and reproducibility of the data. The mechanical tests were performed in a SANTAM STM-150 universal testing machine, with a constant crosshead speed of 10 mm/min. The collected data were used for the calculation of the yield stress and other relevant mechanical parameters of the sheet material, as discussed in the corresponding table. The stress-strain curves, obtained from the tensile test, are shown in Fig. 1, describing the elastic and plastic behavior of galvanized sheets under uniaxial tension.
Fig. 1Elongation test of sample and results [23]
![Elongation test of sample and results [23]](https://static-01.extrica.com/articles/26574/26574-img1.jpg)
Based on tensile test in Fig. 1, the mechanical properties of sheet can be extracted in Table 1 through reference.
Table 1Mechanical properties of thin circular plate
Parameters | Value |
Elastic modules | 210 GPa |
Density | 7800 Kg/m3 |
Ultimate tensile | 312 MPa |
Yield strain | 0.0310 |
Yield stress | 261.7 MPa |
A hemispherical forming tool was used to incrementally deform the sheet along a predefined toolpath. The geometry of the specimens and the forming configuration are illustrated in Fig. 2(a). To ensure consistency across experiments, the initial sheet thickness and tool diameter were kept constant. The primary process parameters considered in this study include spindle rotational speed, tool feed rate, and table movement, as these variables directly influence strain distribution, material flow, and thickness reduction during forming (see Table 2 and Fig. 2(a)).
Current experiments based on SPIF have been shown in Fig. 3.
Fig. 2Current case study, a) geometrical properties of circular plate in millimeter scale, b) schematic of the SPIF subsequent to the forming procedure, the geometry of the distorted sheets was recorded utilizing
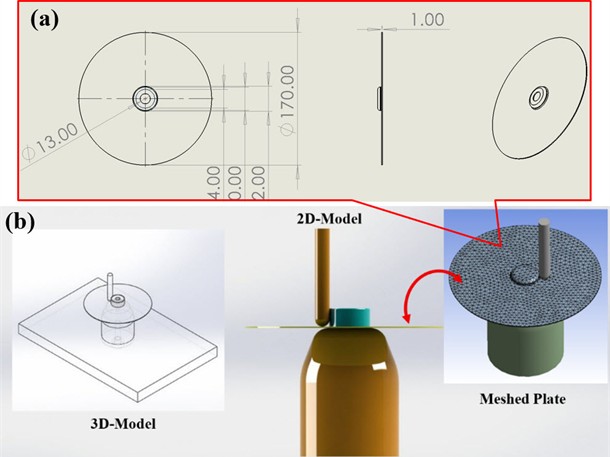
Fig. 3The SPIF components: a) dynamical pin, b) 3D-pin sketch, c) critical route lines in formed shape, d) top-view of the process, e) contact point and its geometry, f) real-size pins, g) experimental setup, h) start experiment, i) final experiment
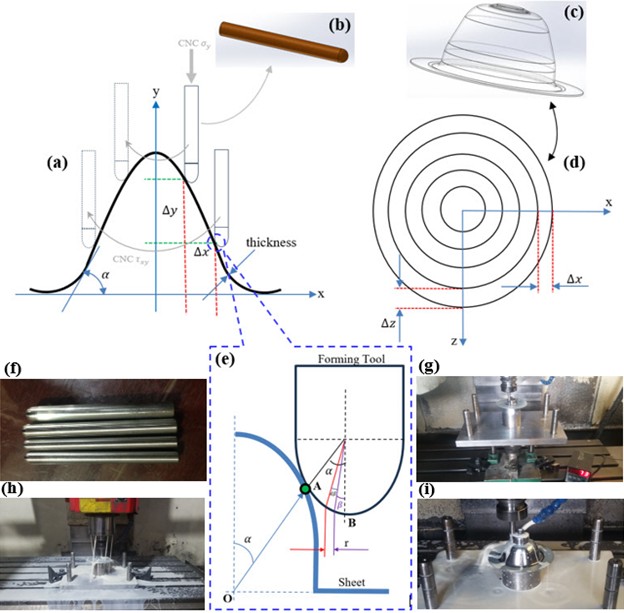
Table 2Dynamic specification of tests
Speed Parameter | Test 1 | Test 2 | Test 3 | ||||
Type 1 | Type 2 | Type 3 | Type 4 | Type 5 | |||
Spindle (rpm) | 750 | 1200 | 1500 | 1800 | 2100 | 2400 | 1200 |
Table moving (mm/min) | 1200 | ||||||
Forming tool feed (mm/min) | 1 | 0.1 | 0.05 | ||||
3. Three-dimensional scanning techniques
Fig. 4 illustrates the collected data were analyzed to determine thickness distribution and spatial coordinates of the produced components. Areas undergoing substantial thinning were meticulously examined, as they are intimately linked to the initiation of failure. Failure was characterized by the presence of visible cracking in the sheet, and the dataset was labeled using a binary classification method, categorizing each sample as either “crack” or “non-crack.” The dataset comprises input features obtained from process parameters and geometric measurements, accompanied by output labels indicating failure conditions.
Fig. 4Optical images of the workpiece before and after wire cutting: a) powder coating, b) wire-cut sample, c) preparation of wire-cut test samples, d) back side area, e) inside area, f) reference points for CMM, g) 3D wire-cut sample, h) cutting edge, i) inside curvature, j) surface process, k) point cloud
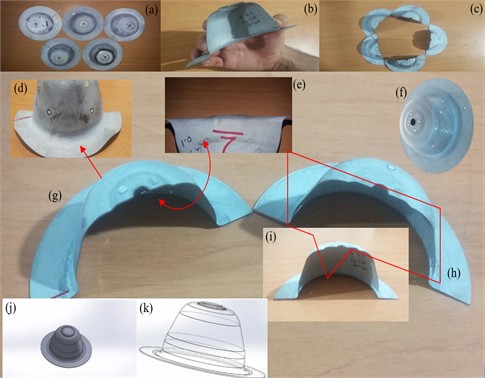
Fig. 5Block diagram of data mining of the current research
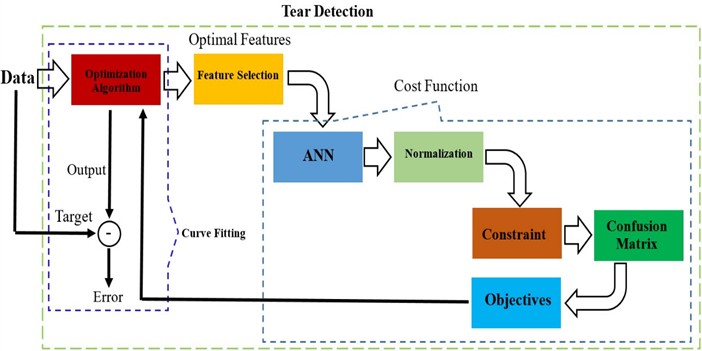
The core data mining of current research is planned in Fig. 5 and represents an ANN that was designed to model the non-linear relationship between process parameters and failure behavior. The ANN architecture has an input layer, one or more hidden layers and an output layer for binary classification. The input layer is fed with process parameters and selected features from the experimental dataset, and the output layer predicts the probability of crack formation. The network is trained by supervised learning to minimize prediction error and maximize accuracy of classification. The model performance is evaluated using standard metrics, including accuracy, precision, recall and MSE, to provide a comprehensive evaluation of the predictive capability.
In order to present an optimal model, it needs to justify hyperparameters in both the optimization algorithm and the ANN model founded on trial and error to achieve minimum error and runtime. This research is simulated based on tuning NSGA-II and ANN specifications that are tabled in Table 3 and Table 4, respectively.
Table 3Main parameters in NSGA-II
Parameter | Value |
Iteration | 10 |
Population size | 100 |
Crossover probability | 0.7 |
Number of crossover offspring | 70 |
Mutation probability | 0.4 |
Number of Mutated Individuals | 40 |
Mutation rate | 0.02 |
Mutation step size | 1 |
Table 4Specification of ANN
Parameter | Value |
Number of inputs | 3 |
Hidden neurons | 10 |
Number of outputs | 1 |
Performance | 2.93e-9 |
Train performance | 3.97e-10 |
Evaluation performance | 5.49e-9 |
Test performance | 1.25e-8 |
Selected features | [2, 4, 11, 10, 3, 5, 6, 8, 7] |
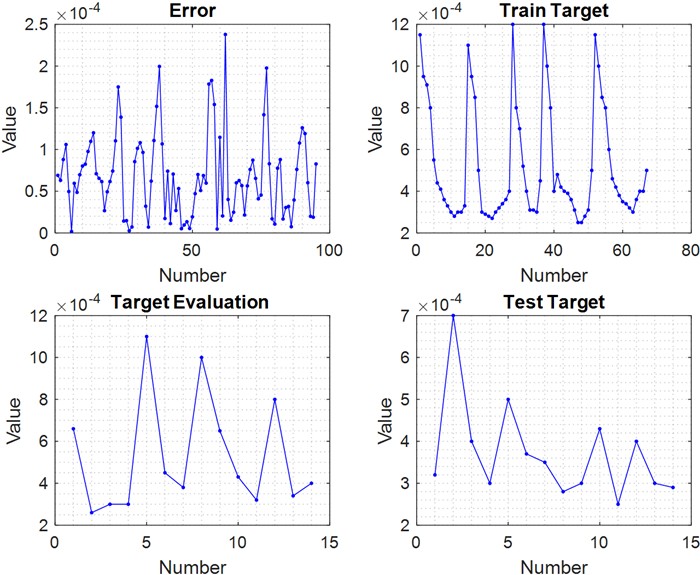
According to the simulation result of the ANN-NSGA II to model experimental data of the SPIF, it achieves agreeable performance in training and test data, which are shown in Fig. 6.
A strong and unbiased assessment of the proposed framework was provided by splitting the entire data set into training and held-out test subsets prior to any model development. It employed a split ratio of 80 % for training and 20 % for testing, resulting in about 76 training samples and 20 test samples from a total of 96 labeled instances. The test subset was held out completely during training and NSGA-II optimization and used only for final performance evaluation. This stringent division ensures that all reported metrics reflect the model’s ability to generalize to unseen data, not to memorize the training set. To further test the stability and consistency of the optimization procedure, six independent simulations were performed, each with a different random initialization of the NSGA-II algorithm, keeping the same fixed train/test partition. Reporting results over six independent runs rather than a single run minimizes the influence of random seed choice on the results and provides a statistically more representative picture of the predictive capability of the framework. All performance metrics in this study, including accuracy, precision, recall, mean squared error, ROC curves and confusion matrices, are computed only on the held-out test set unless otherwise specified.
Fig. 6ANN’s performance in current data
4. Result and discussion
The formed specimens after the SPIF experiments were analyzed by 3D scanning techniques to extract geometric features, thickness distribution and deformation patterns. In this work, 3D imaging is an important tool for reverse engineering purposes, allowing detailed assessment of the forming quality and failure behavior. The formed sheets were cut into two halves by wire cutting before scanning to increase the accuracy of measurement. The procedure allowed clear visualization of internal deformation, reduction in thickness and localized regions of necking. The overall experimental results are shown in Fig. 5 for a number of forming conditions, including cracked and non-cracked samples with different process parameters. The figure clearly demarcates safe forming regions from failure zones, highlighting the influence of process conditions on crack initiation.
4.1. Thickness distribution and experimental observations
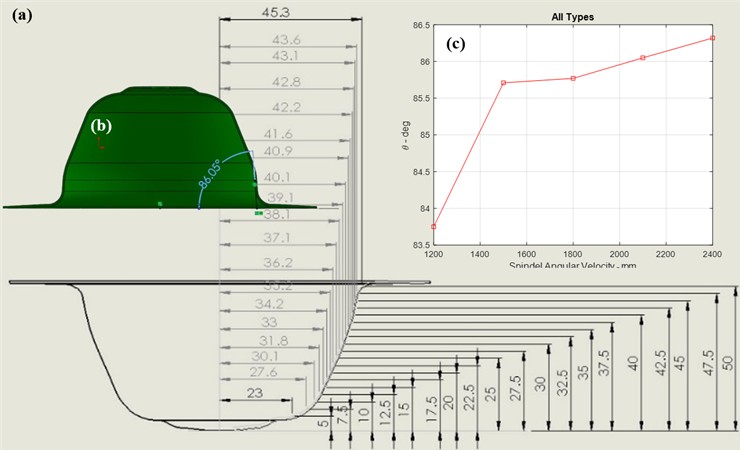
Quantitative results obtained from 3D scanning are summarized in Table 5. Variations in thickness are reported at different spatial locations for multiple forming conditions. The data present a detailed picture of the evolution of the thickness along the formed geometry. For easier interpretation, thickness distributions are shown in Fig. 6(a-d). The two-dimensional and three-dimensional visualizations are given. These figures illustrate the variation of the thickness in different areas of the formed sheet and for different process configurations. Results show an overall higher thickness near the beginning and end of the toolpath, which is due to material accumulation and less deformation in these areas. In comparison, minimum thickness is encountered in the regions of maximum deformation and particularly in those areas where the wall angle approaches critical values close to 90°. These areas are highly susceptible to local necking and subsequent crack initiation. Moreover, the variation of thickness with respect to process parameters indicates that the higher the intensity of deformation, the more thinning and therefore the higher the probability of failure. This observation confirms the strong dependence of formability on process conditions such as tool movement and deformation paths.
Fig. 7Final samples under different SPIF conditions, (a, b, d, e, f, l) with cracked zones, and (c, g, i, m, n) without cracked zones, (p, q, r) zoomed-in and wire-cut views in test 2, type 5, (s) successful sample
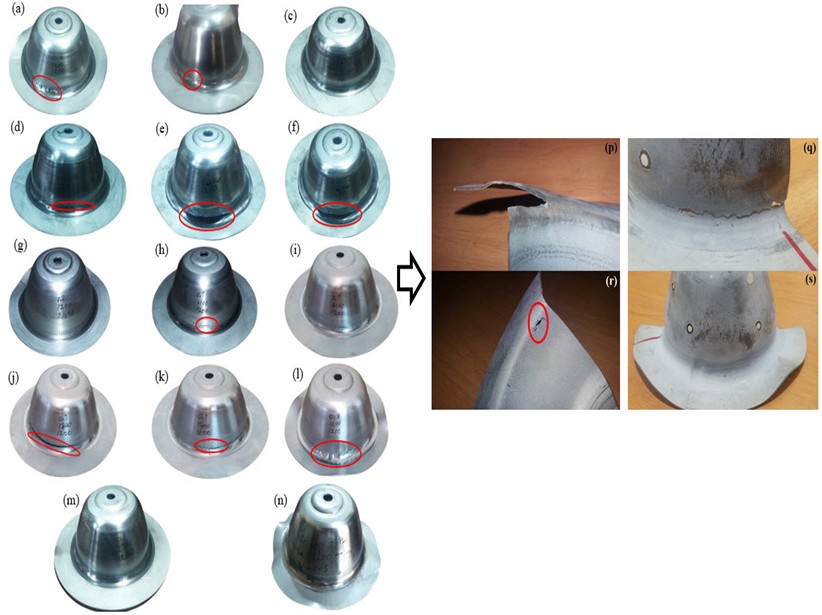
Table 5Extract results of the formed sheet from 3D-scan
No | |||||||||||
1 | 5 | 26.6 | 1.15 | 21.2 | 1.1 | 22 | 1.2 | 23.7 | 1.2 | 23 | 1.15 |
2 | 7.5 | 29.6 | 0.95 | 25.6 | 1.1 | 26.3 | 1 | 27.7 | 1 | 27.6 | 1 |
3 | 10 | 31.5 | 0.91 | 28.6 | 0.95 | 29.1 | 0.8 | 30.1 | 0.8 | 30.1 | 0.85 |
4 | 12.5 | 33 | 0.8 | 30.5 | 0.85 | 30.8 | 0.7 | 31.8 | 0.8 | 31.8 | 0.8 |
5 | 15 | 34.2 | 0.66 | 31.9 | 0.7 | 32 | 0.65 | 33.1 | 0.4 | 33 | 0.6 |
6 | 17.5 | 35.3 | 0.55 | 33.1 | 0.5 | 33.1 | 0.52 | 34.2 | 0.48 | 34.2 | 0.46 |
7 | 20 | 36.4 | 0.44 | 34.1 | 0.45 | 34.1 | 0.5 | 35.2 | 0.42 | 35.2 | 0.42 |
8 | 22.5 | 37.4 | 0.41 | 35.1 | 0.4 | 35.2 | 0.43 | 36.3 | 0.4 | 36.2 | 0.4 |
9 | 25 | 38.5 | 0.36 | 36 | 0.38 | 36.2 | 0.4 | 37.3 | 0.39 | 37.1 | 0.38 |
10 | 27.5 | 39.5 | 0.33 | 37 | 0.3 | 37.2 | 0.37 | 38.3 | 0.36 | 38.1 | 0.35 |
11 | 30 | 40.5 | 0.32 | 38.1 | 0.29 | 38.4 | 0.35 | 39.3 | 0.34 | 39.1 | 0.34 |
12 | 32.5 | 41.4 | 0.3 | 39 | 0.28 | 39.4 | 0.32 | 40.2 | 0.31 | 40.1 | 0.32 |
13 | 35 | 42.2 | 0.28 | 39.8 | 0.27 | 40.2 | 0.31 | 41 | 0.25 | 40.9 | 0.3 |
14 | 37.5 | 42.9 | 0.26 | 40.3 | 0.3 | 40.7 | 0.31 | 46.1 | 0.25 | 41.6 | 0.29 |
15 | 40 | 43.4 | 0.3 | 40.7 | 0.3 | 41.1 | 0.28 | 42 | 0.25 | 42.2 | 0.3 |
16 | 42.5 | 43.8 | 0.3 | 41 | 0.32 | 41.4 | 0.3 | 42.2 | 0.28 | 42.8 | 0.36 |
17 | 45 | 44.1 | 0.3 | 41 | 0.34 | 41.4 | 0.3 | 42.2 | 0.31 | 43.1 | 0.4 |
18 | 47.5 | 44.3 | 0.33 | 41.7 | 0.36 | 41.8 | 0.43 | 42.3 | 0.4 | 43.6 | 0.4 |
19 | 50 | 44.5 | 0.3 | 44.2 | 0.4 | 43.8 | 0.45 | 44.1 | 0.5 | 45.3 | 0.5 |
Fig. 8Thickness variations in test 2: a) 2D-formed geometry, b) maximum angle, d) different angles in various spindle velocities
4.2. Finite element analysis (ANSYS simulation)
Finite element simulations were carried out using ANSYS to support the experimental results. The numerical model simulates the SPIF process with the forming tool modelled as a rigid body and sheet material as a deformable structure. Based on Fig. 9, it demonstrates the modelling process in the ANSYS Workbench environment according to static analysis, which is equal to the experimental process. ANSYS procedures include pre-processing such as importing, meshing, and boundary conditions; processing such as starting solutions; and finally, post-processing such as obtaining results, as shown in Figs. 10 to 13. Table 6 addresses the geometrical parameters extracted in ANSYS.
Fig. 9Finite element analysis with ANSYS simulation
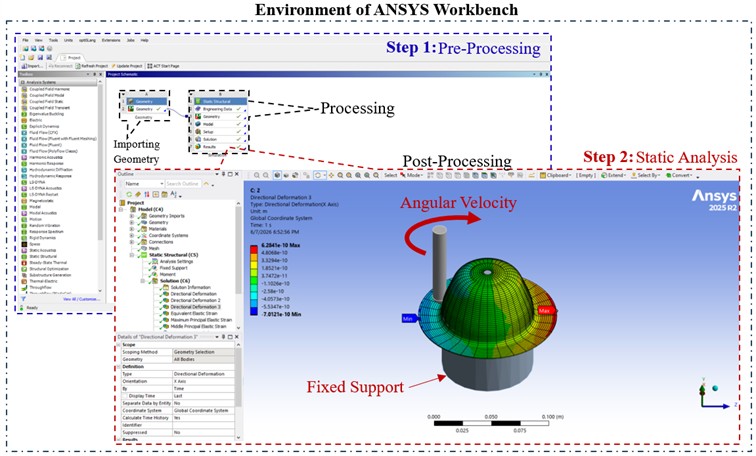
Table 6FEM parameters in ANSYS
Parameter | Value |
Average surface area (m2) | 6.4309e-3 |
Minimum edge length (m) | 2.2619e-2 |
Mesh type | Quad/Tri |
Node number | 11361 |
Element number | 1601 |
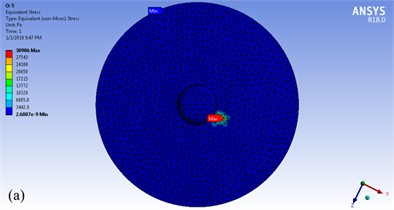
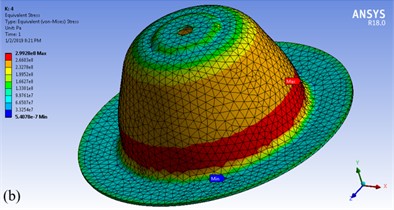
The distribution of von Mises stress at the initial stage of deformation is given in Fig. 10(a). At this stage, the plastic deformation initiates at the tool–sheet contact region where the stress concentration is localized. The results indicate that regions subjected to higher tool pressure experience a significant increase in stress. The final stress distribution at the end of the forming is shown in Fig. 10(b). These results show the generation of critical stress zones, which are in good agreement with the experimentally detected failure areas. The major stress concentrations are found in the regions of extreme thinning, confirming the important role of the stress build-up in the crack initiation. The overall numerical results can be well compared with the experimental counterpart, which validates the reliability of the simulation model for the analysis of deformation behavior and critical region identification in the SPIF.
Fig. 10Von-Miss Stress in contact zone of the test 2 of SPIF
Totally, the ANSYS results of the SPIF numerically are plotted in Fig. 10 to Fig. 12. Fig. 10 provides a detailed validation of the tests against ANSYS simulations in the elasticity domain, including the associated errors, and it also facilitates an easy comparison of plasticity values that exceed the elasticity stress.
Fig. 11Validation of mechanical stress in elasticity and plasticity
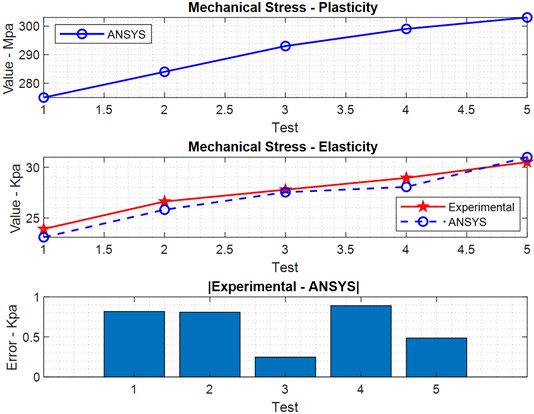
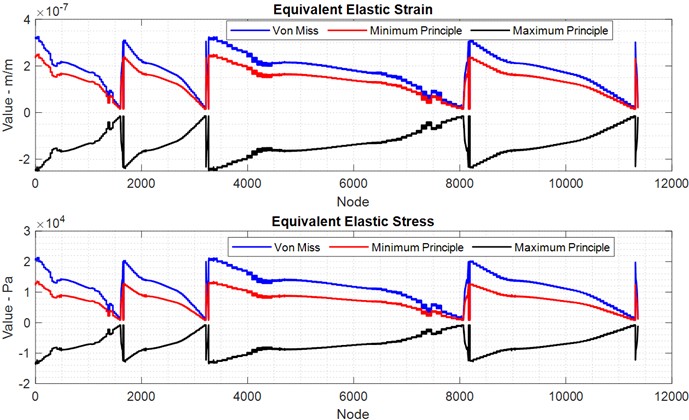
Fig. 11 depicts the deflections of all nodes in the meshed shape across the , , and directions, clearly illustrating the effects of the incremental forming processes that occur periodically and circularly over the sheet during the process. Similarly, Fig. 12 represents the equivalent mechanical strain and stress for all nodes that are periodically varying in static analysis.
Fig. 12Workpiece deflection in the X-, Y-, and Z-directions in test 2
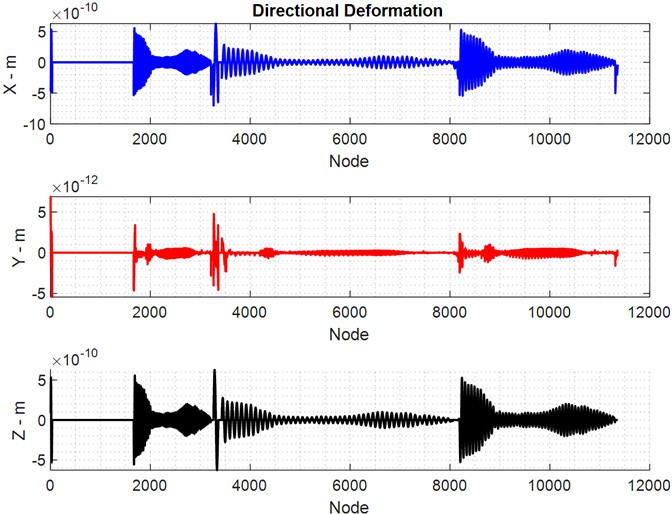
Fig. 13Mechanical stress and strain of current formed sheet in test 2
A data-driven modeling approach was applied for further analysis of the complex relations between process parameters and failure behavior. The dataset of experimental measurements and geometric features was organized and prepared for machine learning analysis. Fig. 14 shows an example of dataset organization that describes input features and corresponding outputs. The predictive modeling framework integrates ANN with the multi-objective optimization algorithm NSGA-II. The robustness and reproducibility of the results were tested by evaluating the performance of the proposed NSGA-II-ANN framework for 6 independent simulations, which are shown in Fig. 15, each of which was initialized with a different random seed of the optimization algorithm. In all six cases, the accuracy, precision, recall, and mean squared error values reported were calculated on the held-out test set of 95 samples that had been withheld from the entire training and optimization procedure.
Fig. 14General classified experimental data within mechanical and geometrical data
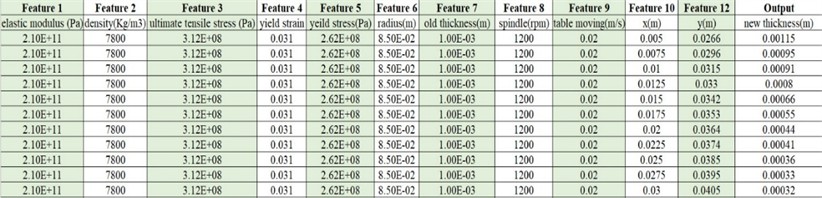
Fig. 15Optimal predictions of the SPIF’s thickness for 6 simulations
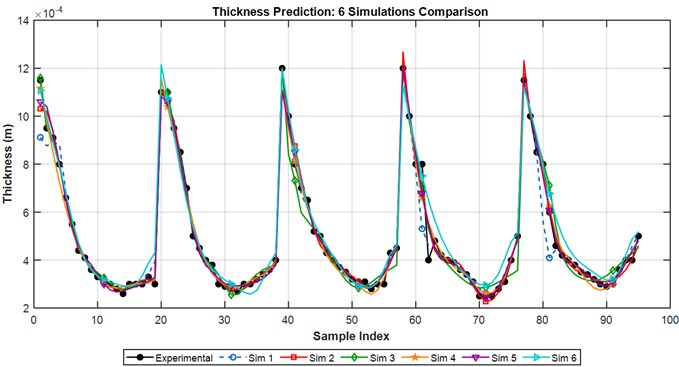
Fig. 16Optimal receiver operating characteristic (ROC) for 6 simulations
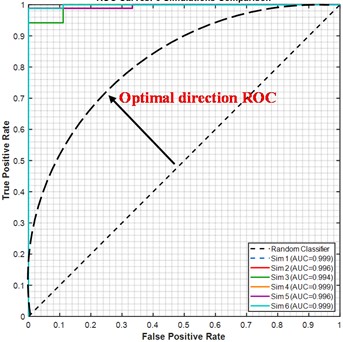
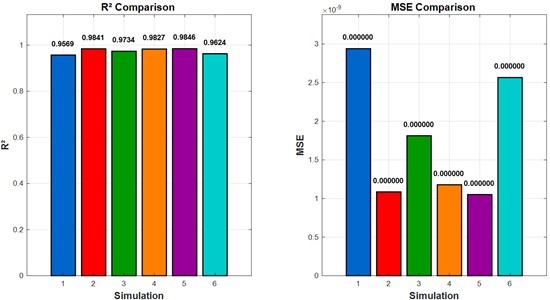
This evaluation strategy makes sure that the performance numbers reported here represent true generalization ability to unseen experimental data, rather than a reflection of training errors. The predicted thickness values from the optimized model are shown in Fig. 11 and they agree well with the experimental data. The classification performance of ANN is also evaluated using receiver operating characteristic (ROC) curves, as shown in Fig. 16, and Fig. 17 represents confusion matrices, which indicate the high discrimination ability between cracked and non-cracked conditions. Fig. 18 assesses accuracy of classification in the confusion matrices and the dominant diagonal entries show that the model can distinguish the failure from the safe states with high dependability. Fig. 19 shows a comparative analysis of the performance metrics such as accuracy, precision and recall and a consistent performance in all the simulations. Fig. 20 displays the multi-objective optimization results as Pareto fronts, illustrating the trade-offs between conflicting objectives, such as prediction accuracy and error minimization. Fig. 21 shows model accuracy () versus the prediction error and the variation of mean squared error (MSE) across simulations. It shows stable convergence in the optimization process. Fig. 22 illustrates how feature importance and selection behave during the optimization process and how the algorithm identifies the most important input variables.
Fig. 17Optimal binary confusion matrices for 6 simulations evaluated on the held-out test set, showing the distribution of true positive, true negative, false positive, and false negative classifications for crack and non-crack conditions across all independent optimization runs
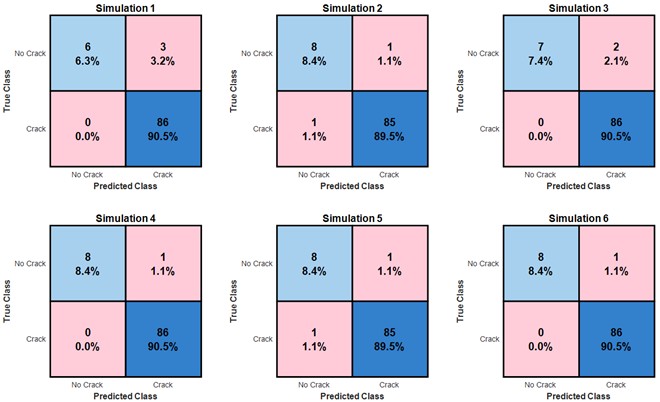
Fig. 18Accuracy vs. MSE trade-off for 6 simulations
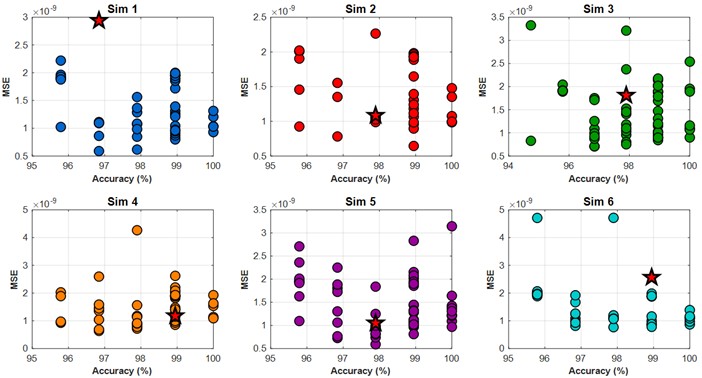
Fig. 19Representation applied percentage of objectives in 6 simulations
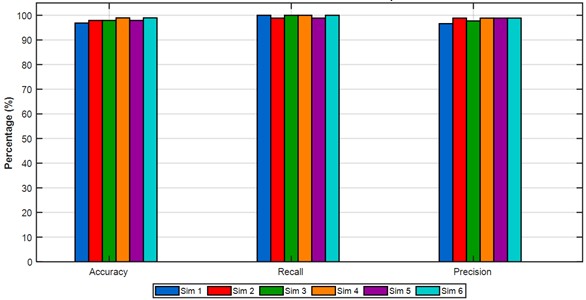
Fig. 20Multi-objective of Pareto fronts of 6 simulations
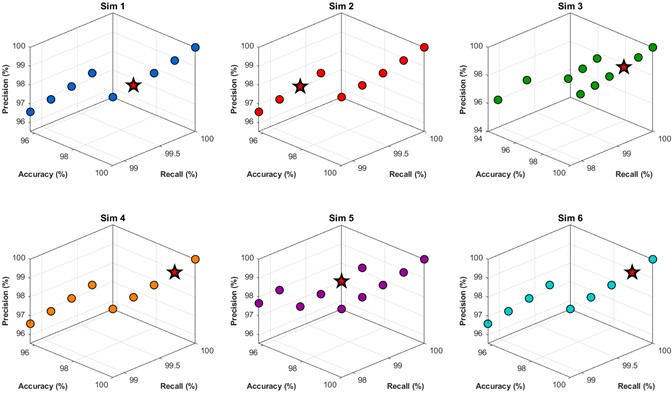
Fig. 21Comparisons among R2 and MSE factors for 6 simulations
4.3. Stratified K-fold cross-validation
The main goal in cross-validation is to verify the reality and authenticity of the dataset; therefore, cross-validation tests an ANN with different parts of the experimental data for some time (i.e., five folds). To do this, a five-fold cross-validation strategy is introduced to evaluate the dataset framework by partitioning experimental data into five equally sized portions meanwhile the original dataset is distributed in two classes, such as 90 % crack and 10 % no-crack. Hence, NSGA-II optimizes each of five rounds, including four folds exclusively, according to 76 samples for training and 20 samples for the test set. This loop repeats five times, which results in accuracy, precision, recall, MSE, , and the a20 index. Thus, the framework NSGA-II-ANN is evaluated based on fivefold cross-validation (see Fig. 23 to Fig. 28) and also mean and standard deviation, each of which fivefold reports stability and generalizability of the current framework in different portions, as in Table 7.
Fig. 22Diversity usage of the features during 6 simulations
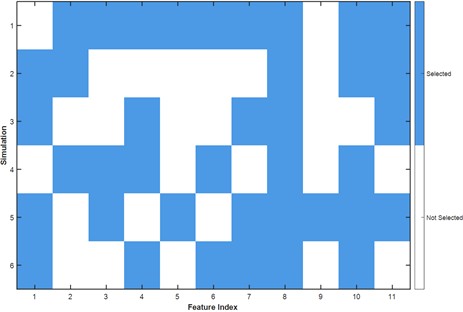
Fig. 23ROC curves of the proposed NSGA-II-ANN framework across five stratified cross-validation
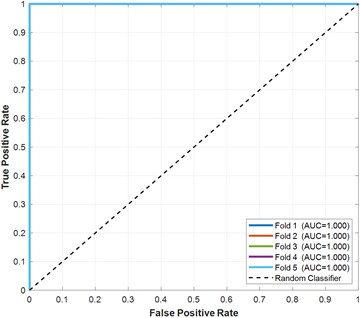
Table 7Cross-validation performance of the proposed NSGA-II-ANN framework across five stratified folds
Fold | Accuracy (%) | Precision (%) | Recall (%) | F1-score | MSE | R2 | a20 (%) | AUC |
1 | 94.74 | 94.74 | 100 | 97.3 | 0.013158 | 0.7361 | 94.74 | 1 |
2 | 89.47 | 89.47 | 100 | 94.44 | 0.048788 | 0.4820 | 78.95 | 1 |
3 | 89.47 | 89.47 | 100 | 94.44 | 0.030578 | 0.6753 | 89.47 | 1 |
4 | 89.47 | 89.47 | 100 | 94.44 | 0.026316 | 0.7206 | 89.47 | 1 |
5 | 89.47 | 89.47 | 100 | 94.44 | 0.026316 | 0.7206 | 89.47 | 1 |
Mean | 90.53 | 90.53 | 100 | 95.02 | 0.029031 | 0.6669 | 88.42 | 1 |
Std | 2.35 | 2.35 | 0 | 1.28 | 0.01284 | 0.1059 | 5.77 | 0 |
Fig. 24Binary confusion matrices of the NSGA-II-ANN classifier for each cross-validation fold
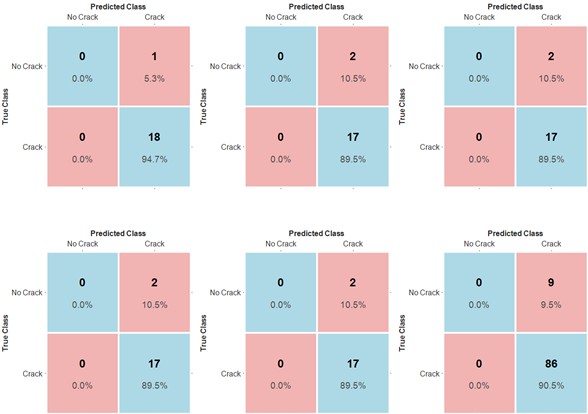
Fig. 25Classification performance of the NSGA-II-ANN across five cross-validation folds
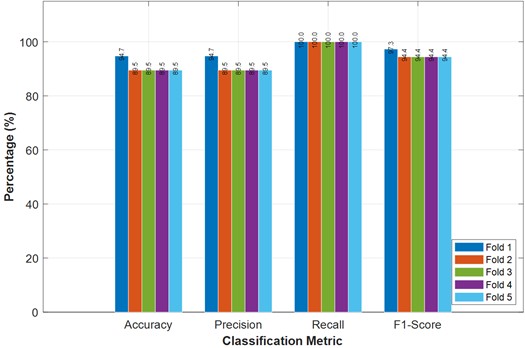
Fig. 26Regression performance of the NSGA-II-ANN across five cross-validation folds: left – R2; right – MSE
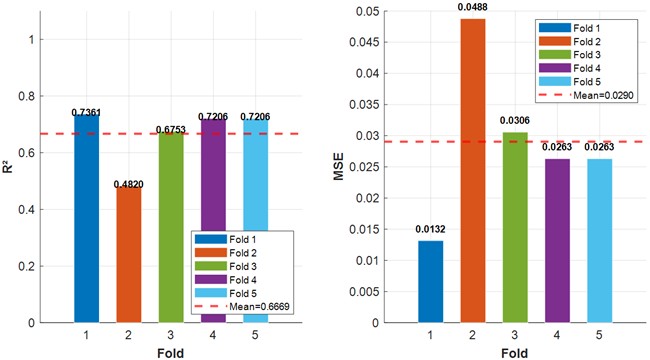
Fig. 27The a20 index of the NSGA-II-ANN across five cross-validation folds
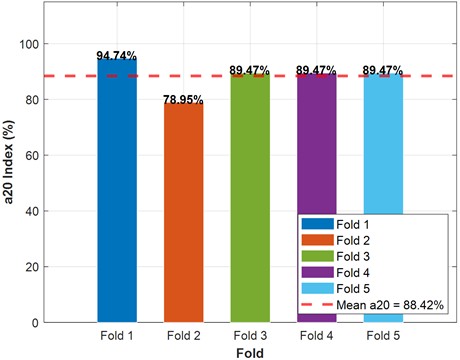
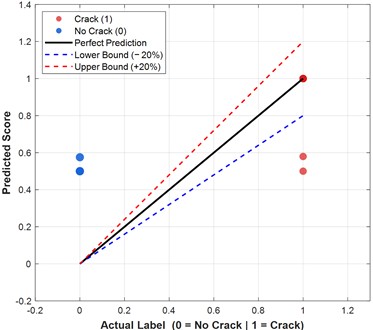
Fig. 28Predicted scores versus actual binary labels for all test samples pooled across the five cross-validation folds
5. Conclusions
In this work, a joint experimental and data-driven approach for failure analysis in single-point incremental forming (SPIF) was proposed. Experiments were conducted on circular galvanized steel sheets by changing the process parameters like spindle speed, feed rate and table movement. The results show that these parameters have a strong effect on thickness distribution and failure behavior and that the local thinning was identified as the main mechanism for crack initiation. The geometry and thickness data of the formed components were accurately extracted using 3D scanning and reverse engineering techniques. The analysis shows that the maximum thinning occurs in areas where the wall angle approaches critical values, while material accumulation occurs near the beginning and end of the toolpath. The numerical analysis was in good agreement with the experimental observations, particularly in the identification of the zones of stress concentration associated with the regions of failure. The application of von Mises criterion further confirmed that the crack initiation is closely related to the accumulation of equivalent stress in severely thinned areas. This work makes a significant contribution to the development of a predictive modeling framework using artificial neural networks (ANN) optimized by the non-dominated sorting genetic algorithm II (NSGA-II). The model was trained with experimental data where the process parameters were the inputs and the thickness was the primary output variable. Multi-objective optimization of various performance metrics such as accuracy, precision, recall, and mean squared error was carried out simultaneously using the NSGA-II algorithm. The proposed NSGA-II-ANN framework is shown to make very reliable predictions of the failure behavior in six independent simulations. The receiver operating characteristic (ROC) analysis revealed a strong classification ability, and confusion matrices indicated that most of the simulations achieved prediction accuracies above 90 %. The best performance was obtained in the sixth simulation of the tested models with better discrimination between crack and non-crack and better overall stability. With some caveats, these encouraging results were observed. In the experimental setup, the process parameters were kept constant during forming, which might have resulted in premature fracture in some cases. Future work could investigate adaptive or variable process strategies to enhance formability and reduce thinning. In addition, in order to further develop the failure characterization, the following material durability and mechanical integrity properties should be investigated in future studies: (i) evolution of surface hardness along the formed wall, particularly as a function of spindle speed and step-down size, due to the direct relation with wear resistance in service; (ii) fatigue life and cyclic failure resistance of incrementally formed parts, which is critical for applications submitted to repeated loading such as aerospace and biomedical devices; (iii) residual stress distribution through the sheet thickness, since residual stresses introduced during the SPIF process directly influence the long-term dimensional stability and susceptibility to stress-corrosion cracking; and (iv) springback magnitude and its dependence on wall angle and toolpath strategy, as uncontrolled springback deteriorates the geometric accuracy and affects the structural performance of the final part. The inclusion of these properties as additional output variables in the predictive framework would greatly enhance its applicability for complete industrial quality assessment. In conclusion, the suggested hybrid framework effectively combines the experimental analysis, numerical simulation, and machine learning to deliver a complete understanding of the failure mechanisms in SPIF. The developed predictive model is a practical tool for the prediction of the failure of the thickness and optimization of the process parameters before the manufacturing. The method holds great promise for industrial applications where the reduction of trial-and-error experimentation is critical to improved efficiency and product quality.
References
-
S. Wu, Y. Ma, L. Gao, Y. Zhao, S. Rashed, and N. Ma, “A novel multi-step strategy of single point incremental forming for high wall angle shape,” Journal of Manufacturing Processes, Vol. 56, pp. 697–706, 2020, https://doi.org/10.1016/j.jmapro.2020.05.009
-
M. Milutinović, R. Lendjel, S. Baloš, D. L. Zlatanović, L. Sevšek, and T. Pepelnjak, “Characterisation of geometrical and physical properties of a stainless steel denture framework manufactured by single-point incremental forming,” Journal of Materials Research and Technology, Vol. 10, pp. 605–623, 2021, https://doi.org/10.1016/j.jmrt.2020.12.014
-
G. Ingarao, O. Zaheer, and L. Fratini, “Manufacturing processes as material and energy efficiency strategies enablers: the case of Single Point Incremental Forming to reshape end-of-life metal components,” CIRP Journal of Manufacturing Science and Technology, Vol. 32, pp. 145–153, 2021, https://doi.org/10.1016/j.cirpj.2020.12.003
-
D. R. Cooper and T. G. Gutowski, “Prospective Environmental Analyses of Emerging Technology: A Critique, a Proposed Methodology, and a Case Study on Incremental Sheet Forming,” Journal of Industrial Ecology, Vol. 24, No. 1, pp. 38–51, 2018, https://doi.org/10.1111/jiec.12748
-
D. Pinard, D. R. Skelton, M. Gucciardi, G. Buffa, L. Fratini, and H. Yamaguchi, “Study of forming mechanics of magnetic field-assisted single point incremental forming,” Journal of Manufacturing Processes, Vol. 79, pp. 28–34, 2022, https://doi.org/10.1016/j.jmapro.2022.04.038
-
M. Ilyas, G. Hussain, H. Rashid, and M. Alkahtani, “Influence of forming parameters on the mechanical behavior of a thin aluminum sheet processed through single point incremental forming,” Metals, Vol. 10, No. 11, p. 1461, Oct. 2020, https://doi.org/10.3390/met10111461
-
J. Slota et al., “Residual stresses and surface roughness analysis of truncated cones of steel sheet made by single point incremental forming,” Metals, Vol. 10, No. 2, p. 237, Feb. 2020, https://doi.org/10.3390/met10020237
-
G. Yoganjaneyulu, R. C., N. Manikandan, and C. Sathiya Narayanan, “Investigations on multi-sheets single point incremental forming of commercial pure titanium alloys,” Materials and Manufacturing Processes, Vol. 35, No. 9, pp. 1002–1009, 2020, https://doi.org/10.1080/10426914.2020.1753882
-
G. Hussain, M. Ilyas, B. B. Lemopi Isidore, and W. A. Khan, “Mechanical properties and microstructure evolution in incremental forming of AA5754 and AA6061 aluminum alloys,” Transactions of Nonferrous Metals Society of China, Vol. 30, No. 1, pp. 51–64, 2020, https://doi.org/10.1016/s1003-6326(19)65179-4
-
D. Nasulea and G. Oancea, “Achieving accuracy improvements for single-point incremental forming process using a circumferential hammering tool,” Metals, Vol. 11, No. 3, p. 482, Mar. 2021, https://doi.org/10.3390/met11030482
-
H. K. Nirala and A. Agrawal, “Residual stress inclusion in the incrementally formed geometry using fractal geometry based incremental toolpath (FGBIT),” Journal of Materials Processing Technology, Vol. 279, p. 116575, 2020, https://doi.org/10.1016/j.jmatprotec.2019.116575
-
G. Buffa, M. Gucciardi, L. Fratini, and F. Micari, “Multi-directional vs. mono-directional multi-step strategies for single point incremental forming of non-axisymmetric components,” Journal of Manufacturing Processes, Vol. 55, pp. 22–30, 2020, https://doi.org/10.1016/j.jmapro.2020.03.055
-
F. Feng, J. Li, R. Chen, L. Huang, H. Su, and S. Fan, “Multi-point die electromagnetic incremental forming for large-sized sheet metals,” Journal of Manufacturing Processes, Vol. 62, pp. 458–470, 2021, https://doi.org/10.1016/j.jmapro.2020.12.022
-
P. A. F. Martins, N. Bay, M. Skjoedt, and M. B. Silva, “Theory of single point incremental forming,” CIRP Annals, Vol. 57, No. 1, pp. 247–252, 2008, https://doi.org/10.1016/j.cirp.2008.03.047
-
K. Praveen, R. Lingam, and N. V. Reddy, “Tool path design system to enhance accuracy during double sided incremental forming: an analytical model to predict compensations for small/large components,” Journal of Manufacturing Processes, Vol. 58, pp. 510–523, 2020, https://doi.org/10.1016/j.jmapro.2020.08.014
-
S. M. Najm and I. Paniti, “Investigation and machine learning-based prediction of parametric effects of single point incremental forming on pillow effect and wall profile of AlMn1Mg1 aluminum alloy sheets,” Journal of Intelligent Manufacturing, Vol. 34, No. 1, pp. 331–367, 2022, https://doi.org/10.1007/s10845-022-02026-8
-
C. Wang, A. He, S. Liu, and P. A. Meehan, “Learning-based model predictive control for two-point incremental sheet forming,” Journal of Manufacturing Processes, Vol. 105, pp. 187–198, 2023, https://doi.org/10.1016/j.jmapro.2023.09.040
-
P. G. Asteris, T. Sivenas, M. Gkantou, A. Formisano, and T.-T. Le, “Estimation of axial load-carrying capacity of elliptical concrete filled steel tubular columns using computational intelligence,” Journal of Building Engineering, Vol. 112, p. 113738, 2025, https://doi.org/10.1016/j.jobe.2025.113738
-
P. G. Asteris et al., “AI-powered GUI for prediction of axial compression capacity in concrete-filled steel tube columns,” Neural Computing and Applications, Vol. 36, No. 35, pp. 22429–22459, 2024, https://doi.org/10.1007/s00521-024-10405-w
-
F. Bendriss, Z. Harichane, A. D. Skentou, R. Rebouh, A. A. Ghrici, and P. G. Asteris, “Advanced machine learning models for estimating seismic bearing capacity of shallow strip footings considering P – and S-wave effects,” Soil Dynamics and Earthquake Engineering, Vol. 200, p. 109853, 2026, https://doi.org/10.1016/j.soildyn.2025.109853
-
C. Bai, H. Nguyen, P. G. Asteris, T. Nguyen-Thoi, and J. Zhou, “A refreshing view of soft computing models for predicting the deflection of reinforced concrete beams,” Applied Soft Computing, Vol. 97, p. 106831, 2020, https://doi.org/10.1016/j.asoc.2020.106831
-
B. Ke, M. Khandelwal, P. G. Asteris, A. D. Skentou, A. Mamou, and D. J. Armaghani, “Rock-burst occurrence prediction based on optimized Naïve Bayes models,” IEEE Access, Vol. 9, pp. 91347–91360, Jan. 2021, https://doi.org/10.1109/access.2021.3089205
-
M. Hasanlu and S. Mokari, “Numerical-experimental single point incremental forming of thin circular plate,” Advanced Manufacturing Research, Vol. 3, No. 1, pp. 1–13, 2025, https://doi.org/10.21595/amr.2025.24756
About this article

The authors have not disclosed any funding.
The datasets generated during and/or analyzed during the current study are available from the corresponding author on reasonable request.
The authors declare that they have no conflict of interest.

