Abstract
Ensuring the seismic safety of ageing earthfill reservoir dams in tectonically active regions requires methods that link field monitoring directly to quantitative structural assessment. Existing studies, however, typically treat satellite deformation monitoring and dynamic structural modeling as separate activities. This study addresses that gap by developing an integrated framework that combines a national electronic seismic-monitoring platform, real-time instrumental accelerograms, and multi-year Sentinel-1 satellite radar interferometry (InSAR) within a single, traceable chain of analytical and finite-element models. The framework is applicable to both near-field and far-field earthquakes; here it is applied to the earthfill Surkhan reservoir dam (Uzbekistan) following the strong far-field earthquake that occurred in Afghanistan on 3 November 2025 ( = 6.8, = 30 km). Seven years of InSAR data (2017-2023) show that the dam deformation is predominantly seasonal, governed by the reservoir loading cycle, with point-wise cumulative trends that require continued monitoring, while the instrumental records show that the earthquake added only a sub-millimeter transient response well within the elastic range. The macroseismic intensity prediction agrees closely with the instrumental observation, whereas the free-field ground-motion model under-predicts the recorded acceleration by more than an order of magnitude, possible explanations include local site and crest amplification, sensor position and processing, and event-specific source effects, and these remain to be examined against the raw records; the observed site intensity (5 MSK-64) was two intensity degrees below the design-basis intensity of the dam (7 MSK-64). The novelty of the work lies in the joint interpretation of long-term satellite and short-term seismic datasets through one traceable model chain, partially checked against the monitored intensity and displacement quantities, yielding a low-cost, replicable methodology for the rapid post-earthquake safety assessment of reservoir dams in seismically active regions.
1. Introduction
The various kinds of damage resulting from recent strong earthquakes and tectonic plate shifts occurring in foreign countries necessitate intensifying efforts to ensure seismic safety in our country and introducing modern approaches to the field.
Therefore, when strong earthquakes occur, it is crucial to continuously monitor their impact on reservoir dams and the dams’ structural integrity. It is also important to widely implement the practice of assessing the stress-strain state of dams using modern technologies and equipment.
In this regard, a unified system for conducting seismological observations at reservoirs has been established to continuously monitor the structural integrity of existing reservoir dams in Uzbekistan. Specifically, the Republican Center for Seismoprognostic Monitoring of the Ministry of Emergency Situations has been designated to conduct seismological and seismometric observations at reservoir dams, monitor earthquakes related to reservoir impoundment, and assess changes in the seismic regime during the processes of filling and using the reservoirs.
Additionally, the “Electronic Platform for Conducting Seismological Observations at Reservoirs” (hereinafter referred to as the electronic platform) has been launched.
Furthermore, at reservoir dams where seismological and seismometric observations are established, when an earthquake of intensity 5 or higher on the MSK-64 scale is recorded:
a) Data from the seismological and seismometric observations are immediately uploaded to the electronic platform by the Republican Center for Seismoprognostic Monitoring;
b) Organizations responsible for reservoir dams shall immediately identify the negative consequences of an earthquake, such as subsidence, displacement, crack formation, and changes in the filtration regime, and enter the data into the electronic platform;
c) The Academy of Sciences, within a three-day period, shall:
– Study the dynamic properties of reservoir dams based on the data entered into the electronic platform and assess their stress-strain state.
– Prepare and enter into the electronic platform information on the dynamic state of reservoir dams, taking into account changes in the seismic regime from the data provided on seismological and seismometric observations, as well as conclusions for taking appropriate measures.
d) When the conclusions entered into the electronic platform indicate the occurrence of emergency situations, it is stipulated that the organizations responsible for the reservoirs, together with the Ministry of Emergency Situations, the Academy of Sciences, and local government authorities, shall immediately develop and implement a program of appropriate measures and actions [1].
Currently, leading researchers in Uzbekistan and worldwide continue to conduct effective studies on this topic. Sultanov and Umarkhonov [2] analyzed the stress–strain state of earth dams considering soil moisture, while Umarkhonov and Loginov [3] studied the stress–strain state of the Charvak dam under water pressure. Rashidi et al. [4] performed numerical analysis and monitoring of an embankment dam during construction and first impounding. Wei et al. [5] applied a generalized plasticity model to the static and dynamic analysis of a high earth-core dam, and Qi et al. [6] used an effective-stress model to analyze the liquefaction and seismic performance of an earth dam. More recently, finite-element approaches to the seismic performance assessment of concrete and embankment dams and stability analyses of earthen embankment dams under seismic loading have further advanced the field.
It is clear that work in this area has been systematically organized and is ongoing. However, most of the cited studies treat seismic monitoring data and structural-mechanical analysis as separate research tracks: satellite-based deformation monitoring is typically reported descriptively, while dynamic-response calculations are usually performed without reference to long-term ground-based or space-based observational records. The purpose of this study is to develop and apply an integrated quantitative framework that links real-time seismic instrumentation, long-term satellite radar interferometry (InSAR), and a coherent suite of analytical and finite-element models (intensity attenuation, ground motion prediction, dynamic equation of motion, response spectrum, modal analysis, and liquefaction assessment) to assess the seismic safety of an operating earthfill dam following a specific, recently recorded near-field/far-field earthquake event. The novelty of this work lies in (i) the joint use of the November 3, 2025 Afghanistan earthquake ( 6.8) instrumental accelerogram records together with seven years of Sentinel-1 InSAR displacement time series for the same dam, allowing direct comparison of seismic-transient and reservoir-cyclic deformation regimes; (ii) the derivation of a complete, traceable mathematical-model chain (Eq. (1-20)) from regional seismicity to finite-element stress distribution, with each model parameter quantitatively calibrated to the Surkhan dam case; and (iii) the demonstration of a practical, low-cost methodology – combining an existing national electronic monitoring platform with open satellite data – that can be replicated for the rapid post-earthquake safety assessment of other reservoir dams in Uzbekistan and in seismically active regions more generally.
2. Materials and methods
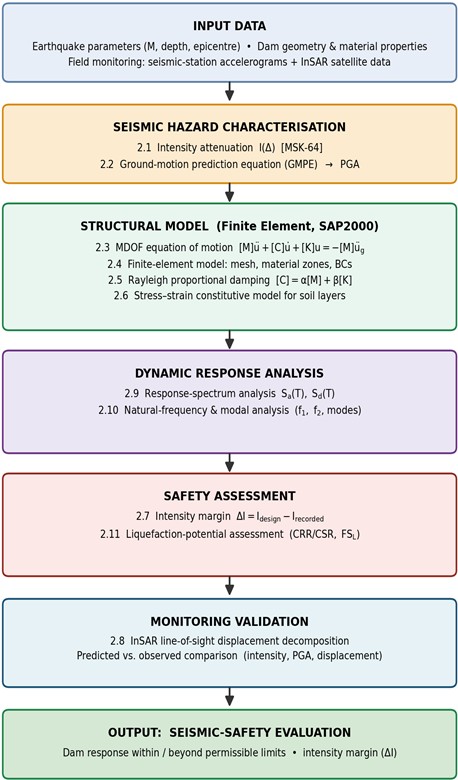
To provide a rigorous scientific basis for evaluating the seismic impact of the November 3, 2025 Afghanistan earthquake on the Surkhan reservoir dam, this section presents the mathematical models used to interpret the observed acceleration, displacement, and stress data. The models cover four interconnected domains: (1) seismic intensity attenuation, (2) ground motion prediction, (3) structural dynamic response of the dam, and (4) satellite-based interferometric displacement decomposition. The overall sequence of the analysis is summarised in the flowchart of Fig. 1.
2.1. Seismic intensity attenuation with epicentral distance
The observed intensity at a site located at hypocentral distance R from an earthquake of epicentral intensity can be estimated with the macroseismic attenuation relationship of the classical Kövesligethy-Blake type [17]:
where: – seismic intensity on the Medvedev-Sponheuer-Kárník macroseismic scale (MSK-64, 1964), a 12-degree ordinal intensity scale [16]; the value denotes the intensity degree (“point”) and is not a 64-point count; – epicentral intensity [MSK-64 degrees]; for the November 3, 2025 Afghanistan earthquake [7, 15] 7-8; – hypocentral (slant) distance from the focus to the site [km], computed as ; – epicentral distance [km]; for the Surkhan dam site 146 km; – focal (hypocentral) depth [km]; 30 km for the November 3, 2025 event; – anelastic (inelastic) attenuation coefficient [km-1]; for the Surkhan region 0.004 km-1 (a value adopted in this study in the absence of a published regional calibration; its influence on the predicted intensity is examined in the sensitivity analysis, Table 5).
The first term accounts for geometric (spherical) spreading of seismic energy, which decreases as the wave front expands. The second term describes the additional energy loss due to anelastic absorption in the crustal material. Substituting the event parameters yields 5 MSK-64 at the Surkhan dam site, consistent with instrumental records (Fig. 2).
Fig. 1General flowchart of the analysis methodology for seismic-safety assessment of the reservoir dam
2.2. Ground motion prediction equation (GMPE)
The Peak Ground Acceleration (PGA) at the dam site is estimated using a generalized illustrative attenuation relation of the GMPE type. Eq. (2) shows, for background, the generalized functional form of empirical ground-motion models of the Boore-Atkinson family [9]. The quantitative prediction used in this study is, however, computed with the fully specified NGA-West2 model of Boore, Stewart, Seyhan and Atkinson (BSSA14) [19], implemented in the open-source pygmm library (version 0.8.0, global region setting, unspecified fault mechanism, default basin-depth handling; the model output is the median of the orientation-averaged horizontal component): for 6.2 [15], Joyner-Boore distance 146 km (epicentral distance used as the far-field proxy) and VS30 = 350 m/s the median PGA is 0.012 g (Fig. 3):
where: PGA – peak ground acceleration [g]; recorded values at the Surkhan dam: horizontal 0.17 g, vertical 0.18 g; – earthquake magnitude; 6.8 is the value reported by the national seismic network for the November 3, 2025 Afghanistan event (magnitude type not specified in the platform record; the USGS moment magnitude is 6.2 [15], and the automatic SeisComP solution of the national network displays MLv 7.0, Fig. 14); – closest distance from the site to the rupture plane [km]; since the rupture geometry is not available, the hypocentral distance ≈ 149 km is used here as a far-field proxy for ; — time-averaged shear-wave velocity in the top 30 m of soil at the site [m/s]; – reference rock velocity; 760 m/s (NEHRP class B/C boundary); - – empirical regression coefficients of the generalised form; Eq. (2) is shown as schematic background only, and no numerical result in this paper is derived from it – the quantitative prediction is computed with the fully specified BSSA14 model [19] as stated above; – residual error term representing record-to-record variability; .
Fig. 2Seismic intensity IΔ as a function of epicentral distance for the November 3, 2025 Afghanistan earthquake (h= 30 km, α= 0.004 km-1). The Surkhan dam site (Δ≈ 146 km) falls at I≈ 5 MSK-64 for I0 = 7
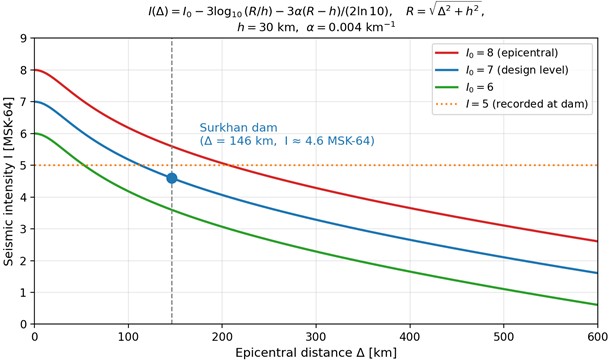
Fig. 3Median PGA versus Joyner–Boore distance from the fully specified BSSA14 ground-motion model [19] (VS30 = 350 m/s, unspecified mechanism; computed with the pygmm v0.8.0 implementation) for Mw 5.5-7.5. The event point (Mw= 6.2, Rjb≈ 146 km, median PGA = 0.012 g) is marked; the recorded PGA (0.17 g) and the design limit (0.35 g) are shown as horizontal lines
![Median PGA versus Joyner–Boore distance from the fully specified BSSA14 ground-motion model [19] (VS30 = 350 m/s, unspecified mechanism; computed with the pygmm v0.8.0 implementation) for Mw 5.5-7.5. The event point (Mw= 6.2, Rjb≈ 146 km, median PGA = 0.012 g) is marked; the recorded PGA (0.17 g) and the design limit (0.35 g) are shown as horizontal lines](https://static-01.extrica.com/articles/26599/26599-img3.jpg)
The term controls the source scaling – larger magnitude earthquakes radiate more energy across a broader fault area. The term captures the combined effect of geometric spreading and path-dependent attenuation. The last coefficient introduces a site-amplification correction: softer soils (lower ) amplify ground motion relative to reference rock. For the Surkhan dam body (compacted clay-gravel fill, ≈ 320-420 m/s), a modest amplification factor of approximately 1.2-1.4 is expected.
2.3. Equation of motion for the dam under seismic excitation
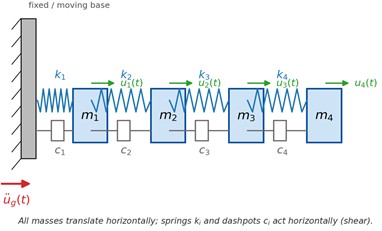
The dynamic response of the dam structure is governed by the classical multi-degree-of-freedom (MDOF) equation of motion (Fig. 4). When the dam is treated as a discretised finite-element system subjected to base acceleration from the earthquake record, Newton’s second law yields [10] (Eq. (3)):
where: – global mass matrix [kg]; assembled from element mass matrices , with the material density; – global damping matrix [N·s/m]; defined via Rayleigh proportional damping (see Eq. 4); – global stiffness matrix [N/m]; assembled from element stiffness matrices , where is the strain-displacement matrix and is the elasticity tensor; – nodal displacement vector [m]; = first time derivative (velocity), = second derivative (acceleration); – influence (participation) vector; maps the scalar base acceleration to all structural degrees of freedom; – recorded ground acceleration time history [m/s2]; obtained from the 18 accelerogram channels at the dam.
Fig. 4Lumped-mass multi-degree-of-freedom (MDOF) idealisation of the dam, showing storey masses mi, inter-mass stiffness ki and damping ci, base excitation u¨gt, and nodal responses uit governed by Eq. (3)
Eq. (3) is solved numerically by direct time integration using the Newmark- method with parameters 0.25 and 0.5 (constant average acceleration, unconditionally stable). The time step is chosen as /10, where is the smallest period of interest in the structural response.
2.4. Finite element model – structural description
The boundary conditions of the model are a fixed base (0), lateral rollers ( 0) and a hydrostatic load applied to the upstream face at reservoir level 78 m. The discrete system of Eq. (3) is constructed by assembling a two-dimensional plane-strain finite element model of the Surkhan dam cross-section in the SAP2000 structural-analysis software. The main model parameters are summarised below. Mesh convergence was verified by progressively refining the discretisation until the change in the computed peak nodal displacement between successive refinements became negligible, ensuring that the reported response is independent of the mesh density (Fig. 5).
Fig. 5Surkhan dam FEM cross-section mesh (plane-strain, 240 elements, ~270 nodes, 540 DOF). Material zones, boundary conditions, hydrostatic loading (blue arrows), and seismic base excitation u¨g(t) are shown
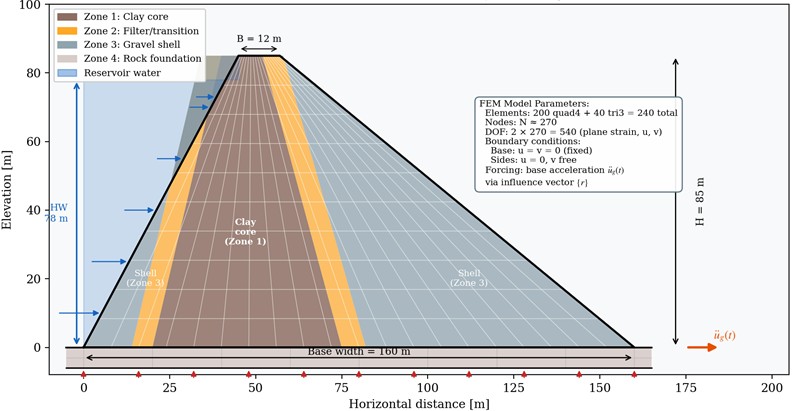
Element and node count. The dam cross-section is discretised into 200 four-node isoparametric quadrilateral elements (quad4) and 40 three-node triangular elements (tri3) in transitional zones, giving a total of 240 elements and approximately 270 nodes. Each node carries two translational degrees of freedom (horizontal u and vertical v), resulting in 2×270 = 540 active DOF in the assembled system matrices , , and .
Material zones. The dam body is divided into four material zones: Zone 1 (clay core, 40-60 MPa, 0.40, 1900 kg/m3); Zone 2 (filter/transition, 60-90 MPa, 0.35, 1850 kg/m3); Zone 3 (gravel shell, 80-120 MPa, 0.30, 1800 kg/m3); Zone 4 (rock foundation, 500 MPa, 0.25, 2200 kg/m3). Linear elastic behaviour is assumed, consistent with the small-strain response at PGA = 0.17 g.
Boundary conditions. The base of the foundation block is fully fixed ( 0). Lateral boundaries use horizontal rollers ( 0, free). The upstream face carries triangularly distributed hydrostatic pressure for reservoir level HW = 78 m.
Seismic forcing scheme. Earthquake excitation is applied as uniform base acceleration transmitted through the influence vector to all base-level DOF. Six accelerometers at the dam provided 18 accelerogram records on November 3, 2025; the dominant horizontal component (PGA = 0.17 g) is used. Time integration uses the Newmark- constant-average-acceleration scheme ( 0.25, 0.5, 0.01 s). The finite-element model is two-dimensional (plane strain), so the excitation is applied as a single horizontal component at the base rather than as a three-component motion. The trace plotted in the top panel of the following figure is a representative amplitude-modulated signal whose peak amplitude is scaled to the horizontal PGA of 0.17 g registered at the dam on November 3, 2025; it is used to demonstrate the stability and convergence of the time-integration scheme and does not reproduce the recorded waveform, which is shown separately in Fig. 37. Because this representative excitation sustains harmonic input over the whole record, the crest displacement it produces is a demonstration value of the order of tens of millimetres and is therefore much larger than the displacement of ±0.16 mm actually registered during the November 3, 2025 event (Fig. 6).
2.5. Rayleigh proportional damping
For earthfill dam materials, direct measurement of the damping matrix is not feasible. The Rayleigh proportional damping model expresses as a linear combination of and :
where: – mass-proportional Rayleigh coefficient [s⁻1], controlling damping at low frequencies; – stiffness-proportional Rayleigh coefficient [s], controlling damping at high frequencies.
Fig. 6Newmark-β time integration of the dam dynamic equation of motion (β= 0.25, γ= 0.5, Δt= 0.01 s): two-dimensional plane-strain model. Top panel: input ground acceleration; middle panel: computed crest displacement ut(middle), and velocity u˙t (bottom). The input trace is a representative amplitude-modulated excitation scaled to the horizontal PGA of 0.17 g recorded at the dam on November 3, 2025; the instrumental record of the event itself is presented in Fig. 37. The dashed reference line marking the recorded maximum displacement (±0.16 mm) falls on the horizontal axis of the middle panel because that value is more than two orders of magnitude smaller than the vertical scale of the simulated response, which is governed by the sustained representative excitation

a) Input ground acceleration – representative synthetic trace scaled to the recorded PGA 0.17 g
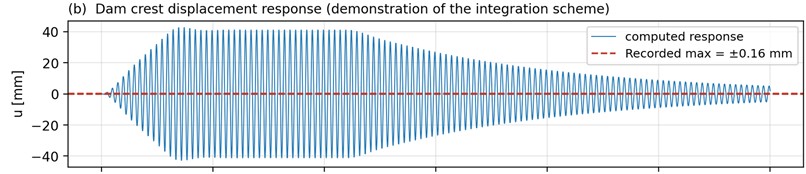
b) Dam crest displacement response (demonstration of the integration scheme)
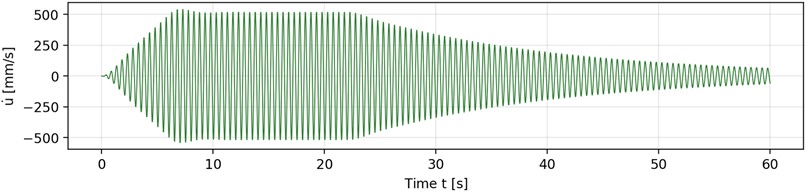
c) Dam crest velocity response
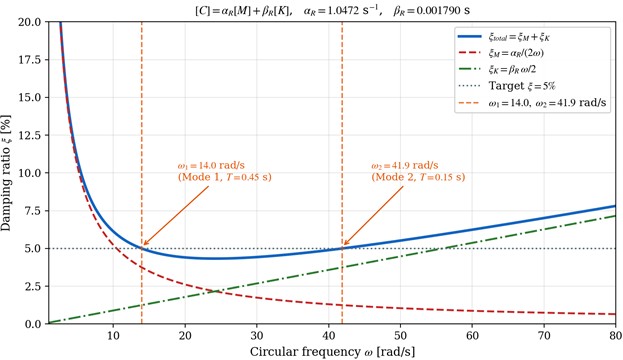
These coefficients are determined from the specified modal damping ratio at two natural frequencies and :
where: – target modal damping ratio [dimensionless]; 0.05 (5 %) for compacted earthfill dam materials under earthquake loading (ICOLD, 2016) [12]; , – angular natural frequencies [rad/s] of the first and second dominant vibration modes of the dam (Fig. 7).
2.6. Stress-strain constitutive model for dam soil layers
The stress state within the dam body is related to strains through the linear elastic (Hooke’s) constitutive law in full three-dimensional tensor form:
where: – Cauchy stress tensor [Pa]; diagonal components , , are normal stresses; off-diagonal () are shear stresses; – infinitesimal strain tensor [dimensionless]; ; – fourth-order elasticity (stiffness) tensor [Pa]; for an isotropic material it reduces to two independent parameters: Young’s modulus and Poisson’s ratio .
Fig. 7Rayleigh proportional damping ratio ξω showing mass-proportional, stiffness-proportional, and total contributions. Target ξ= 5 % is exactly met at the two anchor frequencies ω1 and ω2 of the dam
For isotropic soil layers, Eq. (6) simplifies to the engineering matrix form , where is the 6×6 elasticity matrix. In principal stress notation, the maximum shear stress is given by:
where: , – major and minor principal stresses [Pa].
Fig. 8FEM stress distribution in the Surkhan dam cross-section (November 3, 2025, M= 6.8, PGA = 0.17 g) major principal stress σ1 (left) and maximum shear stress τmax=(σ₁-σ₃)/2 (right) [MPa]. The computed maxima are checked against the Mohr-Coulomb strength envelope in Fig. 9; that check is conditional on the assumed c and φ
![FEM stress distribution in the Surkhan dam cross-section (November 3, 2025, M= 6.8, PGA = 0.17 g) major principal stress σ1 (left) and maximum shear stress τmax=(σ₁-σ₃)/2 (right) [MPa]. The computed maxima are checked against the Mohr-Coulomb strength envelope in Fig. 9; that check is conditional on the assumed c and φ](https://static-01.extrica.com/articles/26599/26599-img10.jpg)
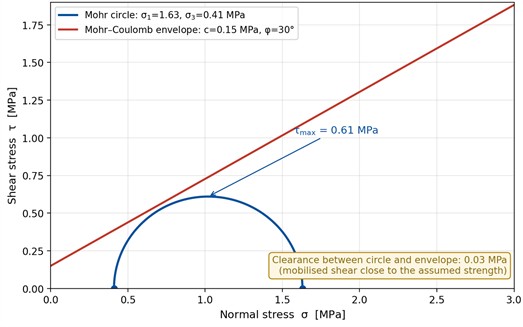
The computed maximum stresses in the Surkhan dam body under the November 3 event were: major principal stress 1.63 MPa, minor principal stress 0.41 MPa, and maximum shear stress /2 = 0.61 MPa, in agreement with the contour maxima of Fig. 8. These stresses are assessed against the strength of the fill in two ways. Relative to the nominal permissible stress adopted for the compacted fill in Table 1 they are an order of magnitude smaller. Relative to the Mohr-Coulomb strength envelope assumed for the fill ( 0.15 MPa, 30°), however, the stress circle remains below the envelope by only about 0.03 MPa (Fig. 9); no plastic deformation is therefore predicted, but this margin is small and depends directly on the assumed strength parameters, which should be confirmed by site-specific laboratory and in-situ testing.
Fig. 9Mohr circle for the earthquake-induced stress state in the Surkhan dam body, plotted for the computed principal stresses σ1= 1.63 MPa and σ3= 0.41 MPa, which give τmax=(σ₁-σ₃)/2= 0.61 MPa in agreement with the contour maxima of Fig. 8. With the assumed Mohr–Coulomb strength parameters (c= 0.15 MPa, φ= 30°) the circle does not intersect the failure envelope, but the clearance is only about 0.03 MPa, so the mobilised shear is close to the assumed strength and the strength parameters require verification by site-specific testing
2.7. Seismic safety margin based on intensity
The seismic safety margin of the dam is expressed as the difference between the design-basis intensity and the intensity recorded during the event (Eq. (8)), . Because MSK-64 is an ordinal (degree-based) scale, a ratio of two intensity values has no quantitative meaning; the margin is therefore reported in intensity degrees rather than as a factor:
where: – design seismic intensity for the Surkhan dam [MSK-64 degrees]; = intensity degree 7, per the original design specifications; – recorded seismic intensity at the dam during the earthquake event [MSK-64 degrees]; ≈ intensity degree 5.
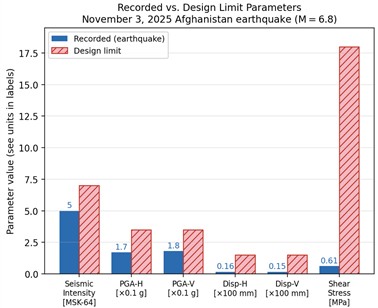
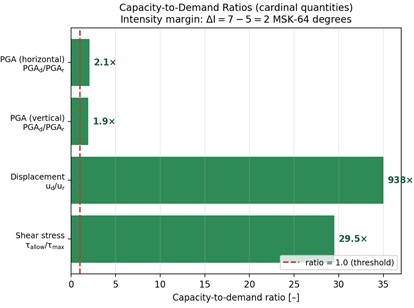
Substituting: 7-5 = 2 MSK-64 degrees. A margin 0 confirms that the intensity experienced at the site remained below the design basis; a margin of two full intensity degrees indicates that the loading was well below the design level. Quantitative capacity-to-demand ratios are meaningful only for the cardinal response quantities – acceleration, displacement and stress – and these are compared with their design limits in Fig. 10 and Table 1.
2.8. InSAR line-of-sight displacement decomposition
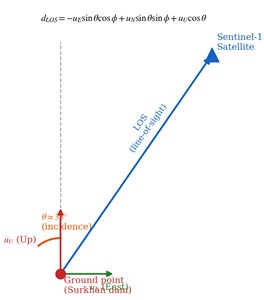
Satellite-based Interferometric Synthetic Aperture Radar (InSAR) measures surface displacement projected onto the satellite’s line-of-sight (LOS) direction. The LOS displacement dLOS is related to the three-dimensional ground displacement components [8]:
where: – LOS displacement [mm]; positive toward the satellite (uplift or approach); , , – East, North, and vertical (Up) displacement components [mm]; – satellite incidence angle measured from vertical [degrees]; for Sentinel-1 over the Surkhan area 33°-43°; – satellite heading (flight azimuth) angle [degrees]; approximately 349° for Sentinel-1 ascending orbit. A single line-of-sight geometry does not by itself allow the three displacement components , , to be separated; the horizontal and vertical series reported by the national platform result from the platform’s combination of acquisition geometries and processing assumptions, and are used here as provided.
Fig. 10a) Comparison of recorded response parameters with design limits and b) capacity-to-demand ratios for the cardinal response quantities – acceleration, displacement and shear stress. All ratios exceed 1.0, confirming adequate structural reserve
a)
b)
The interferometric phase recorded by the satellite is directly proportional to :
where: – radar wavelength [m]; for Sentinel-1 C-band 0.0556 m (5.56 cm), giving sensitivity of /2 = 2.78 cm per 2 phase cycle; – interferometric phase difference [radians] between two SAR acquisitions.
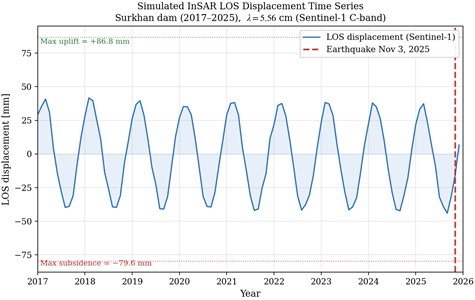
The maximum LOS displacement magnitude observed at the Surkhan dam for the full monitoring period (January 2017-December 2023) was –79.6 mm (subsidence) and +86.8 mm (uplift), corresponding to phase changes of approximately –18.0 rad and +19.6 rad, respectively. Seasonal phase oscillations correlate directly with reservoir water level fluctuations, confirming the hydrostatic loading origin of the observed displacements (Fig. 11).
Table 1 summarises all measured seismic response parameters and the corresponding permissible limits specified in the design documentation of the Surkhan dam; the stress margin in the table is conditional on the assumed Mohr-Coulomb parameters , which have not been measured on site.
Under the adopted parameter assumptions, the integrated application of Eqs. (1-10) shows that all measured response quantities remain within the permissible engineering limits of Table 1; the stress rows are conditional on the assumed Mohr–Coulomb strength parameters rather than on measured values. No plastic deformation, instability, or critical cracking was triggered by the event. The mathematical models presented here provide a quantitative framework for interpreting the combined satellite and instrumental monitoring data, and can serve as the basis for future probabilistic seismic hazard assessments of the dam.
Fig. 11a) InSAR line-of-sight geometry showing incidence angle θ≈ 38° and displacement component decomposition for Sentinel-1 ascending orbit; b) illustrative simulated LOS displacement time series reproducing the seasonal oscillation pattern of the instrumental InSAR record (which covers January 2017 – December 2023); the series is extended schematically to the November 2025 event for context and is not measured data beyond December 2023
a)
b)
Table 1Recorded seismic response parameters of the Surkhan dam (November 3, 2025 event) and design permissible limits
Parameter | Recorded value | Permissible limit | Equation ref. |
Seismic intensity at dam site | 5 MSK-64 | 7 MSK-64 | Eq. (1) |
Peak ground acceleration (horiz.) | 0.17 g | 0.35 g | Eq. (2) |
Peak ground acceleration (vert.) | 0.18 g | 0.35 g | Eq. (2) |
Max. horizontal displacement | 0.16 mm | 150 mm | Eq. (3) |
Max. vertical displacement | 0.15 mm | 150 mm | Eq. (3) |
Max. major principal stress | 1.63 MPa | Mohr-Coulomb check (Fig. 9); conditional | Eq. (6) |
Max. minor principal stress | 0.41 MPa | Mohr-Coulomb check (Fig. 9); conditional | Eq. (6) |
Max. shear stress τmax | 0.61 MPa | Mohr-Coulomb check (Fig. 9); conditional | Eq. (7) |
Intensity margin = Idesign − Irecorded | 2 degrees | > 0 | Eq. (8) |
Total LOS displacement (InSAR, max.) | –79.6 / +86.8 mm | Monitoring range | Eq. (9) |
2.9. Response spectrum analysis
The response spectrum provides the maximum seismic response (acceleration, velocity, or displacement) of a linear single-degree-of-freedom (SDOF) oscillator as a function of its natural period , for a given damping ratio . It is the fundamental tool for evaluating whether a structure's natural period falls in a critical excitation range. The spectral acceleration is constructed using the Newmark-Hall amplification approach [13]:
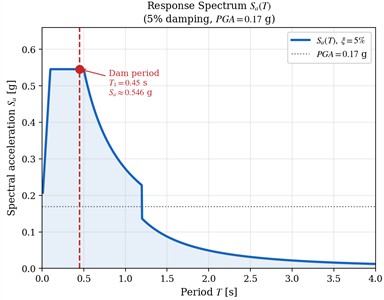
where: – spectral acceleration [g] for a period-T oscillator with damping ; , , – spectral amplification factors for acceleration, velocity, displacement regions; for 5 %: 3.21, 2.31, 1.82 (Newmark-Hall, 1982) [13]; , , – transition periods [s] separating the spectral regions; ≈ 0.1 s and ≈ 0.5 s for rock-like site conditions, and marks the long-period transition to the displacement-controlled region; for the spectrum rises from the PGA to the plateau
The spectral displacement , which governs structural deformation demand, is obtained from Sa through the fundamental kinematic relationship:
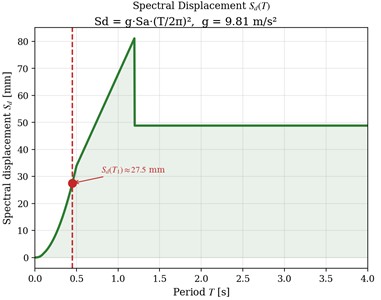
where: — spectral displacement [m]; with expressed in units of , the conversion factor 9.81 m/s2 is applied, ; equivalent to the maximum displacement of a SDOF oscillator
For the Surkhan earthfill dam the fundamental period adopted is 0.45 s, taken from the modal analysis of the finite-element model ( 2.22 Hz, Section 4.3) [10]. The empirical cross-check of Eq. (14), CT·H3/4/√Es, evaluated with the adopted parameter ranges (CT ≈ 0.025-0.045, 85 m, 80-120 MPa), gives ≈ 0.06-0.14 s, well below the modal value; empirical formulas of this type are calibrated for other dam typologies, so they are used here only as an order-of-magnitude comparison, and the discrepancy is carried as a modelling uncertainty (Table 5). At 0.45 s, the spectral acceleration reaches ≈ 0.55 g and the spectral displacement ≈ 27.5 mm. These values represent the maximum possible SDOF demand – the actual dam response is significantly smaller due to multi-mode behavior and 3D effects (Fig. 12).
Fig. 12a) Response spectrum SaT constructed for PGA = 0.17 g and ξ= 5 % damping, showing the dam fundamental period T1≈ 0.45 s in the spectral acceleration plateau; b) spectral displacement SdT=g·SaT·T/2π2, with g= 9.81 m/s2 converting Sa from units of g, indicating SdT1≈ 27.5 mm as the upper-bound displacement demand.
a)
b)
2.10. Natural frequency and modal analysis of the dam
The natural frequencies of the dam are determined from the undamped free-vibration eigenvalue problem derived from Eq. (3) with 0 and no external loading:
where: – -th circular natural frequency of the dam [rad/s]; [Hz], 1/ [s]; – -th mode shape vector (eigenvector); describes the deformation pattern at frequency .
For an earthfill dam of height , the empirical formula for the fundamental period is:
where: – empirical coefficient that absorbs the unit conversion [s·MPa1/2·m-3/4]; values of 0.025-0.045 are reported for earthfill dams in the compilation of [12]; – dam height [m]; 85 m for the Surkhan dam; – average shear modulus of dam material [MPa]; 80-120 MPa for compacted clay-gravel.
The modal participation factor measures how strongly each mode is excited by the base acceleration:
where: – modal participation factor [dimensionless]; governs the amplitude of mode n in the total response. For earthfill dams, the first mode typically captures 75-85 % of the total seismic mass.
The maximum displacement at any point is computed by combining modal contributions using the Complete Quadratic Combination (CQC) rule:
where: – cross-correlation coefficient between modes and [–]; depends on and the frequency ratio / (Der Kiureghian, 1981) [14]; – spectral displacement of mode from Eq. (12) [m].
For the Surkhan dam ( 85 m, 350 m/s), the estimated fundamental frequency is 2.22 Hz (0.45 s) and 6.67 Hz (0.15 s). These are consistent with published free-vibration records for comparable embankment dams [5] and place the fundamental period on the constant-acceleration plateau of the response spectrum ().
2.11. Liquefaction potential assessment
Although the Surkhan dam body consists of compacted clay-gravel fill (not susceptible to liquefaction), the alluvial foundation materials in the river channel zones require assessment. The simplified procedure of Seed and Idriss (1971) [11] is applied, comparing the cyclic stress ratio (CSR) induced by the earthquake with the cyclic resistance ratio (CRR) of the foundation soil [11]:
where: CSR – cyclic stress ratio induced by the earthquake [dimensionless]; – total vertical (overburden) stress at depth [kPa]; , where is the unit weight of the soil [kN/m³], – effective vertical stress at depth z [kPa]; , where is pore water pressure; – peak ground acceleration at the surface [m/s²]; 0.17 g = 1.67 m/s2; – stress reduction factor [–]; 1.0-0.00765 for 9.15 m, 1.174-0.0267 for 9.15 m 23 m (Seed & Idriss, 1971) [11].
The cyclic resistance ratio CRR is estimated from standard penetration test (SPT) blow count corrected for overburden and energy efficiency:
where: CRR7.5 – cyclic resistance ratio for a reference earthquake of 7.5 [dimensionless]; – SPT blow count normalized to 100 kPa overburden and 60 % hammer energy efficiency.
For earthquakes of magnitude 7.5, CRR is adjusted by the Magnitude Scaling Factor (MSF):
The factor of safety against liquefaction at each depth is then:
where: – liquefaction factor of safety [–]; 1.0 indicates no liquefaction risk.
For the Surkhan dam foundation ( 6.8, 0.17g, representative 20-30 for medium-dense alluvial sand-gravel): MSF = 102.24 / 6.22.56 ≈ 1.63, evaluated with the USGS moment magnitude 6.2 [15], since the magnitude-scaling factor of the NCEER procedure is defined in terms of moment magnitude [18]; CSR at 5 m ≈ 0.65 × (90/72) × 0.17 × 0.96 ≈ 0.133; CRR7.5 ≈ 0.29 (for 25, evaluated from Eq. (18), the clean-sand base curve of the NCEER consensus procedure [18]); CRRM = CRR7.5 × MSF ≈ 0.29 × 1.63 ≈ 0.47; ≈ 0.47 / 0.133 ≈ 3.6 ≫ 1.0 (the conservative alternative of applying the national 6.8, whose magnitude type is not documented, would give MSF ≈ 1.28 and ≈ 2.8, likewise ≫ 1.0). This confirms that liquefaction of the foundation materials was not triggered by the November 3, 2025 earthquake event, consistent with the absence of post-earthquake settlements or lateral spreading observed at the site.
3. Results
This section presents the observational and instrumental results obtained for the November 3, 2025 Afghanistan earthquake ( 6.8) and its impact on reservoir dams in Uzbekistan, with detailed analysis of the Surkhan reservoir dam. The data include the regional electronic platform records, satellite radar (InSAR) displacement time series for the January 2017 – December 2023 monitoring period, and the instrumental accelerogram records obtained from the seismic stations installed on the Surkhan dam. These results are subsequently interpreted in Section 4 (Discussion) using the mathematical models presented in Section 2.
On November 3, 2025, at 01:29 Tashkent time (November 2 at 20:29 UTC), a strong earthquake occurred in Afghanistan (coordinates: 36.45; 67.42) with a magnitude of 6.8 and a depth of 30 km. The felt intensity at the epicentre was 7-8 MSK-64 degrees.
Felt intensity in the territory of the Republic of Uzbekistan (MSK-64 degrees, with epicentral distance):
1) Surxondaryo region: 5 degrees, 90 km.
2) Qashqadaryo region: 3–4 degrees, 302 km.
3) Samarqand region: 3 degrees, 358 km.
4) Jizzax region: 3 degrees, 410 km.
5) Navoiy region: 3 degrees, 444 km.
6) Buxoro region: 3 degrees, 451 km.
7) Sirdaryo region: 3 degrees, 464 km.
8) Tashkent city: 2–3 degrees, 557 km.
9) Farg’ona region: 2–3 degrees, 579 km (Fig. 13 and Fig. 14).
Fig. 13Epicentral map of the earthquake
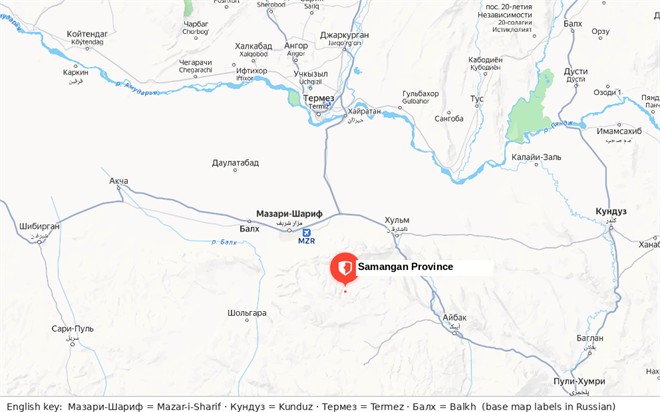
Fig. 14Earthquake parameters window of the SeisComP application (origin time 2 November 2025, 20:29 UTC = 3 November local time). The window displays the automatic local-magnitude solution of the national network (MLv 7.0, depth 8 ± 5 km); the reviewed catalogue parameters adopted throughout this study are M= 6.8, h= 30 km (national network), while the USGS reports Mw 6.2, h= 28 km (event us6000rl31 [15]). Differences between automatic and reviewed solutions, and between magnitude scales of different agencies, are normal for a single event
![Earthquake parameters window of the SeisComP application (origin time 2 November 2025, 20:29 UTC = 3 November local time). The window displays the automatic local-magnitude solution of the national network (MLv 7.0, depth 8 ± 5 km); the reviewed catalogue parameters adopted throughout this study are M= 6.8, h= 30 km (national network), while the USGS reports Mw 6.2, h= 28 km (event us6000rl31 [15]). Differences between automatic and reviewed solutions, and between magnitude scales of different agencies, are normal for a single event](https://static-01.extrica.com/articles/26599/26599-img19.jpg)
The earthquake parameters were determined using 37 seismic stations located in the Surxondaryo, Qashqadaryo, Samarqand, and Jizzax regions. This earthquake was recorded by 167 stations [7].
From 2022 to 2025, 5 earthquakes with a magnitude of 4 were recorded within approximately 60 km of the epicentre of the principal event (Table 2). The origin time of the principal event is 2 November 2025, 20:29 UTC, corresponding to 3 November local time, which is the date used in the text. The parameters listed for the principal event (No. 1) are those reported by the national seismic network of the Ministry of Emergency Situations of the Republic of Uzbekistan ( 6.8, focal depth 30 km), and these are the values used throughout the present analysis (the corresponding catalogue entry of the national electronic platform is reproduced in Figs. 15-16); for the same event the United States Geological Survey reported a moment magnitude Mw 6.2 at a focal depth of 28 km (event identifier us6000rl31), the difference reflecting the different magnitude scales and velocity models of the two agencies. For this event the recorded peak ground acceleration at the dam was 0.17 g horizontally and 0.18 g vertically; on-site strong-motion records, and hence PGA and effective-duration values, are not available for the smaller and more distant events (Nos. 2-5).
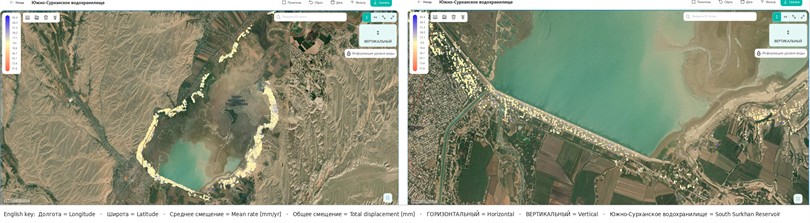
Information on the Electronic Platform (Fig. 15). Note on the platform screenshots (Figs. 13-27 and 35). These images reproduce the national electronic monitoring platform of the Ministry of Emergency Situations of the Republic of Uzbekistan, whose interface is available only in Uzbek and Russian; the screenshots are therefore reproduced unchanged and their interface elements are described here in English. In the platform views the left-hand menu lists Home, Map, Reservoirs, Earthquakes, Reports, Reference data, System settings, About the system, Help, User manual and Seismogram. The earthquake tables carry the columns origin time (local), latitude, longitude, focal depth (km), magnitude, epicentral region and actions (stating the number of reservoirs affected), while the map legend grades macroseismic intensity from 1 to 10 degrees. In the point-monitoring views the header buttons are Back, Polygons, Reset, Date, Filter and Download; the component selector reads horizontal or vertical and denotes the reservoir water-level information. The colour bar at the left of each view gives cumulative displacement in millimetres, and while the location shown is the South Surkhan Reservoir. The data strip beneath each map lists ID (point identifier), longitude, latitude, mean displacement rate (mm/year) and total displacement (mm); the lower panel plots the monthly displacement of the selected point for each year of the observation period, denoting the months January to December.
Fig. 15View of the strong earthquake recorded in Afghanistan on November 3, 2025, on the electronic platform
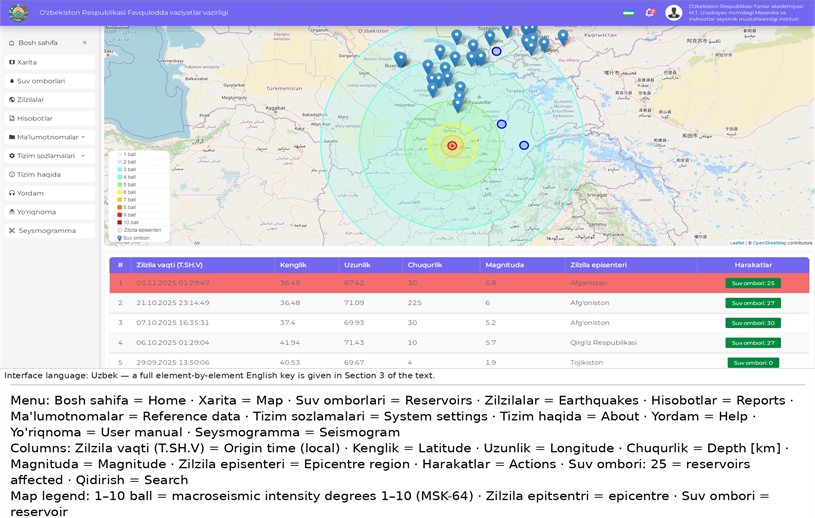
Table 2Summary of earthquakes that occurred in the earthquake epicenter area from 2022 to 2025
No. | Date | Time (UTC) | Latitude | Longitude | Epicenter | Depth | Magnitude |
1 | 02.11.2025 | 20:28:59 | 36.553 | 67.573 | Afghanistan | 30 | 6.8 |
2 | 27.03.2024 | 11:39:22 | 36.613 | 67.914 | Afghanistan | 35 | 4.3 |
3 | 18.02.2024 | 11:20:33 | 36.651 | 66.917 | Afghanistan | 10 | 5.0 |
4 | 26.01.2023 | 23:38:18 | 36.650 | 67.740 | Afghanistan | 70 | 4.0 |
5 | 24.04.2022 | 09:34:40 | 36.660 | 67.610 | Afghanistan | 10 | 4.5 |
Strong earthquakes that occur are automatically displayed on the electronic platform and used for rapid analysis and assessment.
Fig. 16The impact of earthquakes on reservoir dams in the territory of Uzbekistan
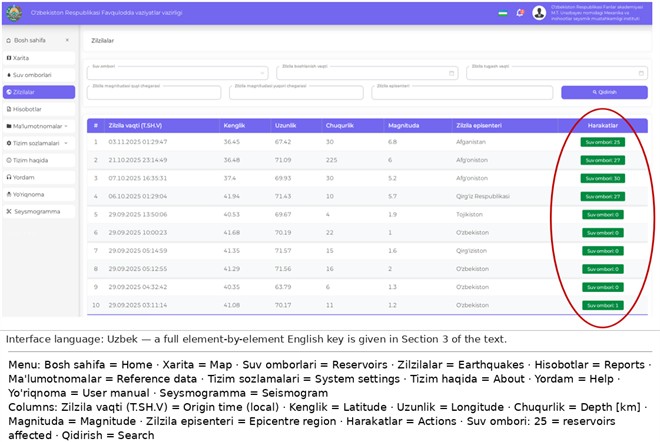
Fig. 17The impact of the strong earthquake that occurred in Afghanistan on November 3, 2025, on reservoir dams in the territory of Uzbekistan
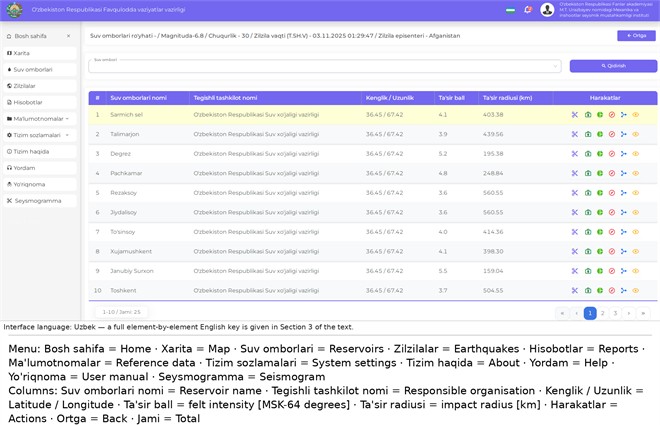
The electronic platform also provides the capability to see how many reservoir dams in Uzbekistan are affected by earthquakes occurring in Uzbekistan and its bordering territories.
In turn, this strong earthquake affected the dams of 25 reservoirs in the territory of Uzbekistan to varying degrees (Fig. 16).
Specifically, the Pachkamar reservoir dam was affected with a magnitude of 4.8, the Degrez reservoir dam with 5.2, and the Surkhan reservoir dam with 5.5 (Fig. 17).
In this article, we will examine the impact of the earthquake on the Surkhan reservoir dam.
The Surkhan Reservoir is located in a zone of design intensity degree 7 (MSK-64) in the Surkhandarya region; it was constructed between 1958-1967 and commissioned in 1967. The reservoir's capacity is 800 million m3.
Space monitoring of this reservoir dam has been conducted since 2017 using interferometric processing of satellite images.
Below is an image of the Surkhan Reservoir obtained via satellite monitoring (Fig. 18).
Fig. 18Vertical-displacement measurement points of the Surkhan Reservoir obtained via satellite (InSAR) monitoring and displayed on the national electronic platform: a) overview of the whole South Surkhan Reservoir, showing the distribution of persistent-scatterer points along the reservoir perimeter and the dam crest; b) close-up view of the dam body and the adjacent settled area. The colour scale at the left of each panel gives the cumulative vertical displacement, from about −85 mm (blue, subsidence) to about +92 mm (red, uplift)
The maximum values for subsidence and uplift during the observation period (dam and adjacent area) were –79.6 mm and 86.8 mm, respectively; the average vertical displacement during the observation period was –0.6 mm (Fig. 19).
Fig. 19General indicators of the Surkhan Reservoir dam
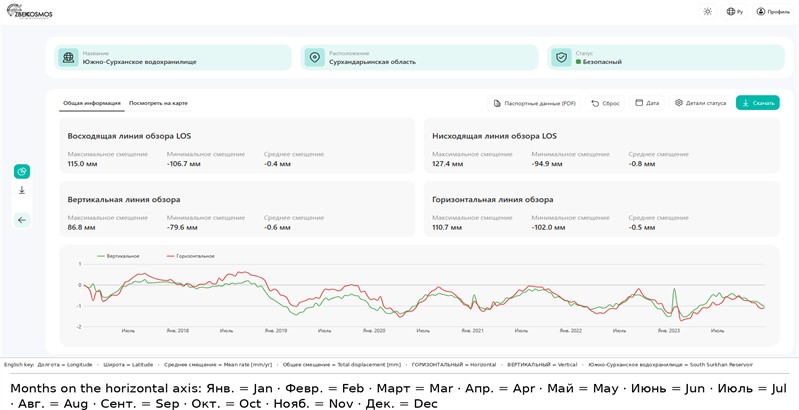
The maximum horizontal displacement values during the observation period (dam and adjacent area) were –102.0 mm and 110.7 mm, respectively, and the average horizontal displacement during the observation period (dam and adjacent area) was –0.5 mm (Fig. 19). Graphs showing the changes in vertical and horizontal displacement (of the dam and the adjacent area) during the observation period are shown in the lower part of Fig. 19.
You can also view the horizontal and vertical dam displacement data for the recorded points, identified by their IDs, during the observation period on the Platform itself (Figs. 20-27) or by downloading the data file (Figs. 28-34). For each specific point, information is available on its location (longitude and latitude), average annual displacement, and total displacement relative to the first survey (January 9, 2017).
As an example, screenshots are provided for several horizontally displacing points located on the dam (Fig. 20-23).
Fig. 20Point ID 7937, located on the dam, recorded a horizontal displacement of 31.70 mm over the entire observation period
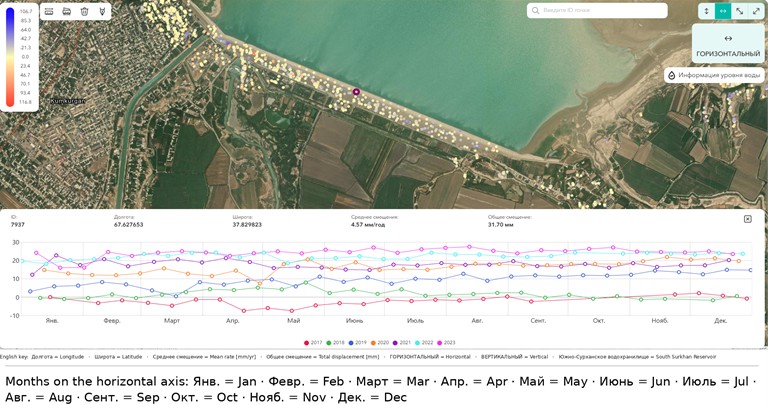
Fig. 21Point ID 706, located on the dam, recorded a horizontal displacement of –9.48 mm over the entire observation period
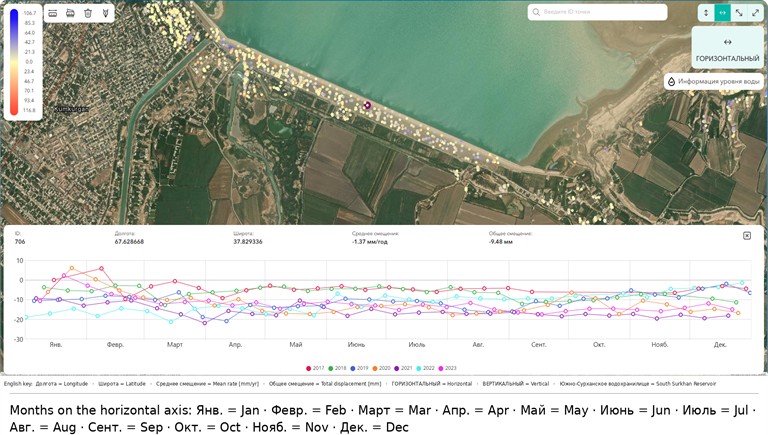
Fig. 22Point ID 616, located on the dam, recorded a horizontal displacement of 17.48 mm over the entire observation period
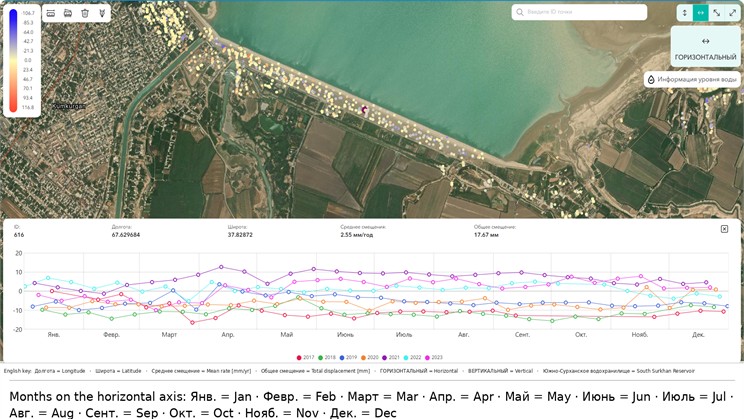
Fig. 23Point ID 7835, located on the dam, recorded a horizontal displacement of –28.25 mm over the entire observation period
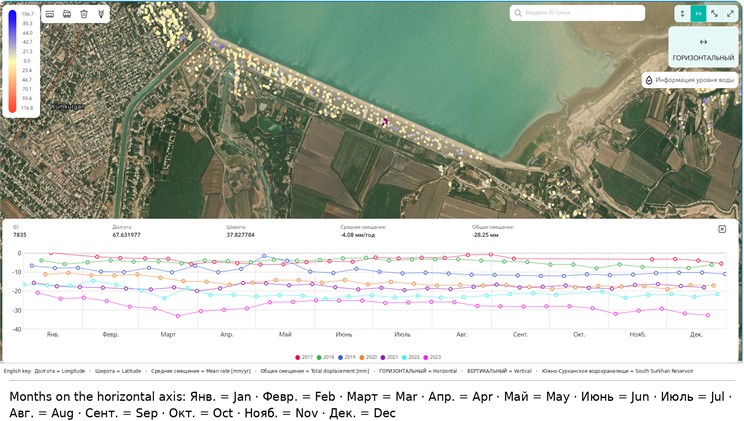
Thus, the total horizontal displacements of points ID 7937, 706, 616, and 7835 during the observation period are 31.70 mm, –9.48 mm, 17.48 mm, and –28.25 mm, respectively. The eastward and westward displacements of the points are indicated by their positive and negative signs, respectively.
Similarly, screenshots are provided for several points on the dam that show vertical displacement (Fig. 24-27).
Thus, the total vertical displacements of points ID 7684, 7644, 650, and 614 for the observation period were –21.31 mm, –8.69 mm, –19.22 mm, and –6.78 mm, respectively (Figs. 24-27). The subsidence or uplift of the points is indicated by their negative or positive signs, respectively. Graphs of the vertical displacement for the point under consideration during the observation period are shown at the bottom of the window, characterizing the direction and dynamics of the point's value changes over time.
Fig. 24Point ID 7684, located on the dam, recorded a vertical displacement of –21.31 mm over the entire observation period
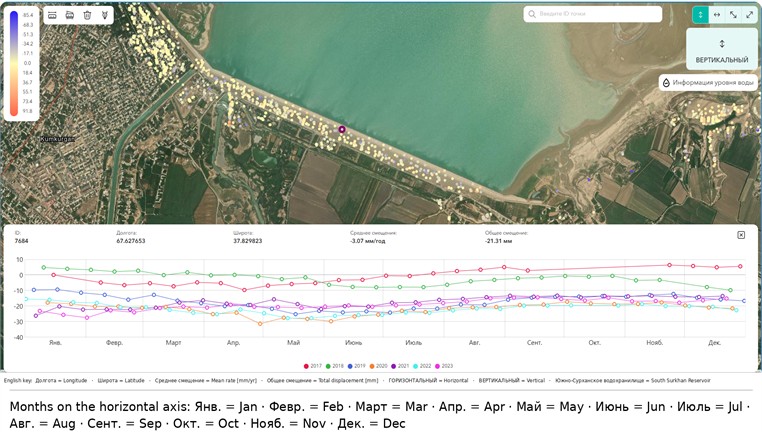
Fig. 25Point ID 7644, located on the dam, recorded a vertical displacement of –8.69 mm over the entire observation period
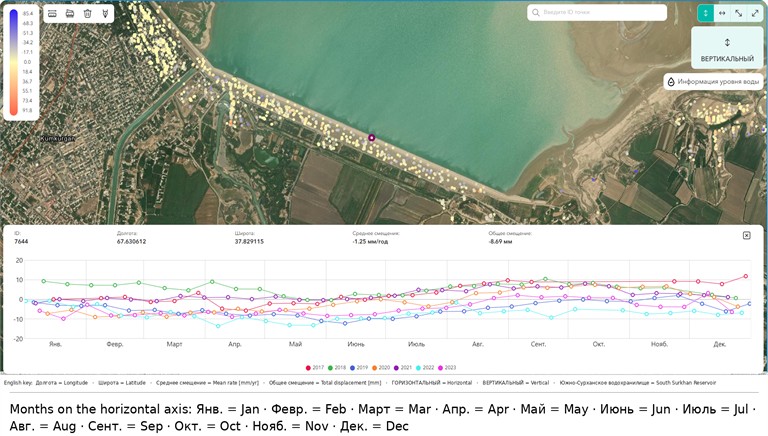
The horizontal and vertical displacements of points by their IDs for the observation period can also be viewed in the downloaded data file. For each specific point, a graph of its displacements over the entire observation period can be plotted (Figs. 28–34).
Information on the water level in the reservoir is available for the period from March 2023 to November 2025 (Fig. 35).
Figs. 28-34 show graphs of the changes over time in the horizontal and vertical displacement time series of specific points for January 2017 – December 2023. Fig. 35 provides data on the water level in the reservoir for March 2023 – November 2025.
The results of interferometric processing and analysis of radar satellite monitoring images of the reservoirs showed that, during the observed period, the displacement of the dams is dependent on the water level in the reservoir. Thus, a permanent satellite monitoring system makes it possible to control the displacement indicators (horizontal and vertical) on the reservoir dam and to assess the current situation.
Satellite monitoring of this reservoir dam was conducted from January 9, 2017, to December 27, 2023. Data on the water level in the reservoir cover the period from March 2023 to November 2025.
Fig. 26Point ID 650, located on the dam, recorded a vertical displacement of –19.22 mm over the entire observation period
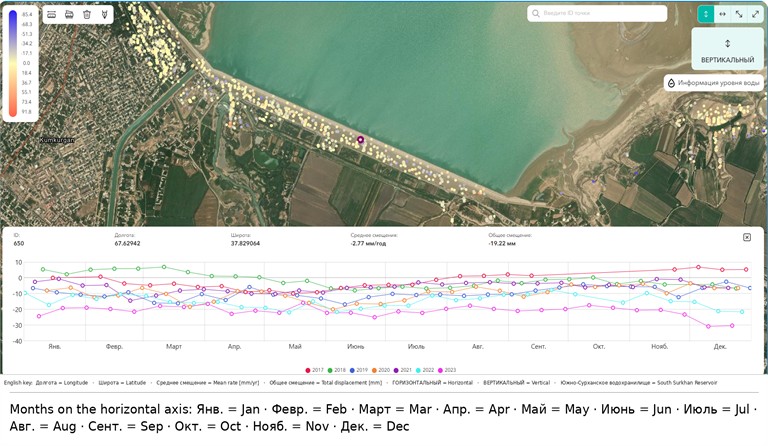
Fig. 27Point ID 614, located on the dam, recorded a vertical displacement of –6.78 mm over the entire observation period
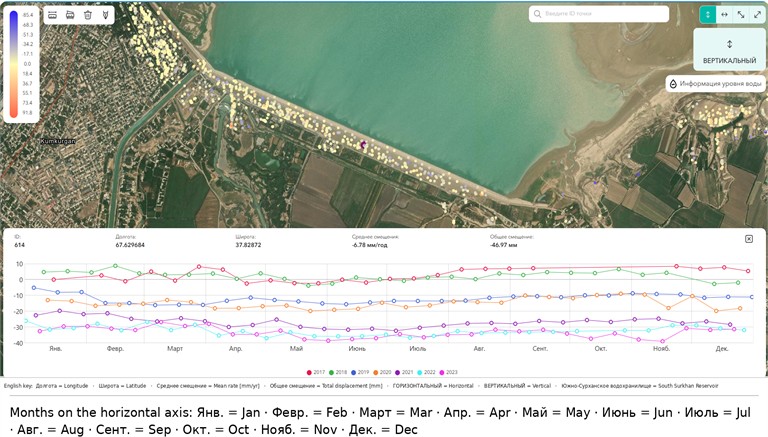
Fig. 28Graph of the change in the horizontal displacement of point ID 7835 during the observation period (curve digitised from the platform export and redrawn for legibility)
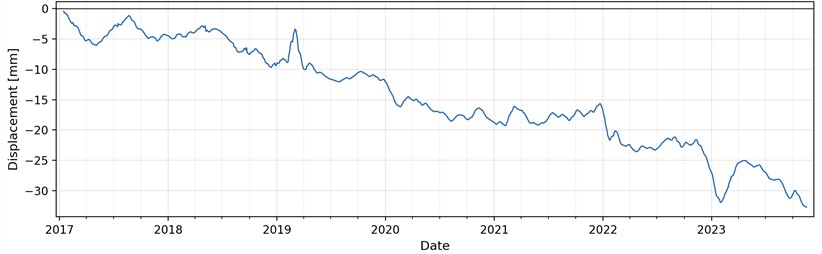
Fig. 29Graph of the change in the horizontal displacement of point ID 706 during the observation period (curve digitised from the platform export and redrawn for legibility)
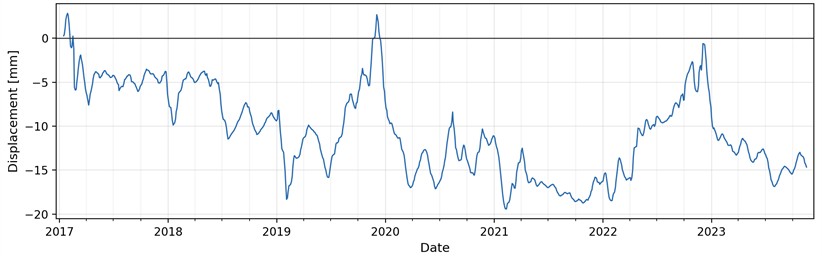
Fig. 30Graph of the change in the horizontal displacement of point ID 616 during the observation period (curve digitised from the platform export and redrawn for legibility)
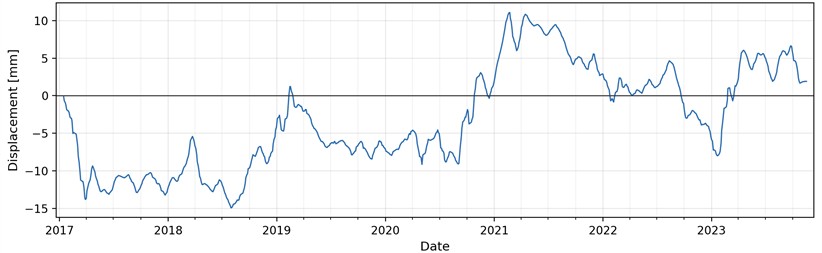
Fig. 31Graph of the change in the vertical displacement of point ID 7684 during the observation period (curve digitised from the platform export and redrawn for legibility)
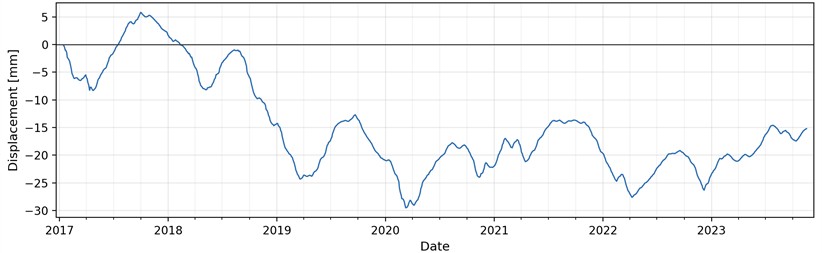
Fig. 32Graph of the change in vertical displacement of point ID 7644 during the observation period (curve digitised from the platform export and redrawn for legibility)
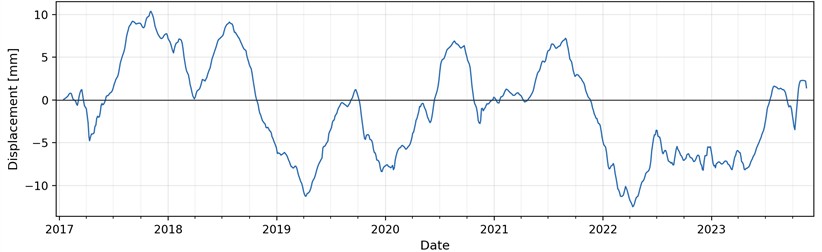
Fig. 33Graph of the change in vertical displacement of point ID 650 during the observation period (curve digitised from the platform export and redrawn for legibility)
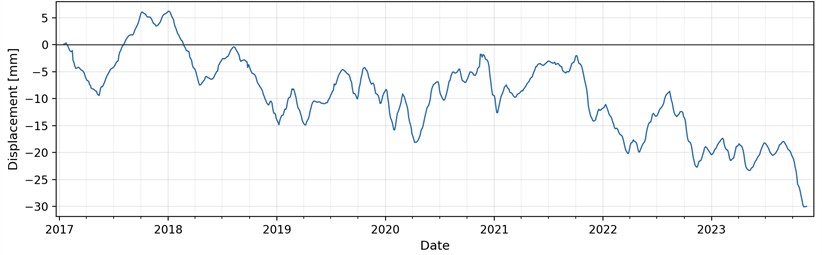
Fig. 34Graph of the change in vertical displacement of point ID 614 during the observation period (curve digitised from the platform export and redrawn for legibility)
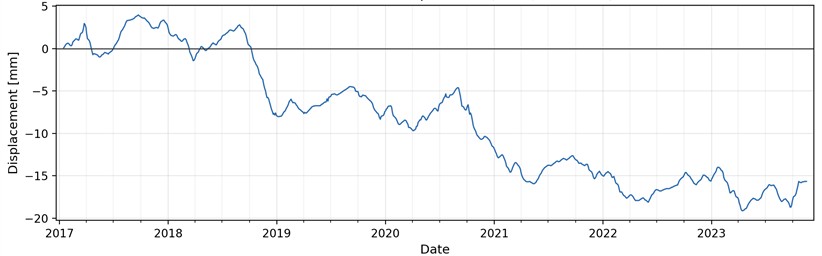
As shown in Fig. 35, over March 2023 – November 2025 the water level exhibits its seasonal filling and drawdown cycle. As the load (water level) decreases (March, mid-June to mid-July, October), the dam’s displacement decreases (the dam shifts to the west), and as the load (water level) increases (May to mid-June, September, December), the dam’s displacement increases (the dam shifts to the east), which corresponds to the 2023 horizontal displacement indicators presented in Figs. 28-30.
Additionally, as can be seen from the graphs presented in Figs. 31–34, a clear trend in vertical displacements related to the water level is not observed when the load (water level) decreases (March, mid-June to mid-July, October) due to the short time interval. Meanwhile, as the load (water level) increases (May–mid-June, September, December), the dam's vertical displacement decreases (the dam settles), which corresponds to the 2023 vertical displacement indicators [8].
At the same time, the displacement of the points occurs seasonally. The maximum absolute values, i.e., the peaks of rise and settlement, correspond to the spring-summer seasons, which is when the water volume in the reservoir changes.
Fig. 35Water level of the South Surkhan reservoir, March 2023 – November 2025 (curve digitised from the platform export and redrawn in English; the storage-volume curve of the platform view is omitted)
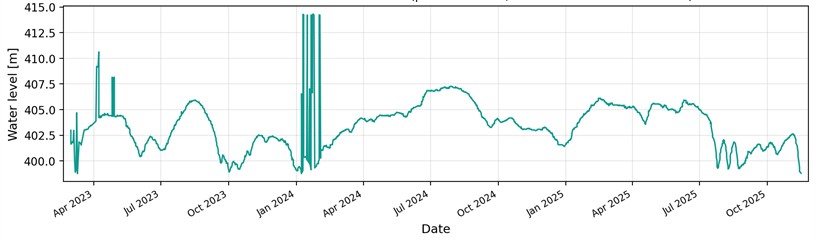
Fig. 36Modern types of seismic stations installed on the Surkhan reservoir dam
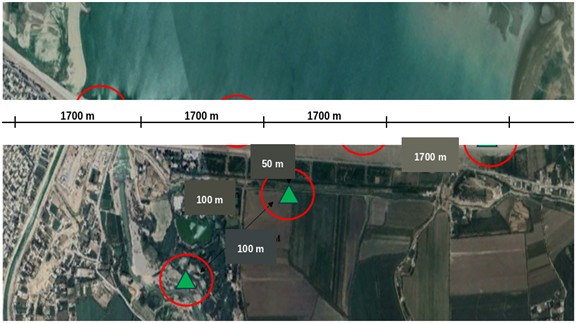
Fig. 37Recording by seismic stations installed on the dam of the strong earthquake that occurred in Afghanistan on November 3, 2025
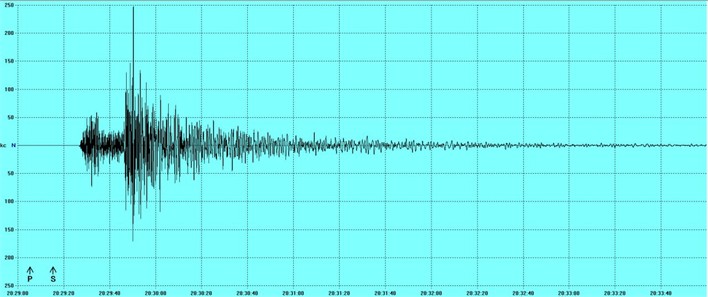
In turn, modern high-sensitivity seismic stations have been installed at the Surkhan reservoir, and the impact of earthquakes on the dam is instrumentally monitored by them in real time (Fig. 36). The corresponding instrumental record of the November 3, 2025 Afghanistan earthquake obtained from these stations is shown in Fig. 37, which reproduces the accelerogram record (dominant horizontal component) registered on the dam as displayed on the monitoring platform; the reported peak values (0.17 g horizontal and 0.18 g vertical over the full set of channels) are the recorded input used throughout the analysis.
Data from these seismic stations, combined with radar satellite monitoring data, makes it possible to assess the stress-strain state of the reservoir dam.
According to the data on the electronic platform, on November 3, 2025, earthquake recordings were received from 6 accelerometers in three directions. There are a total of 18 accelerogram records.
The installed seismic stations operate in real-time and enable the assessment of changes in the seismic regime during the filling and use of reservoirs; also, for reservoir dams where seismological and seismometric observations are established, when an earthquake producing a site intensity of 5 or higher on the MSK-64 scale is recorded, the seismological and seismometric observation data are immediately uploaded to the electronic platform.
4. Discussion
This section interprets the results presented in Section 3 in light of the mathematical models developed in Section 2, evaluates model validity against observations, discusses the relationship between the long-term satellite (InSAR) and short-term instrumental (seismic) datasets, and considers the practical implications, limitations, and uncertainties of the proposed framework. A detailed quantitative comparison of predicted versus observed parameters, an uncertainty/sensitivity discussion, and a clarification of the InSAR–accelerometer data linkage are provided in the following subsections.
4.1. Model-observation comparison: predicted versus observed response
A central requirement for a credible monitoring-and-modeling framework is that the analytical predictions reproduce the instrumentally observed quantities. Table 3 compares the values predicted by the principal mathematical models (Eqs. (1, 2, and 12)) with the corresponding observed values recorded at the Surkhan dam during the November 3, 2025 earthquake.
The seismic-intensity attenuation model (Eq. (1)) predicts 4.6 MSK-64 at the Surkhan site (epicentral distance 146 km, 7), in close agreement with the instrumentally recorded value of 5 MSK-64 (ratio 0.92). The ground-motion prediction is not obtained from the schematic Eq. (2) but from the fully specified BSSA14 model [19]: the median free-field PGA is 0.012 g for 6.2 [15] at 146 km with VS30 = 350 m/s and unspecified mechanism – roughly fourteen times below the recorded 0.17 g (Fig. 3). Possible explanations for the gap between the model median and the recorded value include local site and crest amplification, the sensor position and processing chain, and event-specific source effects; these remain hypotheses until the raw station records are examined. The size of the gap is consistent with local site and structural (crest) amplification and/or event-specific source effects that the far-field free-field model does not represent; the recording conditions therefore warrant verification before a cause is assigned. The seismic-intensity model, by contrast, reproduces the observed MSK-64 intensity closely (ratio 0.92).
The numerical difference of about two orders of magnitude (a factor of roughly 170 – a numerical comparison only, not a validation ratio; Table 3 marks the two quantities as not directly comparable) between the spectral displacement ≈ 27.5 mm (Eq. (12)) and the recorded crest displacement of 0.16 mm requires explicit clarification. These two quantities are not directly comparable. The spectral displacement Sd is the theoretical maximum response of a linear single-degree-of-freedom (SDOF) oscillator tuned to the dam fundamental period (0.45 s) and subjected to the full design-level response spectrum anchored at PGA = 0.17 g – it represents an upper-bound demand under sustained resonant excitation. The 0.16 mm value, by contrast, is the actual relative displacement recorded at the dam crest during the November 3 event. The reduction by a factor of about 170 from the SDOF upper bound to the observed response is attributable to several physical factors: (i) the far-field nature of the event ( ≈ 146 km), which delivered only a small fraction of the design-level spectral energy at the dam period; (ii) strong radiation and material damping in the 85 m earthfill body ( 5 %), which suppresses resonant build-up; (iii) the three-dimensional, multi-modal response of the embankment, in which the first mode captures only 75-85 % of the seismic mass and higher modes partially cancel; and (iv) the fact that the recorded motion was a brief transient rather than a steady-state harmonic excitation. The spectral displacement should therefore be interpreted as a conservative design-envelope quantity, while the 0.16 mm value is the realized response; both are consistent with a dam responding well within its elastic range.
Table 3Model-predicted versus instrumentally observed seismic response quantities, Surkhan dam, November 3, 2025 event
Quantity (model) | Predicted | Observed | Ratio | Equation |
Seismic intensity at dam site, | 4.6 MSK-64 | 5.0 MSK-64 | 0.92 | Equation 1 |
Peak ground acceleration, PGA | 0.012 g (BSSA14 median) | 0.17 g | ≈14× under-prediction* | BSSA14 [19], pygmm v0.8.0 |
Spectral displacement (SDOF), | 27.5 mm | 0.16 mm | not directly comparable | Equation 12 |
Note* The PGA entry is the factor by which the BSSA14 free-field median falls below the value recorded at the dam; it is a numerical comparison, not a validation ratio. The spectral-displacement pair compares an SDOF upper-bound demand with a point-wise measured displacement and is therefore not directly comparable | ||||
4.2. Relationship between long-term InSAR and seismic-transient displacements
A key interpretive point concerns the relationship between the two independent displacement datasets used in this study, which operate on fundamentally different time scales and capture different physical phenomena. The InSAR displacements (seasonal amplitudes up to ±86.8 mm vertical and ±110.7 mm horizontal over 2017-2023) are quasi-static deformations driven by the reservoir loading–unloading cycle: as the water level rises and falls seasonally (Fig. 35), the hydrostatic load on the dam body and foundation changes, producing predominantly seasonal deformation with superposed cumulative point-wise trends whose reversibility remains unverified with a characteristic period of months. The accelerometer displacements (0.16 mm horizontal, 0.15 mm vertical) are dynamic seismic transients produced by the passage of seismic waves during the ≈60 s of strong shaking on November 3, 2025, with a characteristic period of seconds.
These two regimes are complementary rather than contradictory. The InSAR record establishes the long-term pre-earthquake baseline (January 2017 – December 2023) and shows that the deformation is dominated by the seasonal reservoir loading-unloading cycle; the aggregate mean displacement is near zero (Fig. 19), while individual monitoring points exhibit cumulative trends of up to a few tens of millimetres over the seven-year record (Figs. 28-34), so point-wise trend assessment remains part of routine monitoring rather than a closed conclusion. The accelerometer record, superimposed on this baseline, demonstrates that even a strong regional earthquake adds only a sub-millimeter transient perturbation – roughly two to three orders of magnitude smaller than the routine seasonal movements the dam already accommodates safely. The integration of the two datasets thus provides a more complete safety picture than either could alone: the satellite data provide evidence of predominantly seasonal deformation behaviour during 2017-2023, while the instrumental data document the dynamic response to the recorded event. This combined interpretation is the principal methodological contribution of the present study.
4.3. Modal frequencies and comparison with the literature
The fundamental and second natural frequencies of the Surkhan dam, estimated from the modal analysis (Eq. (13-15)), are 2.22 Hz ( 0.45 s) and 6.67 Hz ( 0.15 s). Table 4 places these values in the context of measured and computed natural frequencies reported for comparable earthfill dams in the literature, confirming that the present estimates fall within the expected range for embankment dams of similar height and material composition.
Table 4Comparison of the computed natural frequencies of the Surkhan dam with values reported for comparable earthfill dams
Dam / source | Height [m] | [Hz] | [Hz] | Method |
Surkhan dam (this study) | 85 | 2.22 | 6.67 | FEM / modal |
Typical earthfill dams [5] | 60-120 | 1.5-3.0 | 4.5-8.0 | Numerical |
High earth-core dam [5] | 100 | 1.8-2.5 | 5.0-7.0 | Dynamic FEM |
Embankment dams (typical published range) | 70-90 | 2.0-2.8 | 6.0-7.5 | Empirical compilation |
4.4. Uncertainty and sensitivity analysis
The quantitative results depend on several input parameters that carry inherent uncertainty. A qualitative sensitivity analysis (Table 5) identifies how variations in the key parameters propagate to the predicted response quantities and to the intensity margin ΔI. Because the recorded response is far below the displacement and acceleration limits, the safety conclusion is insensitive to the plausible variation of the individual parameters considered; the exception is the material shear strength, where the Mohr-Coulomb clearance is only ≈ 0.03 MPa with unmeasured and , so strength verification remains a priority.
Taking the most unfavorable combination of parameters (high attenuation reducing apparent intensity, soft-soil amplification raising PGA, low shear modulus lowering the fundamental frequency toward the spectral plateau, and reduced damping), the predicted demand quantities increase by at most a factor of about two, which still leaves the dam response one to three orders of magnitude below the design limits in Table 1. The intensity margin ) = 7 − 5 = 2 degrees is governed directly by the recorded intensity and is therefore insensitive to modeling assumptions; even if the recorded intensity were one full MSK-64 degree higher ( 6), a positive margin of one degree would remain, preserving the safety conclusion.
4.5. Geotechnical model parameters and reference standards
Table 6 summarizes the geotechnical and material properties adopted for the finite-element model of the Surkhan dam, together with the boundary conditions and the reference standards used to assign site and material parameters.
Table 5Qualitative sensitivity of the key model outputs to the principal input parameters
Parameter | Plausible range | Affected output | Sensitivity of the affected output |
Anelastic attenuation, | 0.003-0.005 km-1 | Intensity (Eq. (1)) | Low ( 0.3 degree) |
Shear-wave velocity, | 320-420 m/s | PGA, site amplification (BSSA14 [19]) | Low-moderate |
Shear modulus, | 80-120 MPa | Frequencies , (Eq. (14)) | Low (period scales as -1/2) |
Damping ratio, | 3-7 % | Spectral demand , (Eq. 12) | Moderate |
Design intensity, | 7 MSK-64 (fixed) | Intensity margin (Eq. (8)) | Direct () |
Two international reference frameworks underpin the parameter selection. NEHRP (the U.S. National Earthquake Hazard Reduction Program site classification) defines site categories by the time-averaged shear-wave velocity in the upper 30 m (); the Surkhan foundation rock ( 760 m/s) corresponds to the NEHRP class B/C boundary, which corresponds to the reference velocity 760 m/s appearing both in the generalised form of Eq. (2) and in the BSSA14 model [19]. ICOLD (the International Commission on Large Dams) provides the standard guidance for the dynamic analysis of embankment dams, including the recommended modal damping ratio ( 5 %) for compacted earthfill under earthquake loading and the empirical site coefficient for the fundamental-period formula (Eq. (14)). Adopting these widely accepted standards rather than locally calibrated values makes the methodology transferable to other dams and the results comparable with international practice.
Table 6Geotechnical and material properties, by zone, adopted for the plane-strain finite-element model of the Surkhan dam
Zone / property | [MPa] | [–] | [kg/m3] | Notes |
Clay core (Zone 1) | 40-60 | 0.40 | 1900 | Low-permeability impervious core |
Filter / transition (Zone 2) | 60-90 | 0.35 | 1850 | Graded granular filter |
Gravel shell (Zone 3) | 80-120 | 0.30 | 1800 | Compacted clay-gravel fill |
Rock foundation (Zone 4) | 500 | 0.25 | 2200 | NEHRP class B/C, 760 m/s |
Finally, the question of reservoir-triggered seismicity (RTS) deserves comment. The Surkhan reservoir (capacity 800 million m³, impounded since 1967) lies in a tectonically active zone of design intensity degree 7 on the MSK-64 scale, and the national monitoring program explicitly tracks changes in the local seismic regime during impoundment and operation. The November 3, 2025 event, however, was a far-field tectonic earthquake originating in Afghanistan ( 146 km), not a reservoir-triggered event: its hypocentral depth (30 km) and epicentral location are inconsistent with shallow RTS, which typically occurs within a few kilometers of the impoundment and at shallow depth. The InSAR record for 2017-2023 is dominated by seasonal deformation, and no accelerating trend indicative of stress accumulation was identified over that period; individual points nevertheless show cumulative trends (Figs. 28-34), so continued point-wise monitoring remains necessary. The controlled operation of the reservoir – gradual seasonal drawdown and refilling rather than rapid uncontrolled release – further limits any RTS potential. Continuous monitoring nevertheless remains warranted to detect any future change in the local seismic regime.
4.6. Practical implications and comparison with prior studies
The results extend and complement previous studies of earthfill-dam seismic response. Whereas Sultanov and Umarkhonov [2] and Umarkhonov and Loginov [3] analyzed the stress-strain state of earth dams primarily through numerical modeling, and Rashidi et al. [4], Wei et al. [5], and Qi et al. [6] focused on construction-stage or purely numerical dynamic and liquefaction analyses, the present work links such modeling directly to a dual observational dataset (instrumental accelerograms and multi-year InSAR) for a specific recorded event. This observational anchoring is the principal practical advantage: the model predictions are compared quantity-by-quantity with the available field measurements (Table 3), which support the intensity prediction, show the SDOF spectral bound and the measured crest displacement to be not directly comparable quantities, and reveal the PGA gap discussed above.
From an operational standpoint, the demonstrated workflow – automatic earthquake detection on the national electronic platform, retrieval of instrumental accelerograms, decomposition of open Sentinel-1 InSAR data, and rapid evaluation of a transparent chain of analytical models – can be applied to the rapid post-earthquake screening of the 25 reservoir dams affected by the November 3, 2025 event and, more generally, to any monitored dam in a seismically active region. Because the method relies on freely available satellite data and standard analytical models, it offers a low-cost, replicable safety-assessment tool that does not require expensive dedicated instrumentation beyond the existing seismic stations.
5. Conclusions
This study applied an integrated satellite–instrumental framework to the earthfill South Surkhan reservoir dam following the far-field Afghanistan earthquake of November 3, 2025 ( 6.8, national network; Mw 6.2, USGS). Seven years of Sentinel-1 interferometry (2017-2023) establish a predominantly seasonal deformation baseline (−79.6 to +86.8 mm) driven by the reservoir cycle, with point-wise cumulative trends that require continued monitoring. Against this baseline the earthquake produced only a sub-millimetre transient: 0.16 mm horizontal and 0.15 mm vertical at recorded accelerations of 0.17 g and 0.18 g.
The macroseismic model (Eq. (1)) predicts 4.6 against the observed 5 MSK-64; the intensity margin is 2 degrees. The BSSA14 ground-motion model [19] gives a median free-field PGA of 0.012 g – about fourteen times below the recorded value – a gap whose candidate explanations (site and crest amplification, sensor position and processing, source effects) await examination of the raw records. The finite-element stresses ( 1.63, 0.41, 0.61 MPa) clear the assumed Mohr-Coulomb envelope by only ≈ 0.03 MPa, so the strength conclusion is conditional on site-specific testing of and . The liquefaction factor of safety is ≈ 3.6 ( 6.2; conservatively ≈ 2.8 for 6.8).
The contribution is a traceable, low-cost workflow that joins the national monitoring platform, instrumental accelerograms and free satellite interferometry, compared quantity-by-quantity with field measurements (Table 3) and transferable to other monitored dams. Its main limitations – linear-elastic two-dimensional idealisation, adopted rather than measured strength and attenuation parameters, an InSAR record ending in December 2023 and a single recorded event – define the future work: nonlinear three-dimensional analysis with the instrumental record, site-specific parameter testing and uninterrupted monitoring.
References
-
“On additional measures for the further improvement of the seismic safety system for the population and territory of the Republic of Uzbekistan,” President of the Republic of Uzbekistan, May 2023.
-
K. Sultanov and S. Umarkhonov, “Stress-strain state of earth dams considering soil moisture,” in AIP Conference Proceedings, Vol. 3405, No. 1, p. 440001, 2026, https://doi.org/10.1063/12.0043312
-
S. I. Umarkhonov and P. V. Loginov, “Study of the stress-strain state of the Charvak Dam taking into account water pressure,” Problems of Mechanics, No. 3, pp. 18–24, 2025.
-
M. Rashidi, M. Heidar, and G. Azizyan, “Numerical analysis and monitoring of an embankment dam during construction and first impounding (Case study: Siah Sang Dam),” Scientia Iranica, Aug. 2017, https://doi.org/10.24200/sci.2017.4181
-
K. Wei, S. Chen, G. Li, and H. Han, “Application of a generalised plasticity model in high earth core dam static and dynamic analysis,” European Journal of Environmental and Civil Engineering, Vol. 24, No. 7, pp. 979–1012, 2020, https://doi.org/10.1080/19648189.2018.1437777
-
C. Qi, W. Lu, J. Wu, and X. Liu, “Application of effective stress model to analysis of liquefaction and seismic performance of an earth dam in China,” Mathematical Problems in Engineering, Vol. 2015, pp. 1–7, 2015, https://doi.org/10.1155/2015/404712
-
Republican Center for Seismoprognostic Monitoring (Smrm), https://www.seismo.uz.
-
“On the implementation of a continuous radar space monitoring system for seismic resistance of reservoir dams,” Cabinet of Ministers of the Republic of Uzbekistan, Oct. 2024.
-
D. M. Boore and G. M. Atkinson, “Ground-motion prediction equations for the average horizontal component of PGA, PGV, and 5%-damped PSA at spectral periods between 0.01 s and 10.0 s,” Earthquake Spectra, Vol. 24, No. 1, pp. 99–138, Feb. 2008, https://doi.org/10.1193/1.2830434
-
A. K. Chopra, Dynamics of Structures: Theory and Applications to Earthquake Engineering. Hoboken, NJ, USA: Pearson, 2017, p. 978.
-
H. B. Seed and I. M. Idriss, “Simplified procedure for evaluating soil liquefaction potential,” Journal of the Soil Mechanics and Foundations Division, Vol. 97, No. 9, pp. 1249–1273, Sep. 1971, https://doi.org/10.1061/jsfeaq.0001662
-
“Selecting seismic parameters for large dams-Guidelines,” ICOLD, Paris, France, 2016.
-
N. M. Newmark and W. J. Hall, EERI Monograph Series MNO-3. Berkeley, CA, USA: Earthquake Engineering Research Institute, 1982, p. 978.
-
A. der Kiureghian, “A response spectrum method for random vibration analysis of MDF systems,” Earthquake Eng. Struct. Dyn, Vol. 9, No. 5, pp. 419–435, 1981.
-
U. S. Geological Survey. “M 6.2 – 30 km SE of Mazar-e Sharif, Afghanistan.” Earthquake Hazards Program. https://earthquake.usgs.gov/earthquakes/eventpage/us6000rl31 (accessed Nov. 2025).
-
S. V. Medvedev, W. Sponheuer, and V. Kárník, Seismic Intensity Scale Version MSK 1964. Moscow, USSR: Akad. Nauk SSSR, Geofiz. Kom., 1965.
-
A. Blake, “On the estimation of focal depth from macroseismic data,” Bulletin of the Seismological Society of America, Vol. 31, No. 3, pp. 225–231, 1941, https://doi.org/10.1785/bssa0310030225
-
T. L. Youd et al., “Liquefaction resistance of soils: Summary report from the 1996 NCEER and 1998 NCEER/NSF workshops on evaluation of liquefaction resistance of soils,” Journal of Geotechnical and Geoenvironmental Engineering, Vol. 127, No. 4, pp. 297–313, 2002, https://doi.org/10.1061/(asce)1090-0241(2001)127:4(297)
-
D. M. Boore, J. P. Stewart, E. Seyhan, and G. M. Atkinson, “NGA-West2 equations for predicting PGA, PGV, and 5 % damped PSA for shallow crustal earthquakes,” Earthquake Spectra, Vol. 30, No. 3, pp. 1057–1085, 2013, https://doi.org/10.1193/070113eqs184m
About this article

The authors express their sincere gratitude to the National Research Institute for Seismic Safety and Resilient Construction, affiliated with Tashkent Institute of Architecture and Civil Engineering, for providing the research environment and technical support.
This research was supported by the project entitled “Implementation of a Method for Analyzing the Technical Condition of Buildings and Structures in Terms of Seismic Resistance Based on Artificial Intelligence (Case Study of Multi-Storey Residential Buildings)”, Project No. 4/26-j.
The datasets analysed in this study comprise (i) Sentinel-1 satellite radar interferometry products for the South Surkhan reservoir dam, (ii) accelerogram records obtained from the seismic stations installed on the dam for the November 3, 2025 Afghanistan earthquake, and (iii) monitoring records held on the national electronic platform of the Ministry of Emergency Situations of the Republic of Uzbekistan. The Sentinel-1 source imagery is openly available from the Copernicus programme. The instrumental and platform records are held by the national monitoring authorities and are not publicly distributable; they are available from the corresponding author on reasonable request and with the permission of the data owners.
D.A. Bekmirzaev: conceptualization, methodology, supervision. S.N. Nabiyev: Numerical modelling, processing of satellite and instrumental monitoring data, writing-original draft preparation. S.S. Shaumarov: investigation, review and editing, project administration.
The authors declare that they have no conflict of interest.

