Abstract
The coupling between the high-frequency reciprocating motion of the impact piston and the transient internal flow field in a hydraulic rock drill constitutes the dynamic origin of cavitation in the system. To reveal the mechanism of cavitation evolution in the front chamber, this study focused on a dual-chamber-controlled hydraulic rock drill and developed a fluid-structure coupling numerical model integrating fluid dynamics and rigid-body kinematics. Numerical simulations were conducted using PumpLinx software to obtain the spatiotemporal evolution of the internal flow field of the impactor during operation. Results show that cavitation initiates in the braking phase at the end of the return stroke and continues into the acceleration phase at the beginning of the forward stroke. During the braking phase, cavitation nuclei originate and develop at two critical locations: first, at the right corner of the undercut groove in the main oil passage, where a sudden flow cross-section reduction generates a high-speed jet, and the adverse pressure gradient induces flow separation and vortex structures, leading to intense bubble evolution in this region; second, at the bottom of the annular cavity near the guide sleeve, where opposing directions of the main flow and the replenishment flow result in insufficient oil supply, yielding relatively gradual cavitation development. Upon entering the initial forward-stroke acceleration phase, the reversed piston motion rapidly pressurizes the guide-sleeve annular cavity, where bubbles collapse quickly as pressure recovers. In contrast, downstream of the undercut groove corner, persistent vortex motion significantly delays bubble collapse.
Highlights
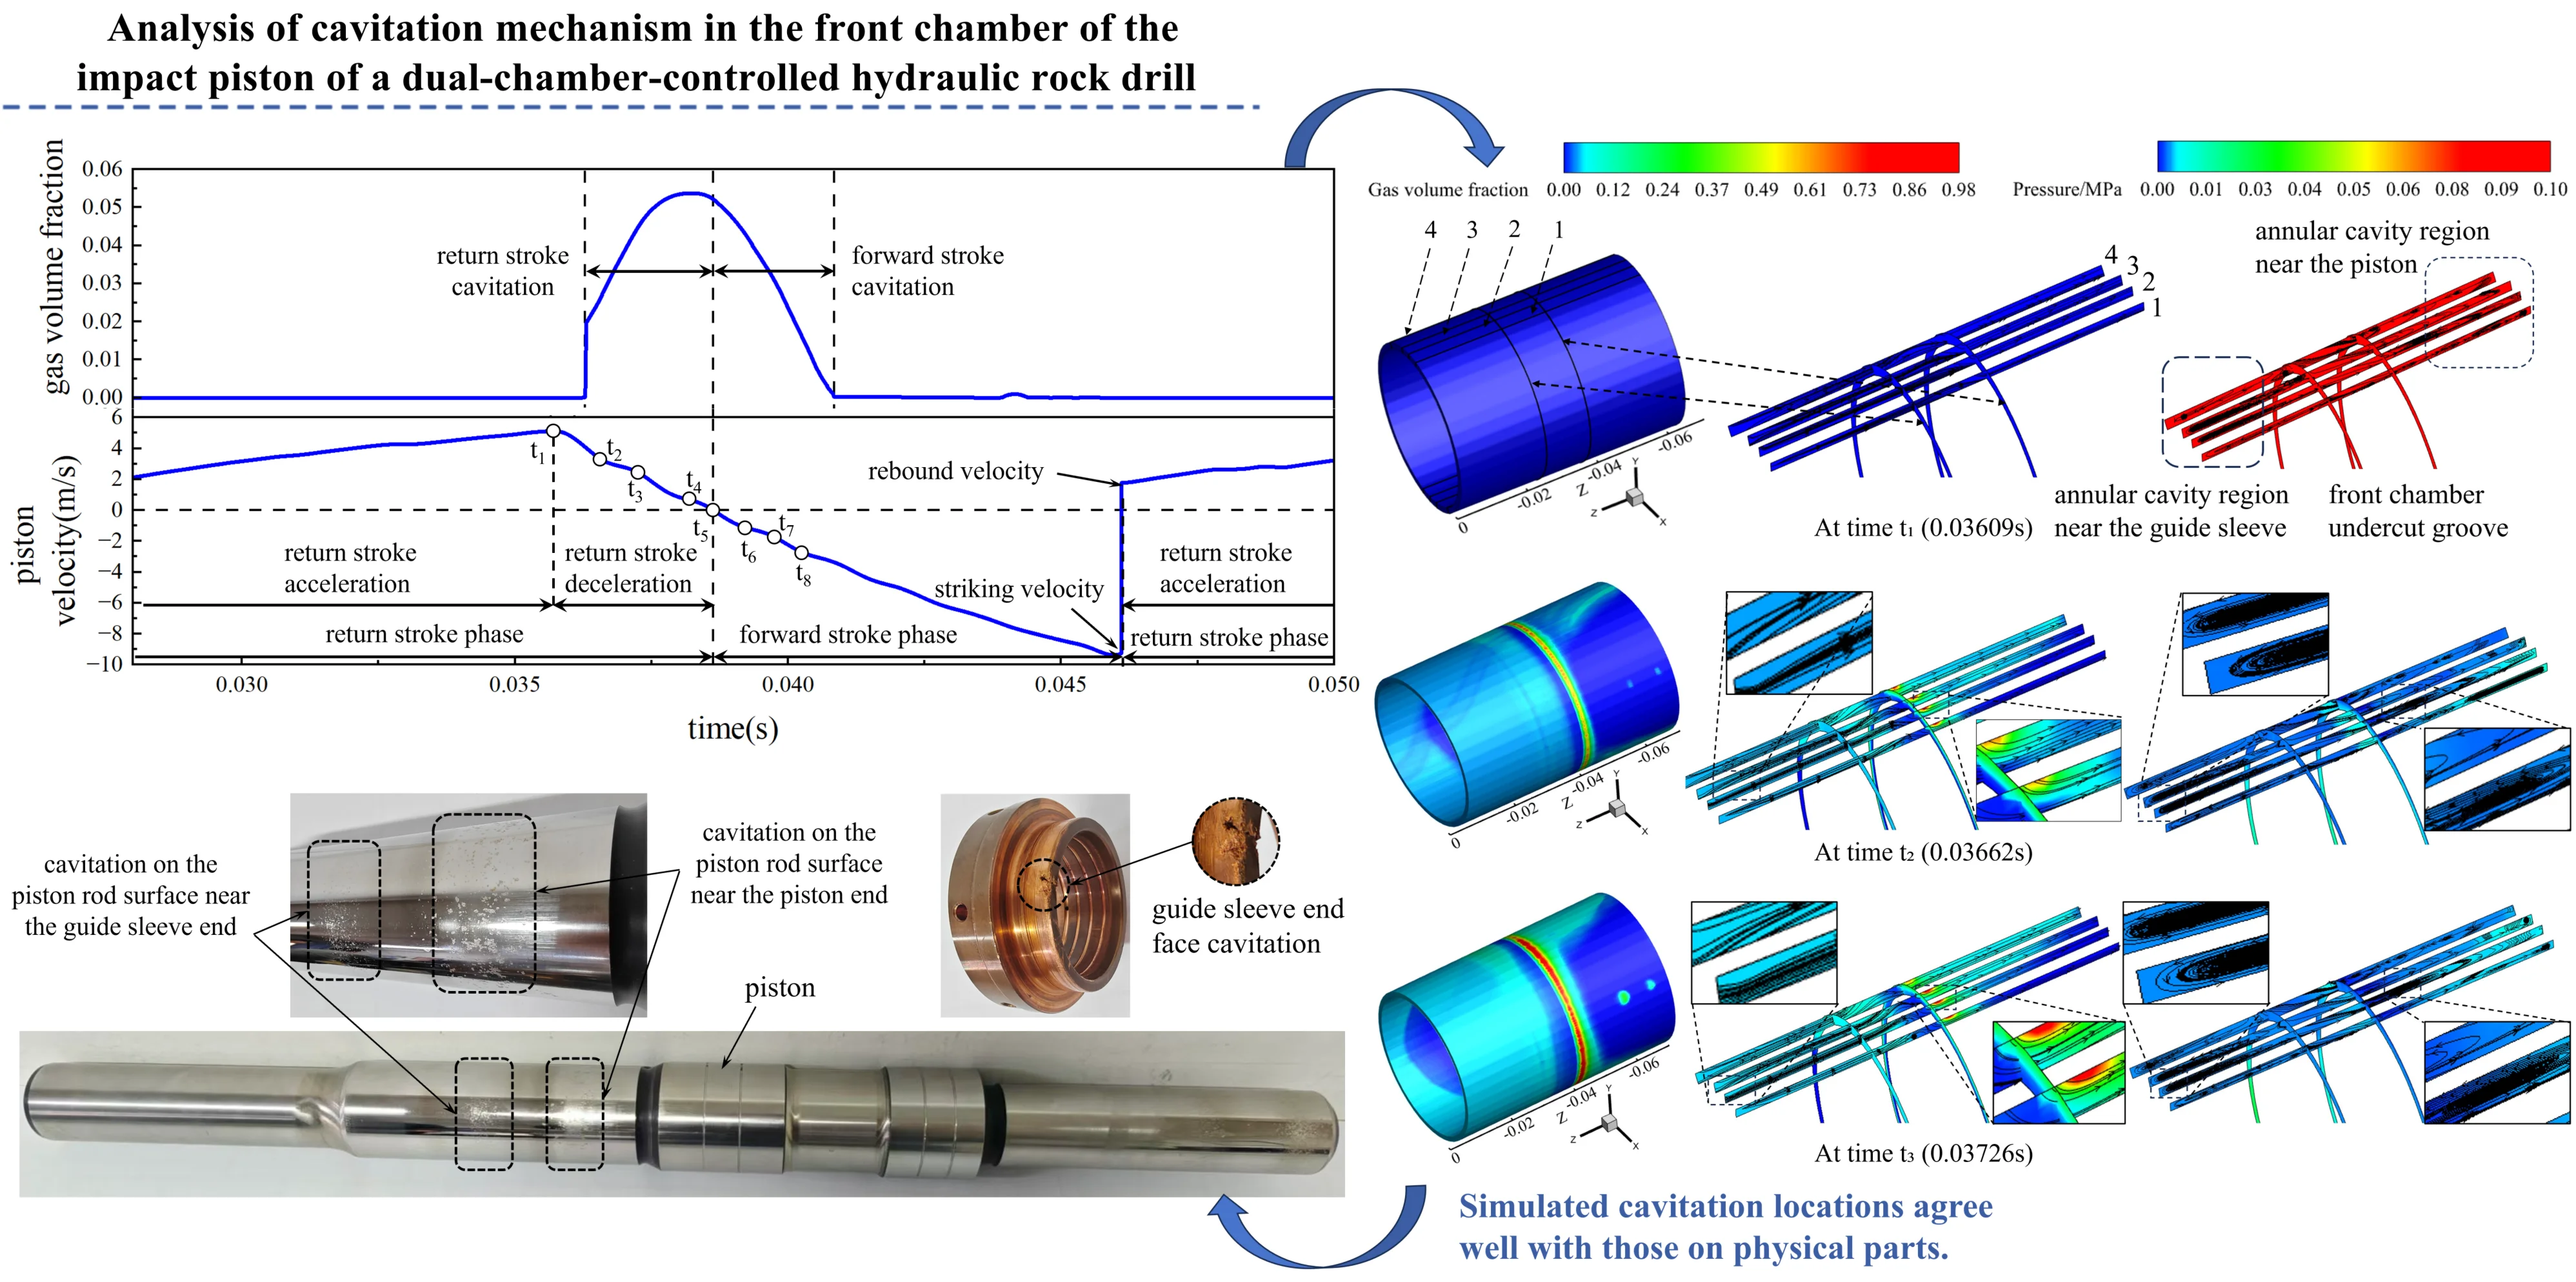
- Cavitation in the impact piston front chamber consists of return stroke and forward stroke phases, accounting for approximately 24% of one impact cycle. The return stroke cavitation is significantly more intense, featured by a higher gas volume fraction and a faster evolution rate.
- Three front-chamber cavitation regions: the annular cavity near the guide sleeve, the right corner of the undercut groove, and the annular cavity close to the piston. The corner features the strongest cavitation driven by cross-section reduction, velocity rise and combined vortex effects.
- Cavitation initiates during the return-stroke braking phase with region-specific evolution. Near the guide sleeve, cavitation develops mildly and dissipates relatively fast in forward-stroke acceleration; downstream of the groove, vortex-governed cavitation decays slower due to intense turbulence.
- The fluid structure coupling model is validated by stress wave experiments with a deviation of 4.29%; the predicted cavitation erosion locations agree well with the actual damage morphology observed on the piston rod and guide sleeve end face.
1. Introduction
The hydraulic rock drill is widely employed in mining tunnel driving, transportation tunnel construction, and rock excavation due to its compact structure, high drilling efficiency, and reliable performance. It represents the state of the art in drilling and excavation equipment [1]. Using fluid as the transmission medium, the drill converts hydraulic energy into mechanical kinetic energy via a piston, which then strikes the drill rod to generate stress waves for rock fracturing. The dynamic behavior of each stage in this process is highly complex and directly affects the drill’s energy conversion efficiency, impact performance, and service life.
Based on stress wave propagation theory, Ding et al. [2] modeled the impact as a vibration response problem with an initial velocity and internal stress waves, investigating how stress wave propagation behavior and drill rod geometry influence impact force and energy utilization. Using stress wave measurement techniques, Yang et al. [3] compared the impact energy, frequency, and efficiency of rock drills with long and short pistons, concluding that a shorter piston combined with higher system pressure yields better impact performance. Li [4] argued that controlling the stress wave profile significantly influences the rock drill's impact performance and the durability of its impact mechanical system. Through analysis of the relationship between the dimensionless impact coefficient and the stress waveform, it was shown that varying the piston length modifies stress wave behavior. Accordingly, a dimensionless impact coefficient in the range of 9-11 was recommended for high-power piston designs, and 3-5 for low-power applications. The research above indicates that key performance indicators of rock drills – such as impact energy and frequency – are closely related to the dynamic behavior of their impact systems. Seo et al. [5] developed a graphical solution model for the impact system of dual-chamber-controlled hydraulic rock drills using SimulationX. The model simulated and analyzed how the diameter of the control valve affects impact frequency and energy. The results showed that increasing the valve spool diameter enhances both the piston’s impact frequency and energy, but the increase rate of impact energy is higher. Ma et al. [6] developed a coupled mathematical model for the hydraulic impact system and mechanical collision system of dual-chamber-controlled hydraulic rock drills. Using MATLAB, they computed transient curves of piston displacement and velocity, pressures in the piston front and rear chambers, and pressures in the left and right control chambers of the control valve. The study further investigated how the damping clearance of the control valve and the diameter of the main oil circuit affect the drill’s impact performance. Results showed that a larger damping clearance enhances the valve spool’s switching speed, increases piston impact frequency, and suppresses flow pressure pulsations and cavitation. However, an excessively large clearance exacerbates valve spool collisions and potential damage, with an optimal clearance of 10 μm recommended. To address problems such as insufficient impact force, system overheating, and buffer overpressure in dual-chamber-controlled hydraulic rock drills, Geng et al. [7, 8] developed a lumped-parameter model that integrates the impact system, buffer system, and rock dynamics. The model was used to analyze the kinematic behavior of the impact and buffer pistons and the transient pressure variations in individual control chambers. Based on simulation results combined with experimental tests, critical structural parameters affecting system performance were identified, and corresponding design recommendations were proposed.
As indicated above, research on hydraulic rock drills has gradually evolved from analyzing external working performance to revealing internal rules and mechanisms. Cavitation is one of the non-negligible causes of vibration and noise in hydraulic systems [9]. For rock drills, the self-feedback high-frequency reciprocating impact motion of the valve-controlled cylinder during operation readily induces phenomena such as pulsating overpressure and cavitation inside the flow field, and causes problems such as vibration fatigue and cavitation erosion damage to the machine. Hu [10], Fu [11] et al. have all pointed out the key bottleneck issues affecting the reliability of rock drills, such as cavitation erosion of impact pistons and guide sleeves, in the domestic and international technical status of hydraulic rock drills. Based on a dynamic simulation of the impactor, Geng et al. [12] pointed out that cavitation in the front chamber during the return-stroke braking phase is related to the duration of low pressure in that chamber, and proposed that installing a return-line accumulator could alleviate the negative pressure and thereby mitigate cavitation erosion. However, constrained by the inherent limitations of the lumped-parameter modeling approach, existing studies have not been able to capture the complete dynamic process of cavitation inception, development and collapse in the flow field. The evolution mechanism of the cavitating flow remains unclear, and potential risk locations for cavitation erosion cannot yet be reliably predicted.
To investigate the transient flow field dynamics inside the impactor during rock drill operation, Chai [13], Deng et al. [14] developed an AMESim graphical model for single-side return-flow hydraulic breakers. The simulation results were used to define the kinematic behavior of the impact piston and the valve spool in subsequent PumpLinx flow-field simulations, thereby obtaining distributions of flow parameters within the impactor. However, since the piston and valve motion in these simulations were predefined rather than dynamically coupled, the models did not account for fluid-structure coupling, leading to discrepancies with real-world physics. Given this, this paper focuses on a dual-chamber-controlled hydraulic rock drill and further explores fluid-structure coupling numerical simulation methods for the working process of its impact system. The goal is to obtain the spatiotemporal dynamic evolution of internal flow field parameters during the impact process, clarify the mechanisms driving cavitation initiation and evolution in the rock drill’s flow field, and predict locations prone to cavitation erosion. These insights aim to provide a theoretical basis for structural improvements to the impact system components.
2. Structure and working principle of impact system
The dual-chamber-controlled hydraulic rock drill consists of the impact system, buffer system, rotation drive assembly, front head assembly, drill rod, and other components. The impact system serves as the core unit that converts hydraulic energy into mechanical kinetic energy to drive the piston and perform external work. Schematic diagrams of its structure and of the hydraulic circuit of the impact system are shown in Fig. 1.
Fig. 1Working principle diagram of the dual-chamber-controlled hydraulic rock drill impact system
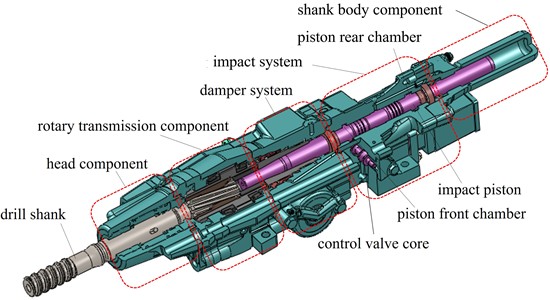
a) Structural composition diagram of the dual-chamber-controlled hydraulic rock drill
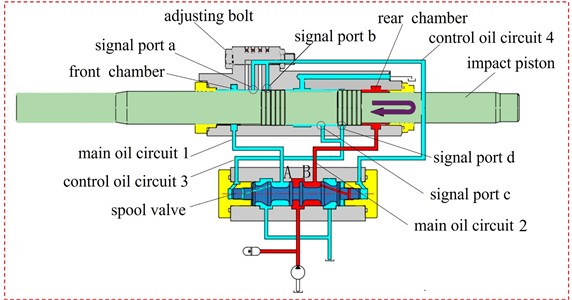
b) Hydraulic schematic diagram of impact system
The impact system mainly consists of the impact piston, directional control valve, adjusting bolt, accumulator and other components. According to the kinematic characteristics of the impact piston, the working cycle of the impact system can be simplified into three phases: return-stroke acceleration, return-stroke braking and forward-stroke acceleration. During the return-stroke acceleration phase, high-pressure oil flows into the piston front chamber through port A of the directional control valve and main oil passage 1, while the piston rear chamber is connected to the low-pressure return line via main oil passage 2, driving the piston to accelerate rightward. When the piston moves to signal port a, high-pressure oil from the front chamber communicates with the right control chamber of the directional control valve through signal port a and control oil passage 4, and the left control chamber of the valve is connected to the return line via control oil passage 3 and signal port c. This pressure difference causes the valve spool to move leftward and initiate valve commutation, and the piston decelerates during its rightward return stroke. Once the valve spool passes the neutral position, high-pressure oil enters the piston rear chamber through port B of the directional control valve and main oil passage 2, while the front chamber is connected to the return line via main oil passage 1. The piston thus enters the return-stroke braking phase, and then rapidly transitions to the leftward forward-stroke acceleration phase. As the piston accelerates leftward to signal port b, the right control chamber of the valve is drained to the return line through control oil passage 4 and signal port b for pressure relief, preparing the spool for rightward commutation. When the piston continues accelerating leftward to signal port d, the left control chamber of the directional control valve is connected to the high-pressure oil in the piston rear chamber via control oil passage 3 and signal port d, triggering the rightward commutation of the valve. The impact piston then strikes the drill shank and enters the return-stroke acceleration phase at the collision rebound velocity. This cycle repeats continuously, enabling the rock drill to complete impact rock-breaking and drilling operations.
3. Mathematical model of gas-liquid two-phase flow
3.1. Governing equations
Ignoring thermal effects, mass and momentum conservation for single-fluid homogeneous multiphase transport can be described by the following governing equations in integral form [15]:
where is the control volume within the computational domain; is the surface area of the control volume; is the outward normal direction of the control surface; is the density of the mixed medium; is the pressure; is the volume force; is the flow field velocity; is the surface motion velocity. The shear stress tensor is defined as a function of dynamic viscosity and velocity gradient, and its mathematical expression is given by:
where is the component of velocity ; is the Kronecker delta.
3.2. Turbulence model
Considering the geometric complexity of internal flow passages in the impact system and the intense turbulent flow in the alternating flow field, the RNG - turbulence model was adopted for simulations:
where and are empirical constants with values 1.44 and 1.92, respectively; and are the turbulent Prandtl numbers for turbulent kinetic energy and turbulent dissipation rate , with values 1 and 1.3, respectively. and (RNG constants) take values 4.38 and 1.92, respectively. The turbulent kinetic energy and turbulent dissipation rate are calculated as follows:
where denotes the turbulent fluctuating velocity; represents the strain tensor, defined as:
where are the components of the turbulent fluctuating velocity .
The turbulent viscosity is calculated by the following equation:
where is a constant with a value of 0.09.
The turbulence production term is defined as a function of the velocity gradient and the Reynolds stress tensor, and its expression is given by:
The turbulent Reynolds stress tensor is defined by the Boussinesq hypothesis as:
3.3. Cavitation model
When the medium pressure is lower than the oil-gas separation pressure or saturation vapor pressure, non-condensable gas evolution or oil evaporation occurs, initiating cavitation. The transport equation for the mass fraction of the vapor phase is given by the following equation [16]:
where is the diffusion coefficient of vapor mass fraction; is the turbulent Schmidt number; and are the vapor generation rate and vapor condensation rate, respectively, serving as phase change source terms, which constitute the cavitation model.
In previous studies on the cavitating flow field in inward-flow centrifugal pump impellers [15] and piston pump valving pairs [17], the Singhal full cavitation model was adopted and achieved good prediction accuracy. Therefore, the full cavitation model was employed in this study, expressed as:
where and are the vaporization constant and condensation constant, with values 0.04 and 0.1, respectively; and denote the oil vapor density and liquid-phase density, respectively; is the surface tension; is the saturation vapor pressure; is the mass fraction of non-condensable gas, which can be treated as a constant.
The formula for the density of the mixed medium is as follows:
where is the density of non-condensable gas.
3.4. Equation of state
When cavitation occurs, the density of the mixed medium changes drastically with pressure, and the equation of state for the mixed medium is:
where is the effective bulk modulus of the mixed medium; and are the total mass fraction and density of oil vapor and non-condensable gas, respectively; is the bulk modulus of the pure liquid medium.
4. Fluid-structure coupling computational methods
4.1. Rigid body dynamics model
In fluid-structure coupling calculations, both the piston and valve spool can be treated as rigid bodies; the piston is used here as an example for illustration. To simplify the analysis, the following assumptions are made when formulating the piston dynamics equation: friction and gravitational forces acting on the piston are neglected; considering the guiding effect of the front and rear guide sleeves, the piston is assumed to undergo only axial motion. According to Newton’s second law, the axial force balance equation for the piston is given by:
where is the mass of the impact piston (kg); is the axial hydraulic force acting on the piston, calculated by integrating the pressure distribution over the piston’s annular pressure-bearing surface obtained from flow field computations (N); is the piston acceleration (m/s2). This equation is solved using the translational motion model in PumpLinx.
4.2. Geometric model of flow field computational domain and mesh generation
The structural parameters of the simulation model and the extractable computational fluid domain are listed in Table 1 and illustrated in Fig. 2, respectively.
Table 1Parameters of PumpLinx simulation
Parameter (Unit) | Value |
Impact piston mass (kg) | 5.2 |
Valve spool mass (kg) | 0.37 |
Front chamber sealing length (mm) | 31.5 |
Rear chamber sealing length (mm) | 30.8 |
Piston diameter (mm) | 44 |
Piston rear rod diameter (mm) | 36 |
Piston front rod diameter (mm) | 41 |
Valve spool diameter (mm) | 30 |
Valve spool control end diameter (mm) | 13 |
Maximum valve opening (mm) | 1.6 |
Positive overlap at neutral position (mm) | 0.35 |
Fig. 2Computational flow domain of the impact system
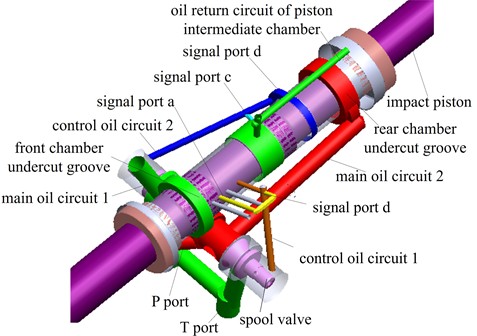
Considering the geometric scale changes of the rigid-body motion computational domain and the convenience of mesh generation, the computational fluid domain was classified into two types: moving mesh regions and stationary regions. The moving mesh regions include the front and rear piston chambers, the left and right control cavities of the directional control valve, fixed bias chamber, and damping chamber, while the stationary regions consist of main oil paths 1 and 2, control oil paths 3 and 4, and the adjustment bolt oil path. Data exchange between the deforming mesh and stationary mesh is achieved through interfaces. For narrow clearance flow regions such as the damping chamber of the directional control valve and the sealing land of the impact piston, a minimum of two oil film grid layers were deployed. Meanwhile, local grid refinement was implemented for critical flow regions such as the valve port of the directional control valve, so as to accurately capture the velocity gradient and pressure distribution inside the flow field. Simplified treatments are conducted for certain regions including the oil inlet passage and oil return passage, and the detailed grid generation diagram is shown in Fig. 3.
Boundary conditions and physical property parameters of the medium for fluid-structure coupling calculations are specified in Table 2.
Fig. 3Mesh diagram of the computational domain for the rock drill impact system
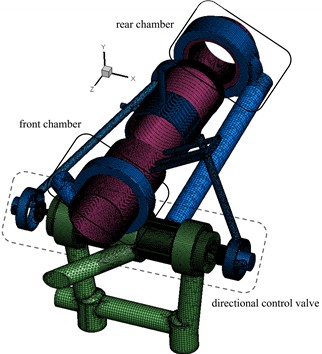
a) Mesh generation diagram of the computational domain for the impact system
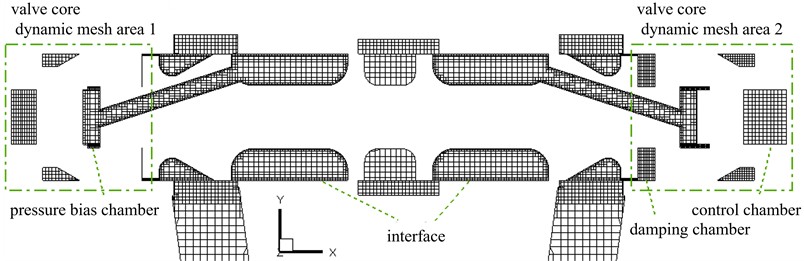
b) Enlarged diagram of mesh generation for longitudinal section of control valve computational domain
Table 2Boundary conditions and physical parameters of oil
Parameter (Unit) | Value |
Inlet pressure (MPa) | 18 |
Outlet pressure (MPa) | 0.2 |
Oil density (kg·m-3) | 875 |
Oil dynamic viscosity (Pa·s) | 0.04025 |
Oil bulk modulus (MPa) | 1400 |
Saturated vapor pressure of oil (MPa) | 0.0032 [18] |
Non-condensable gas mass fraction | 9×10⁻⁵ |
Oil surface tension (N·m-1) | 0.0318 |
Temperature (K) | 313.15 |
Cavitation model evaporation correction factor | 0.04 |
Cavitation model condensation correction factor | 0.1 |
Time step (s) | 0.000005 |
4.3. Grid independence verification
The accuracy of CFD flow field simulation results is closely related to the quality and refinement of the grid. The fluid domain mesh is generated using the template-based meshing method built into the PumpLinx software. The software generates high-quality orthogonal hexahedral grids based on the adaptive binary tree algorithm, featuring excellent orthogonality and low distortion, thus ensuring grid quality. Fine grids can accurately capture physical field information and yield more reliable computational results; however, this typically entails higher computational time and resource consumption. Therefore, grid independence verification was conducted under identical boundary conditions by adjusting the grid scale and selecting the peak pressure of the rear chamber as the criterion for grid accuracy evaluation. The results are presented in Table 3. As the number of grids increased, the peak pressure in the rear chamber tended to stabilize, with negligible variations. Considering both computational accuracy and efficiency comprehensively, the grid scheme of Model 3 was ultimately adopted for the simulation calculations.
Table 3Simulation results of grid independence verification
Grid ID | Number of elements | Number of nodes | Peak pressure in rear chamber (MPa) | Relative deviation (%) |
1 | 1294381 | 2030680 | 31.95 | 5.58 |
2 | 1637336 | 2221591 | 30.75 | 1.62 |
3 | 1782741 | 2452657 | 30.19 | 0.23 |
4 | 2091845 | 3046860 | 30.22 | 0.13 |
5 | 3482076 | 4393312 | 30.26 | – |
4.4. Theoretical validation of the fluid-structure coupling computational model
The studied hydraulic rock drill has a rated working pressure of 18 MPa and a maximum working pressure of 22.5 MPa, with an operating frequency range of 50-60 Hz. With the rated working pressure as the input and the three-stage design method as the framework [19], the impact performance parameters were deduced via Eqs. (19-21):
where is the effective area of the front chamber (mm2); is the effective area of the rear chamber (mm2); and are the comprehensive resistance coefficient and the return-oil resistance coefficient, respectively, and both are taken as 0.08; is the ratio of return-stroke to forward-stroke acceleration; is the mass of the impact piston (kg); is the working pressure (MPa); is the impact velocity (m/s); is the cycle period; is the stroke coefficient.
Fig. 4Impact piston velocity-displacement curve
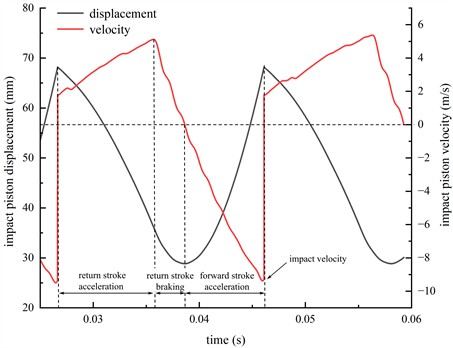
Using Eqs. (19-21), the theoretical ratio of impact velocity to period was calculated as 510.90 m/s2.
As shown in the impact piston velocity curve of Fig. 4, the striking-point velocity is 9.32 m/s, the impact frequency is 51.39 Hz, and the corresponding ratio of impact velocity to period is 478.93 m/s2. The fluid-structure coupling result deviates from the theoretical calculation by about 6.26 %, which falls within an acceptable error range, thus verifying the validity of the fluid-structure coupling computational model.
5. Experimental validation of the fluid-structure coupling computational model
5.1. Experimental principle
According to wave dynamics theory, the impact energy of the piston is a function of the square of the stress-wave amplitude at the drill-rod shank. Therefore, in stress-wave testing, only the amplitude of the stress wave needs to be measured. The piston impact energy is calculated by applying the impact-energy function, given by:
where is the cross-sectional area of the drill-rod shank (mm2), is the propagation speed of the stress wave in the shank (m/s), is the elastic modulus of the drill-rod material (GPa), is the amplitude of the stress wave (mm), and is the duration of the stress wave (s).
5.2. Test system and result verification
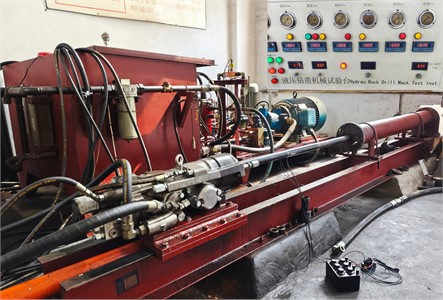
The stress-wave impact performance test rig for the hydraulic rock drill is shown in Fig. 5. A measuring rod with the same structural dimensions as the drill-rod shank was used in place of the actual drill rod during the experiments. The test was conducted at room temperature. The system inlet pressure was maintained at 18 MPa via an electro-proportional valve, and this pressure condition was consistent with the simulation setting. Both the test and the simulation employed a constant-pressure oil supply mode. The flow rate was regulated by a flow divider valve, with an average value of 79.2 L/min, which was close to the average simulated flow rate of 73.0 L/min. Since the influence of torque on impact performance was not taken into account, a feed cylinder was adopted to control the forward movement of the rock drill throughout the testing process. The experimental procedure followed the relevant international standard [20] and national standard [21].
Fig. 5Hydraulic rock drill impact performance test bench by stress wave method. Photo by Haonan Wang in May 2025 in Changsha Research Institute of Mining and Metallurgy, China
According to the experimental curves in Fig. 6 and the data presented in Table 4, the average impact energy of the impact piston was determined to be 227.88 J, with an average impact frequency of 53.46 Hz. From these values, the impact velocity was calculated as 9.36 m/s, yielding a ratio of impact velocity to period of 500.38 m/s2. The deviation between the fluid-structure coupling computational results and the experimental results is approximately 4.29 %, which demonstrates good agreement between the simulation and experiment.
Fig. 6Impact performance curve at 18 MPa
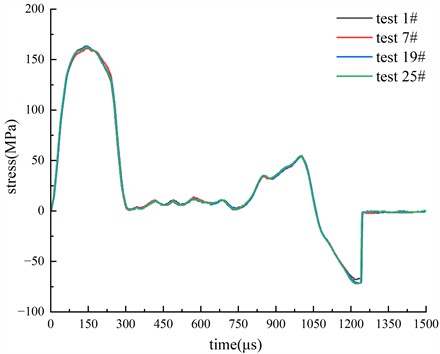
Table 4Impact performance data at 18 MPa
No. | Stress (MPa) | Energy (J) | Frequency (Hz) | No. | Stress (MPa) | Energy (J) | Frequency (Hz) |
1 | 163.955 | 231.388 | 53.602 | 15 | 164.462 | 234.951 | 53.599 |
2 | 163.448 | 216.677 | 53.446 | 16 | 162.181 | 213.787 | 53.405 |
3 | 161.421 | 229.960 | 53.382 | 17 | 163.955 | 232.429 | 53.559 |
4 | 162.181 | 231.765 | 53.430 | 18 | 164.462 | 234.586 | 53.553 |
5 | 162.181 | 214.827 | 53.387 | 19 | 162.688 | 231.678 | 53.472 |
6 | 163.448 | 231.994 | 53.279 | 20 | 162.688 | 231.879 | 53.446 |
7 | 160.154 | 209.202 | 53.279 | 21 | 163.955 | 231.018 | 53.608 |
8 | 162.688 | 232.233 | 53.475 | 22 | 162.181 | 214.097 | 53.477 |
9 | 162.181 | 232.475 | 53.340 | 23 | 163.448 | 216.237 | 53.272 |
10 | 162.181 | 231.019 | 53.332 | 24 | 164.462 | 233.077 | 53.625 |
11 | 162.688 | 233.661 | 53.467 | 25 | 163.448 | 232.817 | 53.529 |
12 | 163.955 | 231.807 | 53.628 | Mean | 162.931 | 227.882 | 53.464 |
13 | 162.181 | 231.336 | 53.505 | SD | 1.010 | 7.730 | 0.106 |
14 | 162.688 | 232.153 | 53.505 |
6. Fluid-structure coupling results and analysis
6.1. Transient characteristics of key parameters during front chamber cavitation
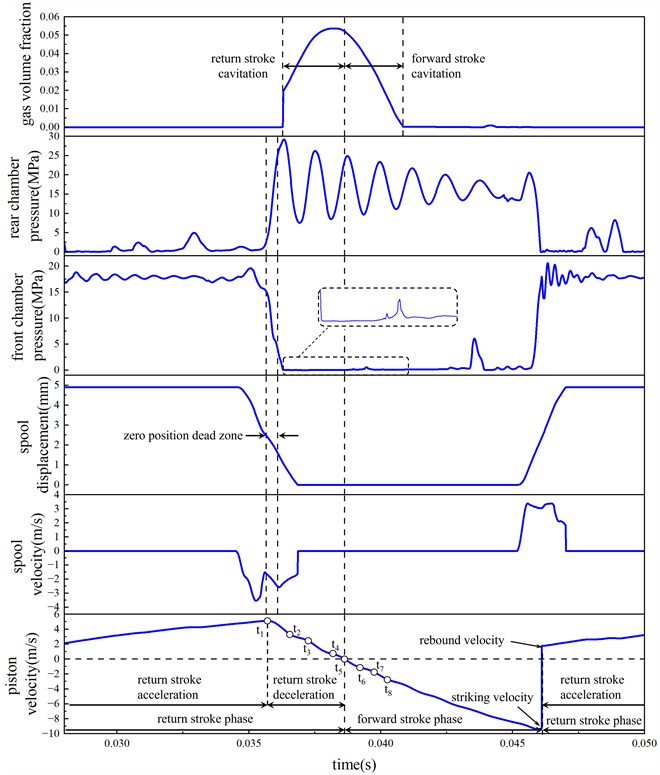
Fig. 7 presents the transient profiles obtained from the fluid-structure coupling simulation over one impact cycle, showing the gas volume fraction in the front chamber, pressures in the front and rear chambers, spool displacement, spool velocity, and piston velocity. The results indicate that both the forward-stroke phase and the return-stroke acceleration phase each occupy approximately 40 % of the total cycle, while the return-stroke braking phase accounts for about 20 %. Cavitation in the front chamber consists of two stages: return-stroke cavitation and forward-stroke cavitation, together lasting about 24 % of the cycle. The return-stroke cavitation stage constitutes roughly 52 % of the total cavitation duration, during which the gas volume fraction is high and its gradient changes sharply, reflecting intense cavitation evolution. In contrast, the forward-stroke cavitation stage exhibits a relatively lower gas volume fraction and a more gradual variation in the fraction over time.
Fig. 7Variation curves of gas volume fraction in the front chamber, pressures in the front and rear chambers, spool displacement, spool velocity and piston velocity in one stroke cycle
Following the time sequence of cavitation inception, development, and collapse, the cavitation process in the front chamber is described as follows:
Prior to 0.03573 s, the piston undergoes return-stroke acceleration, reaching a peak return velocity of 5.11 m/s. The valve spool moves within its neutral dead zone during the period from 0.03566 s to 0.03609 s. At 0.03573 s, the spool displacement for the shifting motion is 2.55 mm, indicating that the spool has already entered the neutral dead zone. During the preceding period, the gas volume fraction in the piston front chamber remains near zero, and no cavitation occurs.
During the period from 0.03574 s to 0.03609 s, the valve spool remains in the neutral dead zone, thereby closing the main oil passages to both the front and rear chambers of the piston. Under inertia, the piston continues its return stroke in a decelerating motion. The front chamber is sealed and expands, causing its pressure to drop rapidly from 14.1 MPa to nearly the air-release pressure. This creates the low-pressure condition required for cavitation inception in the front chamber. Meanwhile, the rear chamber is sealed and compressed, with its pressure rising sharply to 25.3 MPa, providing the braking force that decelerates the piston's return stroke.
During the period from 0.03609 s to 0.03630 s, the valve spool has just moved past the neutral dead zone. The piston front chamber is now connected to the return line, while the rear chamber is connected to the supply line. However, due to the limited valve opening, oil replenishment to the front chamber remains insufficient, causing its pressure to continue decreasing until it reaches the saturated vapor pressure. At 0.03628 s, cavitation is abruptly initiated, and the gas volume fraction in the front chamber increases sharply to 0.0197. Meanwhile, the pressure in the rear chamber continues to rise, albeit at a diminishing rate.
During the period from 0.03631 s to 0.03686 s, the control valve opening gradually increases to its maximum. As the piston is in the return-stroke braking phase with a velocity of about 3.9 m/s, oil replenishment to the front chamber remains inadequate, keeping the pressure low, while the gas volume fraction continues to rise. The pressure in the rear chamber exhibits a pulsating and decaying profile, with peak values reaching 29.2 MPa.
During the period from 0.03687 s to 0.03825 s, the piston remains in the return-stroke braking phase. The gas volume fraction in the front chamber gradually increases to its peak of 0.0537, though the rate of increase slows noticeably.
During the period from 0.03826 s to 0.03863 s, the piston is in the final stage of return-stroke braking. Its return velocity gradually decreases to 0 m/s, which further weakens the suction effect for oil replenishment into the front chamber. The oil pressure in the front chamber oscillates and gradually recovers, eventually exceeding the saturated vapor pressure. Consequently, vapor bubbles begin to condense. Owing to the asymmetry between evaporation and condensation processes, the decrease in the gas volume fraction in the front chamber proceeds relatively slowly.
During the period from 0.03864 s to 0.04084 s, the piston is in the initial stage of forward-stroke acceleration, with its impact velocity gradually increasing to 3.35 m/s. The reverse motion of the piston accelerates the pressurization process in the front chamber, raising the oil pressure close to the air-release pressure. The bubble collapse process then proceeds relatively rapidly until cavitation completely ceases.
6.2. Spatiotemporal evolution process of cavitating flow field in piston front chamber
Analysis of the transient gas volume fraction profile shows that cavitation in the front-chamber flow field occurs primarily during the return-stroke braking and initial forward-stroke phases. To further investigate the initiation, evolution, influencing mechanisms, and locations of front-chamber cavitation, the distribution characteristics of the flow-field parameters in this chamber during the aforementioned period need to be analyzed.
Fig. 8Gas volume fraction contour in the flow field of the impactor during return-stroke braking stage
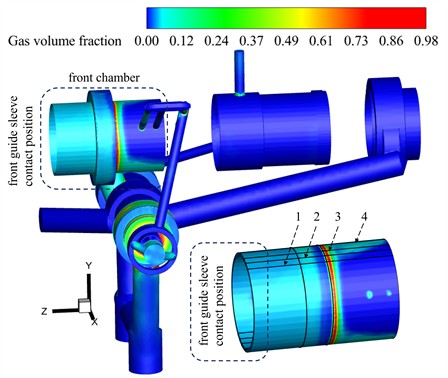
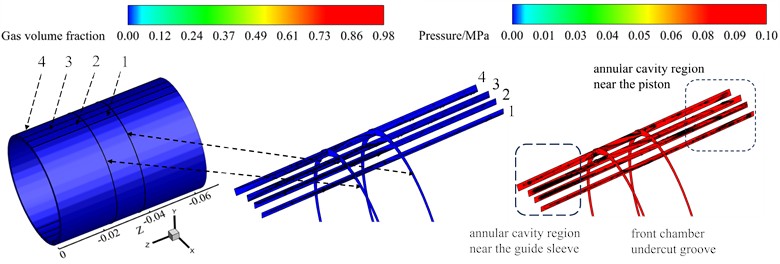
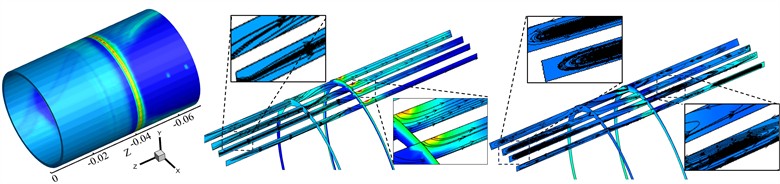
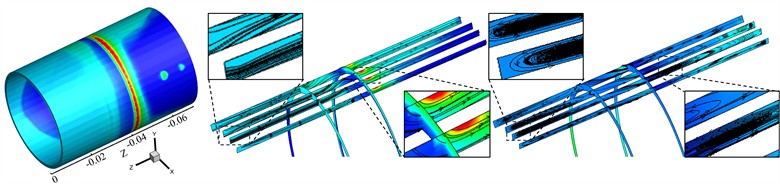
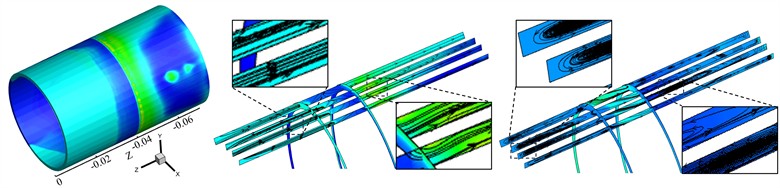
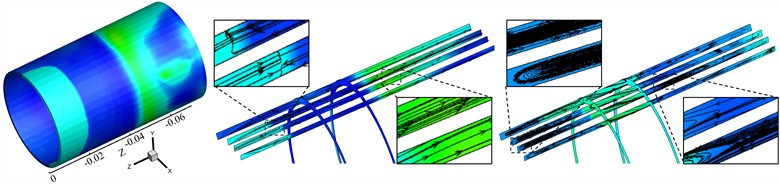
Fig. 8 shows the instantaneous cavitating flow field in the impact system during the piston return-stroke braking. Fig. 9 presents the evolution of the front-chamber flow-field parameters extracted at eight instants ( to ) within the period from 0.03573 s to 0.04084 s, namely at 0.03609 s, 0.03662 s, 0.03726 s, 0.03825 s, 0.03863 s, 0.03922 s, 0.03970 s, and 0.04019 s. For clarity, four axial cross-sections of the front-chamber flow field were taken by rotating the reference plane clockwise about the -axis by 60°, 70°, 80°, and 105°, respectively. These sections were labeled as Sections 1 to 4, as shown in Figs. 8-9. In Fig. 9, (a) shows the contour of gas volume fraction in the annular region of the piston front chamber, (b) presents the gas volume fraction contours, streamlines, and close-up views for the four sections, and (c) displays the pressure contours, vortex lines, and close-up views for the same four sections.
Based on Figs. 7 and 9, the evolution of cavitation in the front chamber is analyzed as follows:
At time , which corresponds to the return-stroke shifting of the control valve, the valve spool is about to move past the neutral dead zone. The impact piston is in the final stage of return-stroke acceleration at this instant. The flow field in the front annular chamber exhibits high pressure, and no cavitation occurs.
At time , which corresponds to the early stage of the piston’s return-stroke braking, the gas volume fraction in the front chamber reaches a high level, indicating that cavitation is already present. As can be seen in Fig. 9(a), the cavitation zone in the front chamber can be divided into three main regions based on the undercut groove: the annular cavity near the guide sleeve, the right corner of the undercut groove, and the annular cavity close to the piston. Comparatively, the region at the right corner of the undercut groove exhibits a higher gas volume fraction and more intense cavitation. As shown in Figs. 9(b) and (c), the cavitation zones coincide spatially with the low-pressure regions. The streamline plot in Fig. 9(b) reveals that the flow velocity direction in the annular cavity near the guide sleeve is aligned with the piston’s return-stroke velocity, which impedes oil replenishment toward this region. Therefore, insufficient oil supply at the bottom of the annular cavity is the primary cause of the low pressure and consequent cavitation near the guide sleeve. In contrast, the flow velocity direction in the annular cavity close to the piston is also aligned with the piston’s return-stroke velocity, which promotes oil replenishment into this zone, resulting in relatively weaker cavitation there. As shown in the pressure contour and vortex-line plots in Fig. 9(c), vortical flow occurs locally in certain cross-sections of the front chamber. The positions of the vortex cores coincide with those of the low-pressure zones and the cavitation regions, indicating that the flow structure in the front chamber is complex and that cavitation in this flow field is also influenced by vortical motion.
At time , which corresponds to the mid-stage of the piston’s return-stroke braking, the gas volume fraction in the front chamber continues to increase. The locations of the cavitation zones remain consistent with those at , and the distribution characteristics of the flow-field parameters are also similar to those at . However, at the cavitation zones expand further and the cavitation intensity becomes higher. At the right corner of the undercut groove, the abrupt contraction of the flow cross-section and the flow direction change as oil flows from the groove into the annular cavity cause a rise in local velocity and a further pressure drop, resulting in the strongest cavitation here. Moreover, the pressure at this location at is lower than that at , and the low-pressure zone along the axial direction is wider. In addition, at the axial downstream region of the right corner of the undercut groove exhibits an increased pressure, creating an adverse pressure gradient, which induces flow separation. The vapor bubbles occupy the annular cross-sectional area, thereby further reducing the effective flow area. This impedes oil replenishment into the annular cavity near the piston, and consequently intensifies cavitation in that region.
At time , which corresponds to the final stage of the piston’s return-stroke braking, the piston velocity is approximately 0.62 m/s. The distribution characteristics of the flow-field parameters and the cavitation mechanism are similar to those observed at and . Compared with the two preceding instants, the cavitation extent and intensity in both the annular cavity near the guide sleeve and the annular region close to the piston end increase slightly at . At the right corner of the undercut groove, the cavitation zone widens, but its intensity diminishes.
At time , following return-stroke braking, the piston speed gradually drops to 0 m/s. The expansion rate of the front chamber decreases, correspondingly reducing its demand for replenishment oil. As shown in the sectional streamline plot in Fig. 9(b), a distinct forward flow along the positive ‑axis emerges locally within the annular cavity near the guide sleeve. This facilitates oil replenishment, leading to a relatively rapid recovery of the local pressure. Consequently, the cavitation zone in this region shrinks and weakens. The location of cavitation coincides with the vortex‑core region in Fig. 9(c), indicating that cavitation here is primarily governed by the vortical flow structure. At the right corner of the undercut groove, cavitation weakens as the main flow velocity decreases and the pressure recovers. The resulting reduction in the adverse pressure gradient diminishes the flow separation and the occupation of the effective flow cross section by vapor bubbles. This improves oil replenishment into the annular cavity near the piston, where pressure rises and cavitation intensity decreases accordingly. The local cavitating flow in this region is also governed by the vortical flow structure.
At time , which corresponds to the initial stage of the forward stroke, the reverse motion of the piston reduces the volume of the front chamber. By this instant, cavitation in the annular cavity near the guide sleeve has largely subsided. At the interface between the downstream side of the undercut groove and the annular cavity close to the piston, the inertia of the oil flow causes the fluid velocity direction to oppose the piston motion, resulting in strong flow turbulence. The cavitating flow field in this area, still governed by the vortical structure, diminishes relatively slowly.
At times and , the piston forward-stroke velocities are 1.65 m/s and 2.62 m/s, respectively. The increase in stroke velocity raises the rate of change of the front-chamber volume, thereby accelerating the recovery of pressure in the front chamber. As a result, both the extent of the vapor-bubble zone and the intensity of cavitation decrease markedly and eventually diminish completely.
Fig. 10 shows physical images of cavitation erosion on the piston rod surface and the guide sleeve end face of the dual‑chamber‑controlled hydraulic rock drill. As can be observed from the figure, cavitation erosion damage on the end face of the guide sleeve is more severe than that on the piston rod surface. This is primarily attributed to the fact that the depth of cavitation pits exhibits a strong negative correlation with the hardness and yield strength of the material [22]. Accordingly, the copper-alloy guide sleeve demonstrates inferior cavitation erosion resistance compared with the alloy-steel piston rod. Meanwhile, the cavitation erosion on the piston rod surface is divided into two distinct zones relative to the undercut groove: the region near the guide sleeve and the region near the piston. The locations of the erosion damage coincide well with the cavitating flow fields obtained from the fluid‑structure coupling simulation. The severe cavitation erosion in the piston side region of the rod is directly associated with the high cavitation zone in the flow field, which further validates the effectiveness of the fluid‑structure coupling computational approach.
Fig. 9Contours of gas volume fraction and pressure, streamlines, and vortex lines in the piston front chamber
a) At time (0.03609 s)
b) At time (0.03662 s)
c) At time (0.03726 s)
d) At time (0.03825 s)
e) At time (0.03863 s)
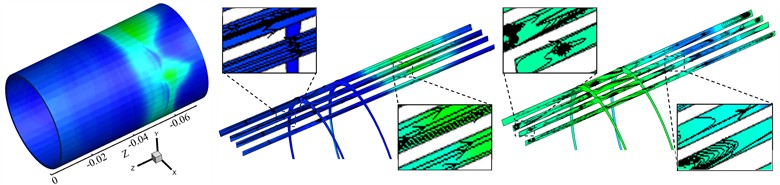
f) At time (0.03922 s)
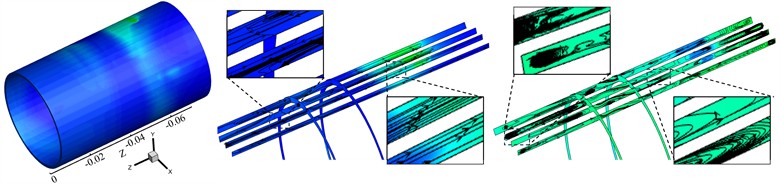
g) At time (0.03970 s)
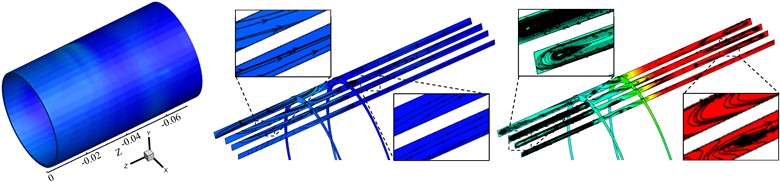
h) At time (0.04019 s)
Fig. 10Cavitation of the guide sleeve end face and the piston rod surface. Photo by Haonan Wang in January 2026 in Lanzhou University of Technology, China
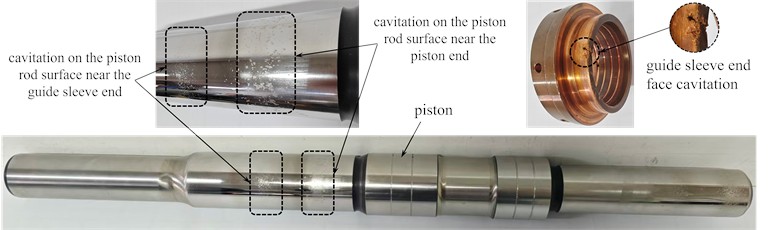
The gas volume fraction in the near-wall fluid domain reflects the cavitation intensity of the flow field and can be used to identify cavitation erosion-prone regions on the solid wall. However, the severity of cavitation erosion damage is directly correlated with bubble collapse pressure, collapse frequency, cumulative wall vapor exposure, and the mechanical properties of the material. Therefore, the degree of cavitation erosion damage cannot be quantitatively determined solely on the basis of the gas volume fraction.
7. Conclusions
This study investigated the fluid-structure coupling numerical simulation method for the impact system of a dual-chamber-controlled hydraulic rock drill. Under the rated pressure of 18 MPa, the spatio‑temporal evolution of the flow field in the self‑feedback valve‑controlled cylinder impactor was obtained, and the dynamic evolution mechanism of cavitation in the piston front chamber was systematically analyzed. The main conclusions are as follows:
1) Cavitation in the front chamber of the impact piston consists of two stages: return-stroke cavitation and forward-stroke cavitation. The total cavitation duration accounts for about 24 % of one impact cycle, and the cavitation intensity is non-uniformly distributed. Cavitation during the return stroke is significantly more intense than during the forward stroke, as evidenced by a higher gas volume fraction and a faster evolution rate.
2) The cavitation zone in the front chamber of the impact piston can be broadly divided into three regions relative to the undercut groove: the annular cavity near the guide sleeve, the right corner of the undercut groove, and the annular cavity close to the piston. Cavitation is most pronounced at the corner of the undercut groove due to the combined effects of a sudden change in the flow cross section, increased local velocity, and flow separation and vortices caused by the adverse pressure gradient. Comparison with physical images of cavitation erosion on the piston rod surface and the guide sleeve end face shows that the locations of erosion damage correspond well with the cavitation flow fields obtained from the fluid‑structure coupling simulation. The severe erosion on the piston side region of the rod is directly linked to the high cavitation zone in the flow field.
3) The evolution of the cavitating flow field in the front chamber is relatively complex, and the influencing mechanisms of cavitation differ across stages and locations. Initial cavitation during the return-stroke braking phase primarily originates at the corner of the undercut groove in the front-chamber main oil passage and at the bottom of the annular cavity near the guide sleeve. Cavitation in the guide sleeve annular region is mainly caused by insufficient oil replenishment resulting from the opposing directions of the main flow and the replenishment flow, leading to a less intensive evolution process. In contrast, bubble development at the corner of the undercut groove is intensified by the reduction in flow cross section and the consequent local velocity increase, together with flow separation and vortices induced by the adverse pressure gradient in the flow field, making the cavitation evolution more vigorous in this region. At the initial stage of the forward-stroke acceleration, the reversed motion of the piston accelerates oil replenishment and pressure recovery in the annular cavity near the guide sleeve, leading to relatively rapid bubble dissipation. Meanwhile, in the region at the interface between the downstream side of the undercut groove and the annular cavity close to the piston, the inertia of the oil flow gives rise to intense flow turbulence. Consequently, the cavitating flow field in this area, which remains governed by the vortical structure, dissipates at a slower rate.
References
-
Z. Liu, Y. F. Li, H. Hu, and J. Liu, “Simulation and experimental study on impact performance of hydraulic rock drill,” (in Chinese), Machine Tool and Hydraulics, Vol. 49, No. 14, pp. 66–70, Jul. 2021, https://doi.org/10.3969/j.issn.1001-3881.2021.14.013
-
W. S. Ding and T. Qing, “Analysis of transient impact dynamic characteristics of rock drill,” (in Chinese), Journal of Vibration and Shock, Vol. 40, No. 23, pp. 1–8, Dec. 2021, https://doi.org/10.13465/j.cnki.jvs.2021.23.001
-
Z. Yang, J. Li, and G. Yu, “Influence of piston mass and working pressure on the impact performance of a hydraulic rock drill using the stress wave method,” Machines, Vol. 11, No. 11, p. 987, Oct. 2023, https://doi.org/10.3390/machines11110987
-
Y. Li, “Research on the matching of impact performance and collision coefficient of hydraulic rock drill,” Shock and Vibration, Vol. 2021, No. 1, p. 6651860, Mar. 2021, https://doi.org/10.1155/2021/6651860
-
J. Seo, D.-K. Noh, G.-H. Lee, and J.-S. Jang, “A percussion performance analysis for rock-drill drifter through simulation modeling and experimental validation,” International Journal of Precision Engineering and Manufacturing, Vol. 17, No. 2, pp. 163–170, Feb. 2016, https://doi.org/10.1007/s12541-016-0021-0
-
W. Ma, X. Geng, C. Jia, L. Gao, Y. Liu, and X. Tian, “Percussion characteristic analysis for hydraulic rock drill with no constant-pressurized chamber through numerical simulation and experiment,” Advances in Mechanical Engineering, Vol. 11, No. 4, p. 1687814019841486, Apr. 2019, https://doi.org/10.1177/1687814019841486
-
X. G. Geng, F. Ma, W. Ma, Z. H. Zhou, and Y. C. Liu, “Experimental on impact powerless of heavy hydraulic rock drill with double damper system,” (in Chinese), Journal of Vibration and Measurement and Diagnosis, Vol. 38, No. 5, pp. 1051–1056+1087, Oct. 2018, https://doi.org/10.16450/j.cnki.issn.1004-6801.2018.05.027
-
X. G. Geng et al., “Characteristic analysis and experiments of double damper systems for heavy hydraulic rock drills,” (in Chinese), Journal of Vibration and Shock, Vol. 39, No. 12, pp. 227–234, Jun. 2020, https://doi.org/10.13465/j.cnki.jvs.2020.12.031
-
V. Barzdaitis, P. Mažeika, M. Vasylius, V. Kartašovas, and A. Tadžijevas, “Investigation of pressure pulsations in centrifugal pump system,” Journal of Vibroengineering, Vol. 18, No. 3, pp. 1849–1860, May 2016, https://doi.org/10.21595/jve.2016.15883
-
S. C. Hu and M. Li, “Functions and fault analysis of Atlas Copco, 1838ME rock drills,” (in Chinese), Construction Machinery and Maintenance, Vol. 2015, No. 7, pp. 96–98, Jul. 2015.
-
Y. H. Fu, Z. X. Lu, Y. L. Li, and Z. H. Zhou, “Existing circumstances of design and research on hydraulic rock drill and related opinions in China,” (in Chinese), Rock Drilling Machinery and Pneumatic Tools, Vol. 2013, No. 4, pp. 1–6, Nov. 2013.
-
X. G. Geng, F. Ma, Z. H. Zhou, R. Guo, and W. Ma, “Cavitation mechanism for hydraulic rock drill with no constant-pressurized chamber,” (in Chinese), Journal of China Coal Society, Vol. 41, No. S2, pp. 563–570, Dec. 2016, https://doi.org/10.13225/j.cnki.jccs.2016.0710
-
H. Q. Chai, G. L. Yang, H. S. Su, and L. Deng, “Visual analysis of cavitation inside hydraulic stone crusher,” (in Chinese), Journal of Vibration and Shock, Vol. 41, No. 21, pp. 140–147+167, Nov. 2022, https://doi.org/10.13465/j.cnki.jvs.2022.21.016
-
L. Deng, G. L. Yang, H. Q. Chai, C. Yang, and G. X. Bai, “Analysis of internal flow characteristics of hydraulic impactor,” (in Chinese), Chinese Hydraulics and Pneumatics, Vol. 45, No. 8, pp. 115–121, Aug. 2021.
-
H. Ding, F. C. Visser, Y. Jiang, and M. Furmanczyk, “Demonstration and validation of a 3D CFD simulation tool predicting pump performance and cavitation for industrial applications,” Journal of Fluids Engineering, Vol. 133, No. 1, pp. 1–14, Jan. 2011, https://doi.org/10.1115/1.4003196
-
A. K. Singhal, M. M. Athavale, H. Li, and Y. Jiang, “Mathematical basis and validation of the full cavitation model,” Journal of Fluids Engineering, Vol. 124, No. 3, pp. 617–624, Sep. 2002, https://doi.org/10.1115/1.1486223
-
J. S. Wang et al., “Analysis of cavitation phenomenon on the surface of distributor of closed swash plate axial piston variable pump,” (in Chinese), Journal of Lanzhou University of Technology, Vol. 48, No. 1, pp. 59–64, Feb. 2022.
-
W. Huang, “Measure and numerical simulation of transient pressure in piston cavity of swash plate axial piston pump,” Lanzhou University of Technology, Lanzhou, China, Apr. 2023.
-
Q. H. He, Research and Design of Hydraulic Impact Mechanism. Changsha, China: Central South University Press, 2009, pp. 22–24.
-
“Rock drilling machines and pneumatic tools-measurement of impact energy and impact frequency,” International Organization for Standardization, Geneva, ISO 2787-1984, 1984.
-
“Test methods of performance for rock drilling machines and pneumatic tools,” Standards Press of China, Beijing, GB/T 5621-2008, 2008.
-
Y. Liu et al., “Cavitation erosion on different metallic materials under high hydrostatic pressure evaluated with the spatially confined sonoluminescence,” Ultrasonics Sonochemistry, Vol. 107, p. 106920, May 2024, https://doi.org/10.1016/j.ultsonch.2024.106920
About this article

This study was supported by the Technology Innovation Guidance Program of Gansu Province (Grant No. 22CX8GA119), the Major Projects of Gansu Province Science and Technology (Grant No. 22ZD6GE066).
The datasets generated during and/or analyzed during the current study are available from the corresponding author on reasonable request.
Jiansen Wang: conceptualization, methodology, writing-original draft preparation, writing-review and editing, funding acquisition. Haonan Wang: writing-original draft preparation, formal analysis, investigation, visualization, software. Shaojun Liu: resources, validation. Hongliang Yan: visualization, software. Xin Zhang: investigation. Bin Liu: resources. Liejiang Wei: supervision.
The authors declare that they have no conflict of interest.

