Abstract
Mechanical differentials are widely used in automotive, agricultural machineries and heavy industry applications due to their large transmission ratio, strong load-bearing capacity and high transmission efficiency. The tough operation conditions of heavy duty and intensive impact load may cause damage, hence condition monitoring of these machines is very important. This paper proposes a data driven model-based condition monitoring scheme that is applied to differential. The scheme is based upon a fuzzy inference system (FIS) in combination with decision trees. To achieve this objective, the acoustic signals from a microphone were captured for the following conditions: Health, bearing fault, worn pinion, broken pinion, worn cranwheel and broken cranwheel for tow working levels of differential (1500 and 3000 r/min). Taken signals were in time domain and for extraction more information was converted from time domain to time-frequency domains using wavelet transformation. Subsequently, statistical features were extracted from signals using descriptive statistic parameters, better features were selected by J48 algorithm and used for developing decision trees. In the next stage, fuzzy logic rules were written using the decision tree and fuzzy inference engines were produced. In order to evaluate the proposed J48-FIS model, the data sets obtained from acoustic signals of the differential were used. The total classification accuracy for 1500 and 3000 r/min conditions were 92.5 % and 95 %, respectively, so the work conducted has demonstrated the potential of used method to classify the fault conditions which are represent in differential.
1. Introduction
Differentials are widely used in power transfer systems. They are typical rotating machinery, consisting of rotating parts. Furthermore, the environment in which they operate is very arduous and they bear heavy loads when they are in operation. Early detection of the defects, therefore, is crucial to prevent the system from malfunction that could cause damage or entire system halt. Diagnosing a gear system by examining the acoustic signals is one of common methods for detecting failures. The conventional methods for processing measured data contain the frequency domain technique, time domain technique, and time-frequency domain technique. These methods have been widely employed to detect gear failures [1-3]. Also condition diagnosis depends largely on the feature analysis of acoustic signals measured for condition diagnosis, so it is important that the feature of the signal be extracted appropriately when a fault occurs at the state change of a machine.
The signatures acquired through an acoustic sensor needed further processing and classification of the data for any meaningful surveillance of the condition of the system being monitored. Artificial neural network (ANN), support vector machine (SVM) and Fuzzy classifier are widely used as classification tool and reported in literature [4-12]. Among them, ANN has limitations on generalization of the results in models that can over fit the data [13, 14]. SVM has high classification accuracy and good generalization capabilities for crisp data [15, 16]. In the problem at hand, the nature of the fault itself is fuzzy in nature. Fuzzy classifier models the physical problem under study more closely. Several researchers [17-23] have proposed fault detection and diagnosis approaches based on a fuzzy system. The fuzzy system is a rule-based approach where the rule set is usually learned from an expert’s experience or prior knowledge of the system. The process of fault detection can be seen as a classification problem and hence the fuzzy system acts as a classifier to distinguish different faults according to its rules. The success of the fault detection process thus depends on the accuracy of the fuzzy rules. Typically, fuzzy rules are generated by intuition and expert’s knowledge.
The above studies have provided critical insight on fault diagnosis of differential. In this study, the decision tree is utilized as a feature selection procedure to remove irrelevant features for the purpose of reducing the amount of data needed to achieve good learning, classification accuracy, a compact and easily understood knowledge-base, and a reduction in computational time. The proposed approach consists of two stages: First, the decision tree is performed as a feature selection tool to obtain the valuable features and to identify the structure of the classifier in the next iterative step. Second, the fuzzy logic classifier is used to diagnose the faults of the differential.
2. Material and methods
In this research fault diagnosis of differential was done using acoustic signals. Descriptions of diagnostic model have been represented in Sections 2.1 to 2.4.
2.1. Experimental setup and data acquisition
For this work, at first a test bed was built to mount the differential and electromotor on it. The 2 KW electromotor was used to drive power to the differential using a coupling power transmission. The input shaft of differential was drove by the electromotor and its speed was controlled by an inverter. The experiment setup is shown in Fig. 1.
Six classes were classified in this work, namely, healthy differential ‘H’, worn cranwheel ‘W-C’, worn pinion ‘W-P’, broken cranwheel ‘B-C’, broken pinion ‘B-P’ and bearing fault ‘B-F’ that each class considers a type of fault as a most common fault of differential. Then the acoustic signals were collected by a microphone that set vertically on the surface of differential. It should be noted that data collection was performed in a quiet environment. Table 1 shows the specification of used microphone. The microphone is connected to the signal acquisition unit (Easy-Viber), where the signal goes through the charge amplifier and an analogue-to-digital converter (ADC). Microphone and signal acquisition unit have been shown in Fig. 2. The acoustic signal in digital form is fed to the computer through a USB port. The software ‘SpectraPro-4’ that accompanies the signal conditioning unit is used for recording the signals directly in the computer’s secondary memory. The data were acquired from differential in six mentioned states. Tow working levels of differential speed (1500 and 3000 rpm) were considered as test conditions.
Fig. 1Experimental set up
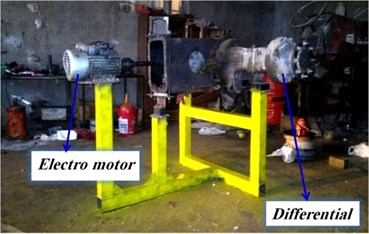
Fig. 2Microphone and signal acquisition unit
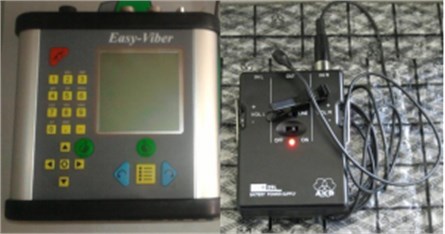
Table 1Specifications of microphone used for this project
Model | AKB-c417 |
Kind | Pre-polarized condenser |
Domain of frequency | 20 Hz-20 KHz |
Sensitivity | 10 Mv/Pa |
Electrical resistance | 200 Ω |
Ratio of signal to noise | 60 Db |
Ability of sound record | 126 Db |
2.2. Signal processing and feature extraction
In recent articles, advanced non-parametric approaches have been considered for signal processing such as wavelets, Fast Fourier Transform (FFT), short time Fourier transform (STFT) [24, 25]. Acoustic measurements obtained from the machine usually contain a lot of useful information, but also noise components which should be eliminated from the signal before the information is used for the classification of machine condition and maintenance planning. In order to solve this problem, time domain signals must transmit to frequency domain or time-frequency domain. As a result, this action removes noises, as it allows to acquire more useful data. In this study wavelet signal processing technique was employed to transfer the acoustic signals from time domain to time-frequency domain. Wavelet coefficients could not be used directly as inputs of classifier and a post process stage is needed to prepare data for classifier. Therefore, twenty-nine features were extracted from the wavelet coefficients using statistical parameters. For more information about the used features [26].
2.3. Construct decision tree
A ‘divide-and-conquer’ approach to the problem of learning from a set of independent instances leads naturally to a style of representation called a decision tree. A decision tree is a decision support tool that uses a tree-like graph or model of decisions and their possible consequences, including chance event outcomes, resource costs, and utility. It is one way to display an algorithm. Decision trees are commonly used in operations research, specifically in decision analysis, to help identify a strategy most likely to reach a goal. A decision tree is a flowchart-like structure in which each internal node represents a “test” on an attribute, each branch represents the outcome of the test and each leaf node represents a class label (decision taken after computing all attributes). The paths from root to leaf represent classification rules.
Decision trees were constructed by J48 algorithm in this research. J48 is an open source Java implementation of the C4.5 algorithms in the Weka data mining tool. C4.5 is a program that creates a decision tree based on a set of labeled input data. This algorithm was developed by Ross Quinlan. The decision trees generated by C4.5 can be used for classification, and for this reason, C4.5 is often referred to as a statistical classifier [27, 28]. Input to the J48 algorithm was the set of statistical features extracted from acoustic signatures. The data sets of the features for each condition have 70 samples, that two-thirds of samples (about 50 samples for each condition of differential) are employed for the training process and the remaining samples (about 20 samples for each condition of differential) for testing purposes. Various statistical parameters are selected for the various conditions of the differential based on the output of the J48 algorithm. These selected features construct decision tree and are used as membership functions.
2.4. Using fuzzy inference system for fault diagnosis
A fuzzy logic system is a nonlinear input output mapping of a vector of features into a scalar result. These systems are generally regarded as being proficient at translating expert system insight into a mathematical formulation. This ability to handle imprecision of input and output variables directly by defining them as fuzzy sets, which can be described using linguistic variables, makes fuzzy logic a good method for handling system uncertainty and for use with systems where the inputs are comprised of sets lacking clear crisp boundaries. As rules, linguistic terms are used and are modelled through membership functions that represent simulation of the comprehension of an expert. Membership functions give the scaled value of definite number values that are defined by linguistic labels. The point of fuzzy logic is to map an input space to an output space, and the primary mechanism for doing this is a list of ‘if-then’ statements called rules. Rules are the inputs for building a fuzzy inference engine. After defining membership functions and generating the ‘if-then’ rules by J48 algorithm, the next step is to build the fuzzy inference engine. The fuzzy toolbox available in MATLAB (version: 2011a) was used for building the fuzzy inference engine. Each rule was taken at a time and using membership functions and fuzzy operators the rules were entered [27].
3. Results and discussion
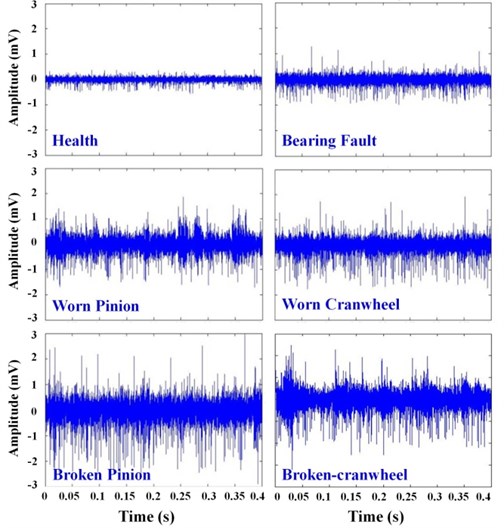
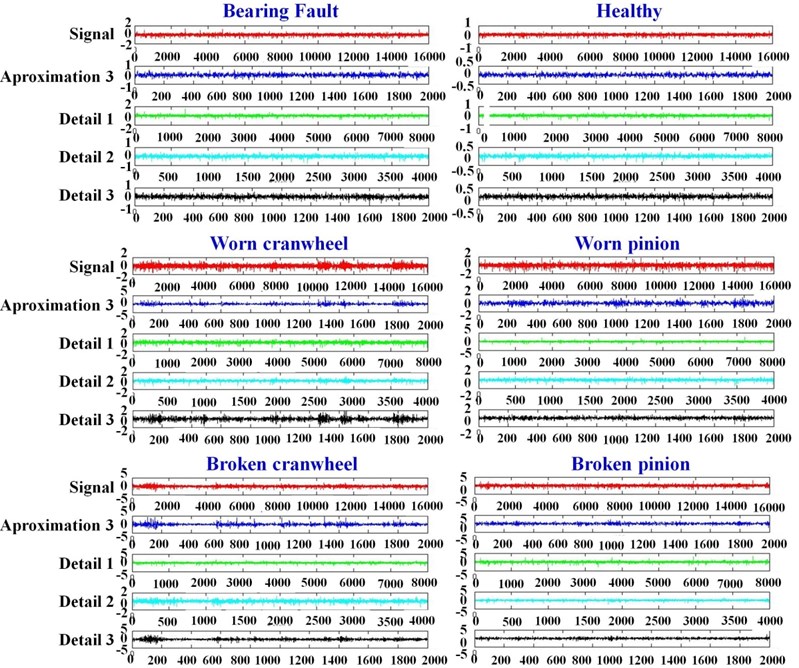
The purpose of the present work is the fault detection of the mechanical differential. To carry out this aim, the fault diagnosis system which consists of a combination of signal processing and classification techniques was used. Figs. 3 and 4 show the graphs of acoustic signal acquired for various experimental conditions of the differential in time domain for speeds 1500 and 3000 rpm. According to Figs. 3, 4, it is obvious that the acoustic amplitude value is increased when worn and breakage occurs in pinion and cranwheel, also acoustic amplitude value is increased by increasing the working speed. Fig. 5 shows graphs of acoustic signal in time-frequency domain for 1500 rpm rotational speed. It can be seen that it is difficult to discriminate different conditions of differential by graphs, so it is necessary to use the proposed intelligent procedure for differential fault diagnosis.
Fig. 3The graphs of acoustic signal acquired for various experimental conditions of the differential in time domain for 1500 rpm rotational speed
3.1. Decision trees
Decision trees were constructed by J48 algorithm. J48 algorithm (A WEKA implementation of c4.5 Algorithm) is a widely used one to construct Decision Trees as explained by Sugumaran, Muralidharan, and Ramachandran (2006) [29]. Figs. 6 and 7 depict the results of the J48 algorithm. Decision trees expose the relation between characteristics and the condition of the differential. Tracing a branch from the root node leads to a condition of the differential and decoding the information available in a branch in the form of the ‘if-then’ statement gives the rules for classification using fuzzy for various conditions of differential. Hence, the usefulness of the decision tree in forming the rules for fuzzy classification is proved. The best node of the decision tree for classification is the top one. The other features appear in the nodes of the decision tree in reducing order of importance. It is necessary to emphasize that just features that contribute to classification appear in the decision tree. The importance and contribution of all statistical features is not equal. The contribution level of each feature is given by a statistical measure within the parenthesis in the decision tree. The first number in the parenthesis pointes the number of data points that can be classified using that feature set. The second number pointes the number of samples against this action. If the first number is so small compared to the total number of samples, then the relevant features can be considered as outliers and accordingly disregarded. Features that have less discriminating capability can be consciously deserted by deciding on the threshold. This concept is used in selecting good features. The algorithm recognizes the good features for the classification from the given training data set and thus descends the domain knowledge required to select good features for the pattern classification problem.
Fig. 4The graphs of acoustic signal acquired for various experimental conditions of the differential in time domain for 3000 rpm rotational speed
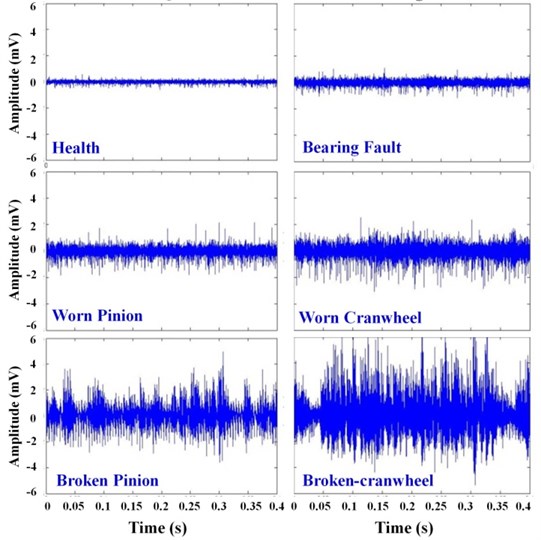
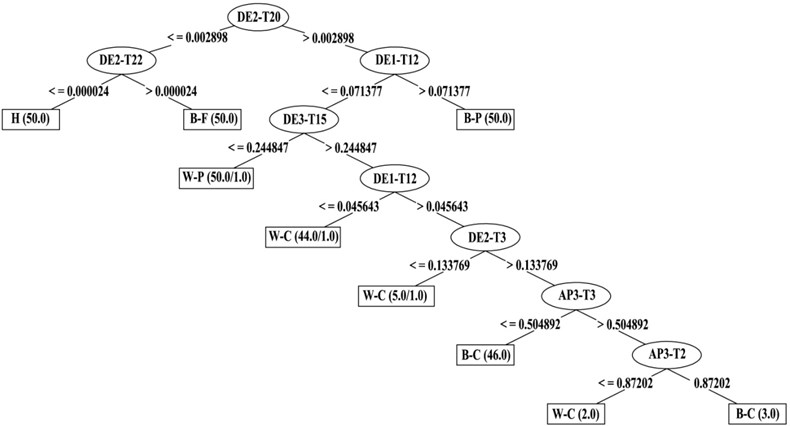
Fig. 6 shows Decision tree for 1500 rpm rotational speed, this figure shows that features DE2-T20 (fourth central moment of detail 2 from signal in time-frequency domain), DE2-T22 (sixth central moment of detail 2 from signal in time-frequency domain), DE1-T12 (variance of detail 1 from signal in time-frequency domain), DE3-T15 (normal deviance from average of detail 3 from signal in time-frequency domain), DE2-T3 (square of mean root of signal of detail 2 from signal in time-frequency domain), AP3-T3 (square of mean root of approximation 3 from signal in time-frequency domain) and AP3-T2 (standard deviation of approximation 3 from signal in time-frequency domain) are good features for the purpose of classification [27, 28]. The feature DE2-T20 of the decision tree is the best feature for classification. The other features appear in the nodes of the decision tree in descending order of importance. Decoding the information available in every branch in the form of the ‘if-then’ statement gives the fuzzy rules for classification various conditions of differential.
Fig. 5Graphs of acoustic signal in time-frequency domain for 1500 rpm rotational speed
Also Fig. 7 shows Decision tree for 3000 rpm rotational speed, this figure shows that features DE2-T20 (fourth central moment of detail 2 from signal in time-frequency domain), DE2-T22 (sixth central moment of detail 2 from signal in time-frequency domain), AP3-T21 (fifth central moment of approximation 3 from signal in time-frequency domain), DE1-T2 (standard deviation of detail 1 from signal in time-frequency domain), DE1-T15 (normal deviance from average of detail 1 from signal in time-frequency domain) and DE2-T6 (third central moment divided by cube of average of detail 2 from signal in time-frequency domain) are good features for the purpose of classification.
3.2. Confusion matrices of decision trees
According to section 2.3 two-thirds of samples (300 samples or 50 samples for every condition of differential) were used for producing and training decision tree, in the next step a 10-fold cross-validation evaluation was applied for determination of classification accuracy of decision tree. Obtained classification results or confusion matrices have been presented in Tables 2 and 3. Each cell in a confusion matrix contains the number of samples that was classified corresponding to actual algorithm outputs. The diagonal elements in the confusion matrix show the number of correctly classified instances. As tables show the total classification accuracy of decision trees for 1500 and 3000 rpm conditions were:
Table 2Confusion matrices of decision trees for 1500 rpm rotational speed of differential
Condition | B-F | B-C | B-P | H | W-C | W-P |
B-F | 47 | 0 | 0 | 0 | 0 | 3 |
B-C | 0 | 44 | 1 | 0 | 5 | 0 |
B-P | 0 | 0 | 50 | 0 | 0 | 0 |
H | 1 | 0 | 0 | 49 | 0 | 0 |
W-C | 0 | 4 | 0 | 0 | 43 | 3 |
W-P | 0 | 0 | 0 | 0 | 2 | 48 |
Table 3Confusion matrices of decision trees for 3000 rpm rotational speed of differential
Condition | B-F | B-C | B-P | H | W-C | W-P |
B-F | 49 | 0 | 0 | 0 | 0 | 1 |
B-C | 0 | 48 | 0 | 0 | 2 | 0 |
B-P | 0 | 2 | 48 | 0 | 0 | 0 |
H | 1 | 0 | 0 | 49 | 0 | 0 |
W-C | 1 | 3 | 0 | 0 | 47 | 0 |
W-P | 0 | 0 | 0 | 0 | 2 | 48 |
Fig. 6Decision tree for 1500 rpm rotational speed
3.3. Membership functions
A membership function (MF) is a curve that defines how each point in the input space is mapped to a membership value (or degree of membership) between 0 and 1. Observing the values of the feature, based on which the branches of the decision tree are created for different conditions of the differential, the membership functions for the corresponding features are defined.
According to Fig. 6 it is obvious that features DE2-T20, DE2-T22, DE1-T12, DE3-T15, DE1-T12, DE2-T3, AP3-T3, AP3-T2 play decisive roles in fault diagnosis of differential faults in 1500 rpm rotational speed. Designing membership functions for the fuzzy classifier are done by output of the decision tree. Figs. 8 and 9 show samples of membership functions, as these figures show trapezoidal membership function is used for present study. The selection of this membership function is to some extent arbitrary. However, the following points were considered while selecting the membership function. Observing the values of the feature, based on which the branches of the decision tree are created, the membership functions for all 8 features are defined.
Fig. 7Decision tree for 3000 rpm rotational speed
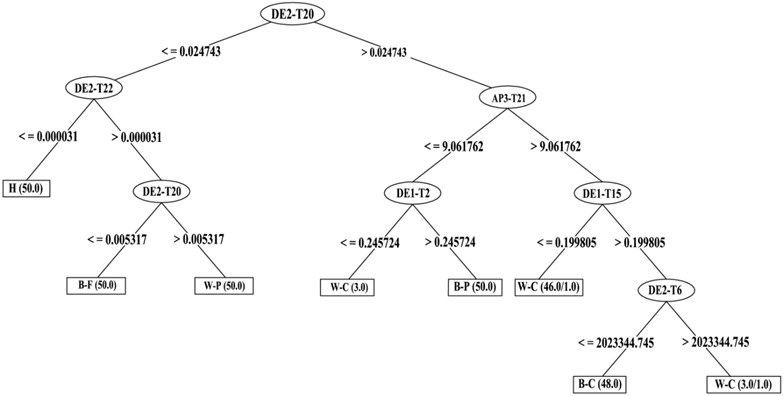
Fig. 8Member function for T20 feature
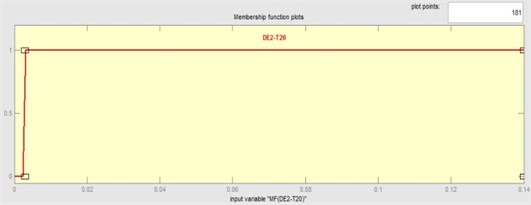
Fig. 9Member function for T15 feature
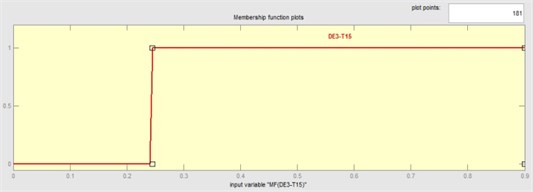
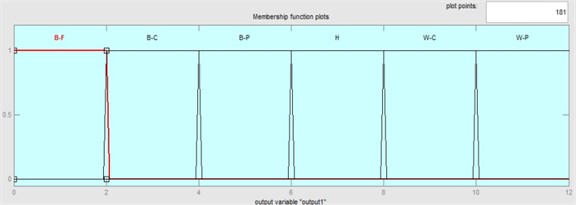
Fig. 6 shows that 0.002898 is a threshold for value of membership of DE2-T20 feature. Up to this threshold value the membership function generates the value ‘0’ and afterwards it increases linearly (assumption). The trapezoidal membership function suits this phenomenon and hence it was selected to map each point in the input space to a membership value (Fig. 8). To review, the threshold values are given by the decision tree and the slope is defined by the user through heuristics. The threshold value (0.244847) is defined based on the representative training dataset (see Fig. 6). If the DE3-T15 feature value is less than or equal to 0.244847, an membership function which is defined on a 0-1 scale gives a value of 0, which means that it is not a DE3-T15. If the threshold value is greater than 0.244847, the membership function generates a value of 1 (Fig. 9). Membership functions for other features are designed accordingly. There are six possible outcomes from a fuzzy classifier, namely: H, B-F, W-P, W-C, B-P, B-C. Hence, six membership functions are defined with equal range as shown in Fig. 10. For 3000 rpm rotational speed membership functions generate like what said for 1500 rpm rotational speed.
Fig. 10Member function for output
3.4. Fuzzy rules
Member functions were used for designing fuzzy rules. In the following the rules designed for 1500 r/min condition have been brought:
1. If (MF(DE2-T20) is not DE2-T20) and (MF(DE2-T22) is not DE2-T22) then (output1 is H) (1);
2. If (MF(DE2-T20) is not DE2-T20) and (MF(DE2-T22) is DE2-T22) then (output1 is B-F) (1);
3. If (MF(DE2-T20) is DE2-T20) and (MF1(DE1-T12) is DE1-T12-1) then (output1 is B-P) (1);
4. If (MF(DE2-T20) is DE2-T20) and (MF1(DE1-T12) is not DE1-T12-1) and (MF(DE3-T15) is not DE3-T15) then (output1 is W-P) (1);
5. If (MF(DE2-T20) is DE2-T20) and (MF1(DE1-T12) is not DE1-T12-1) and (MF(DE3-T15) is DE3-T15) and (MF2(DE1-T12) is not DE1-T12) then (output1 is W-C) (1);
6. If (MF(DE2-T20) is DE2-T20) and (MF1(DE1-T12) is not DE1-T12-1) and (MF(DE3-T15) is DE3-T15) and (MF2(DE1-T12) is DE1-T12) and (MF(DE2-T3) is not DE2-T3) then (output1 is W-C) (1);
7. If (MF(DE2-T20) is DE2-T20) and (MF1(DE1-T12) is not DE1-T12-1) and (MF(DE3-T15) is DE3-T15) and (MF2(DE1-T12) is DE1-T12) and (MF(DE2-T3) is DE2-T3) and (MF(AP3-T3) is not AP3-T3) then (output1 is B-C) (1);
8. If (MF(DE2-T20) is DE2-T20) and (MF1(DE1-T12) is not DE1-T12-1) and (MF(DE3-T15) is DE3-T15) and (MF2(DE1-T12) is DE1-T12) and (MF(DE2-T3) is DE2-T3) and (MF(AP3-T3) is AP3-T3) and (MF(AP3-T2) is not AP3-T2) then (output1 is W-C) (1);
9. If (MF(DE2-T20) is DE2-T20) and (MF1(DE1-T12) is not DE1-T12-1) and (MF(DE3-T15) is DE3-T15) and (MF2(DE1-T12) is DE1-T12) and (MF(DE2-T3) is DE2-T3) and (MF(AP3-T3) is AP3-T3) and (MF(AP3-T2) is AP3-T2) then (output1 is B-C) (1).
In the following the rules designed for 1500 r/min condition have been brought:
1. If (MF1(DE2-T20) is not DE2-T20-1) and (MF(DE2-T22) is not DE2-T22) then (output1 is H) (1);
2. If (MF1(DE2-T20) is not DE2-T20-1) and (MF(DE2-T22) is DE2-T22) and (MF2(DE2-T20) is DE2-T20-2) then (output1 is W-P) (1);
3. If (MF1(DE2-T20) is not DE2-T20-1) and (MF(DE2-T22) is DE2-T22) and (MF2(DE2-T20) is not DE2-T20-2) then (output1 is B-F) (1);
4. If (MF1(DE2-T20) is DE2-T20-1) and (MF(AP3-T21) is not AP3-T21) and (MF(DE1-T2) is DE1-T2) then (output1 is B-P) (1);
5. If (MF1(DE2-T20) is DE2-T20-1) and (MF(AP3-T21) is not AP3-T21) and (MF(DE1-T2) is not DE1-T2) then (output1 is W-C) (1);
6. If (MF1(DE2-T20) is DE2-T20-1) and (MF(AP3-T21) is AP3-T21) and (MF(DE1-T15) is not DE1-T15) then (output1 is W-C) (1);
7. If (MF1(DE2-T20) is DE2-T20-1) and (MF(AP3-T21) is AP3-T21) and (MF(DE1-T15) is DE1-T15) and (MF(DE2-T6) is DE2-T6) then (output1 is W-C) (1);
8. If (MF1(DE2-T20) is DE2-T20-1) and (MF(AP3-T21) is AP3-T21) and (MF(DE1-T15) is DE1-T15) and (MF(DE2-T6) is not DE2-T6) then (output1 is B-C) (1).
3.5. Fuzzy inference engine
After defining membership functions and generating the ‘if-then’ rules, the next step is to build the fuzzy inference engine.
Fig. 11Fuzzy inference engine of differential for 1500 rpm rotational speed
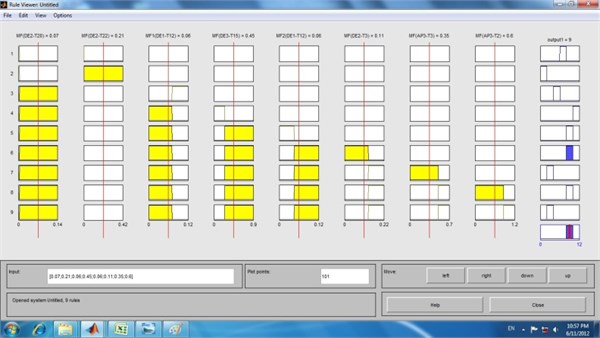
Fig. 12Fuzzy inference engine of differential for 3000 rpm rotational speed
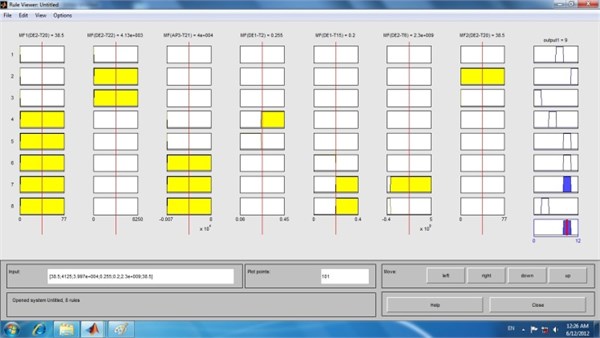
For this purpose the fuzzy toolbox available in MATLAB was used. Fig. 11 shows the fuzzy inference engine of differential for 1500 rpm rotational speed. Each row in the figure corresponds to each rule. The membership functions of DE2-T20, DE2-T22, DE1-T12, DE3-T15, DE1-T12, DE2-T3, AP3-T3, AP3-T2 features have been represented in the first eight blocks in rows. The ninth block corresponds to the membership functions for output as shown in Fig. 10. The rules are tested by sample inputs for features, as follows, for a sample input 0.07 for DE2-T20, 0.21 for DE2-T22, 0.06 for DE1-T12, 0.45 for DE3-T15, 0.11 for DE2-T3, 0.35 for AP3-T3 and 0.6 for AP3-T2 which satisfies the sixth rule completely and the corresponding output condition is W-C, which is shown in the output block of the sixth row in the rule viewer shown in Fig. 11. Also Fig. 12 shows the fuzzy inference engine of differential for 3000 rpm rotational speed.
3.6. Confusion matrix and System accuracy
According to what was mentioned in Section 2.3 the data sets for each condition of differential were 70 samples, that two-thirds of samples were employed for the training process and the remaining samples for testing purposes. In this section selected features of testing data were used for testing the final model. These features were imported to fuzzy inference engine and according to its outputs the confusion matrixes for each conditions of differential were produced (Tables 4 and 5). Sensitivity, specificity and total classification accuracy are statistical parameters for evaluating performance of classifier that are concluded from confusion matrixes. Tables 6 and 7 show the values of these parameters, according to them, total classification accuracy for 1500 and 3000 rpm conditions are 92.5 % and 95 %, respectively.
Table 4Confusion matrices for 1500 rpm rotational speed of differential
Condition | B-F | B-C | B-P | H | W-C | W-P |
B-F | 18 | 0 | 1 | 0 | 1 | 0 |
B-C | 0 | 19 | 0 | 0 | 0 | 1 |
B-P | 2 | 0 | 17 | 0 | 1 | 0 |
H | 0 | 0 | 0 | 19 | 0 | 1 |
W-C | 1 | 1 | 0 | 0 | 18 | 0 |
W-P | 0 | 0 | 0 | 0 | 0 | 20 |
Table 5Confusion matrices for 3000 rpm rotational speed of differential
Condition | B-F | B-C | B-P | H | W-C | W-P |
B-F | 19 | 0 | 0 | 0 | 1 | 0 |
B-C | 0 | 19 | 0 | 0 | 0 | 1 |
B-P | 1 | 0 | 18 | 0 | 1 | 0 |
H | 0 | 1 | 0 | 19 | 0 | 0 |
W-C | 0 | 0 | 0 | 0 | 20 | 0 |
W-P | 0 | 0 | 0 | 1 | 0 | 19 |
Table 6Statistical parameters value for 1500 rpm rotational speed of differential
Label | Sensitivity (%) | Specificity (%) | Total classification accuracy (%) |
B-F | 90 | 98 | 92.5 |
B-C | 95 | 99 | |
B-P | 85 | 97 | |
H | 95 | 99 | |
W-C | 90 | 98 | |
W-P | 100 | 100 |
Table 7Statistical parameters value for 3000 rpm rotational speed of differential
Label | Sensitivity (%) | Specificity (%) | Total classification accuracy (%) |
B-F | 95 | 99 | 95 |
B-C | 95 | 99 | |
B-P | 90 | 98 | |
H | 95 | 99 | |
W-C | 100 | 100 | |
W-P | 95 | 99 |
A few interesting studies regarding condition monitoring and fault diagnosis of differential have been reported recently in the literatures. Saravanan et al. studied vibration-based fault diagnosis of spur bevel gear box using fuzzy technique. A fuzzy classifier was built and tested with representative data. They concluded that diagnosis technique based on the fuzzy logic principle is reliable for the condition recognition of the gearbox [30]. Gharehbolagh et al. investigated fault diagnosis of differential using acoustic signals with discrete wavelet transform and neural network. Their results showed accuracy of neural network technique was 92.6 %, 92.5 % and 90.6 % for training, validation and test dataset, respectively [31].
3.7. Acoustic condition monitoring toolbox
Doing all the above steps for condition monitoring of differential is very difficult especially for a beginner. So a graphical user interface was designed in order to simplify the final model. In this way, even a non-specialist operator can easily use the model to condition monitoring. For this purpose it is just needed to choose his desired rotational speed and then upload time signal acquisitioned from differential and observe the condition of differential as mentioned in Fig. 13.
Fig. 13Acoustic condition monitoring toolbox
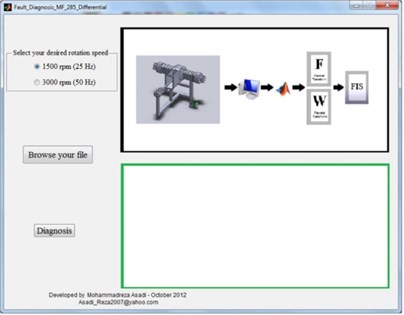
a) Selection of rotational speed
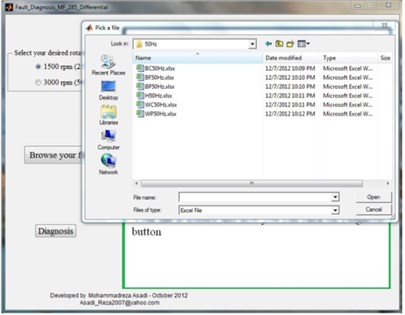
b) Uploading differential time signal
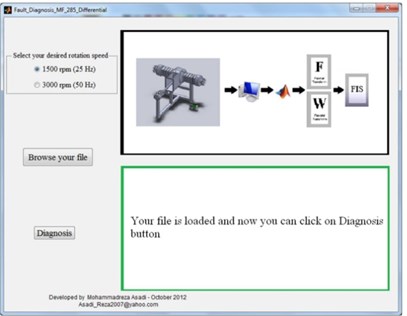
c) Investigating differential condition by choosing diagnosis button
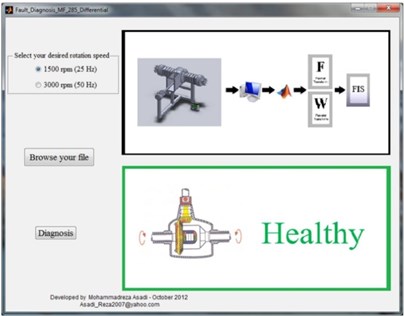
d) Demonstration of differential condition
4. Conclusions
Fault diagnosis of rotating machines is one of the core research areas in the field of condition monitoring. This project proposing the method of the differential fault identification based on decision tree (J48 algorithm) and fuzzy logic technique.
The implementation of J48-FIS based classifier requires two consecutive steps. Firstly, the J48 algorithm is utilized to select the relevant features in the data set obtained from feature extraction part. The output of the J48 algorithm is a decision tree that is employed to produce the crisp if-then rule and membership function sets. Secondly, the structure of the FIS classifier is defined based on the obtained rules, which were fuzzified in order to avoid classification surface discontinuity. The work conducted has demonstrated the potential of used method to classify the fault conditions which are represent in differential. The total classification accuracy for 1500 and 3000 rpm conditions were 92.5 % and 95 % respectively. From the study carried out and presented in this paper, the diagnosis technique based on the decision tree and fuzzy logic principle is found to be practical for the condition recognition of the differential and other rotating machines, as well.
References
-
Zimroz R., Bartkowiak A. Two simple multivariate procedures for monitoring planetary gearboxes in non-stationary operating conditions. Mechanical Systems and Signal Processing, Vol. 38, Issue 1, 2013, p. 237-247.
-
Feng Z., Liang M., Chu F. Recent advances in time-frequency analysis methods for machinery fault diagnosis: A review with application examples. Mechanical Systems and Signal Processing, Vol. 38, 2013, p. 165-205.
-
Lei Y., Lin J., He Z., Zuo M. J. A review on empirical mode decomposition in fault diagnosis of rotating machinery. Mechanical Systems and Signal Processing, Vol. 35, 2013, p. 108-126.
-
Zhanga P., Zhangb R., Ran X. X. Research of fault diagnosis in flight control system based on fuzzy neural network. Procedia Engineering, Vol. 15, 2011, p. 70-74.
-
Bin G. F., Gao J. J., Li X. J., et al. Early fault diagnosis of rotating machinery based on wavelet packets empirical mode decomposition feature extraction and neural network. Mechanical Systems and Signal Processing, Vol. 27, 2012, p. 696-711.
-
Sun Z. W., Shi G., Liu X. P. Structural damage identification method based on IMF model energy feature and BP neural network. International Conference on Intelligence Science and Information Engineering, Vol. 20-21, 2011, p. 206-209.
-
Li H. Bearing fault detection based on instantaneous energy spectrum. Proceedings of the Seventh International Conference on Fuzzy Systems and Knowledge Discovery, Vols. 10-12, 2010, p. 2594-2598.
-
Ai S. F., Li H. Gear fault detection based on ensemble empirical mode decomposition and Hilbert-Huang transform. Proceedings of the 5th International Conference on Fuzzy Systems and Knowledge Discovery, Vol. 18-20, 2008, p. 173-177.
-
Shen Z. X., Huang X. Y., Ma X. X. An intelligent fault diagnosis method based on empirical mode decomposition and support vector machine. Proceedings of the 3rd International Conference on Convergence and Hybrid Information Technology Vol. 11-13, 2008, p. 865-869.
-
Zhou Y. L., Zhao P. Vibration fault diagnosis method of centrifugal pump based on EMD complexity feature and least square support vector machine. Energy Procedia, Vol. 17, 2012, p. 939-945.
-
Lei Y., Lin J., He Zh, Zuo M. J. A review on empirical mode decomposition in fault diagnosis of rotating machinery. Mechanical Systems and Signal Processing, Vol. 35, 2013, p. 108-126.
-
Lei Y., Lin J., Zuo M. J., He Zh Condition monitoring and fault diagnosis of planetary gearboxes: a review. Measurement, Vol. 48, 2014, p. 292-305.
-
Samanta B., Al-Baulshi K. R. Artificial neural network based fault diagnostics of rolling element bearings using time domain features. Mechanical Systems and Signal Processing, Vol. 17, Issue 2, 2003, p. 317-328.
-
Samanta B., Al-Baulshi K. R., Al-Araimi S. A. Artificial neural networks and support vector machines with genetic algorithm for bearing fault detection. Engineering Applications of Artificial Intelligence, Vol. 16, 2003, p. 657-665.
-
Burgess C. J. C. A tutorial on support vector machines for pattern recognition. Data Mining and Knowledge Discovery, Vol. 2, 1998, p. 955-974.
-
Jack L. B., Nandi A. K. Comparison of neural networks and support vector machines in condition monitoring application. Proceedings of COMADEM, 2000, p. 721-730.
-
Üstüntas T., Sahin A. D. Wind turbine power curve estimation based on cluster center fuzzy logic modeling. Journal of Wind Engineering and Industrial Aerodynamics, Vol. 96, 2008, p. 611e20.
-
Barszcz T., Bielecka M., Bielecki A., Wijcik M. Wind turbines states classification by a fuzzy-ART neural network with a stereographic projection as a signal normalization. Lecture Notes in Computer Science (LNCS), Vol. 6594, 2011, p. 225-234.
-
Trana V., Yanga B., Oha M., Tanb A. Fault diagnosis of induction motor based on decision trees and adaptive neuro-fuzzy inference. Expert Systems with Applications, Vol. 36, Issue 2, 2009, p. 1840-1849.
-
Ren Q., Balazinski M., Baron L., Jemielniak K., Botez R., Achiche S. A Type-2 fuzzy tool condition monitoring system based on acoustic emission in micromilling. Information Sciences, Vol. 255, 2014, p. 121-134.
-
Dereli T., Baykasoglu A., Altun K., Durmusoglu A., Turksen I. B. Industrial applications of type-2 fuzzy sets and systems: a concise review. Computers in Industry, Vol. 62, Issue 2, 2011, p. 125-137.
-
Ghosh A., Shekhar Mishra N., Ghosh S. Fuzzy clustering algorithms for unsupervised change detection in remote sensing images. Information Sciences, Vol. 181, Issue 4, 2011, p. 699-715.
-
Melin P., Mendoza O., Castillo O. An improved method for edge detection based on interval type-2 fuzzy logic. Expert Systems with Applications, Vol. 37, Issue 12, 2010, p. 8527-8535.
-
Yang M., Makis V. ARX model-based gearbox fault detection and localization under varying load conditions. Journal of Sound and Vibration, Vol. 329, 2010, p. 5209-5221.
-
Omid M. Design of an expert system for sorting pistachio nuts through decision tree and fuzzy logic classifier. Expert Systems with Applications, Vol. 38, 2011, p. 4339-4347.
-
Lei Y., He Z., Zi Y. A new approach to intelligent fault diagnosis of rotating machinery. Expert Systems with Applications, Vol. 35, 2008, p. 1593-1600.
-
Mollazade K., Ahmadi H, Omid M., Alimardani R. An intelligent model based on data mining and fuzzy logic for fault diagnosis of external gear hydraulic pumps. Intelligent Fault Diagnosis, Insight Vol. 51, Issue 11, 2009.
-
Bhargava N., Sharma G., Bhargava R., Mathuria M. Decision tree analysis on J48 algorithm for data mining. International Journal of Advanced Research in Computer Science and Software Engineering, Vol. 3, Issue 6, 2013, p. 1114-1119.
-
Sugumaran V., Muralidharan V., Ramachandran K. I. Feature selection using decision tree and classification through proximal support vector machine for fault diagnostics of roller bearing. Mechanical Systems and Signal Processing, Vol. 21, 2006, p. 930-942.
-
Saravanan N., Cholairajan S., Ramachandran K. I. Vibration-based fault diagnosis of spur bevel gear box using fuzzy technique. Expert Systems with Applications, Vol. 36, 2009, p. 3119-3135.
-
Maghsoudi Gharehbolagh Gh., Farokhzad S., Asadi Asad Abad M.R., Ranjbarkohan M. Fault diagnosis of crown wheel and pinion in differential using acoustic signals with discrete wavelet transform and neural network. Technical Journal of Engineering and Applied Sciences, Vol. 3, Issue 14, 2013, p. 1358-1364.
About this article

This research work has been extracted from Ph.D. Thesis of Mohammad Reza Asadi entitled “Design, Development and Evaluation of Fault Diagnosis System of Tractor Differential by Acoustic Analysis and Fuzzy Logic Technique” supervisors of this project are Dr. Ali Mohammad Borghei and Dr. Hojat Ahmadi and advisors of this project are Dr. Saeid Minaei and Dr. Babak Beheshti. Also the authors are most grateful to the Department of Mechanics of Agricultural Machinery, Science and Research Branch, Islamic Azad University for supporting this project.
