Abstract
In the typical vibration fatigue problem, the excited structure is usually subjected to variable amplitude loading in the fatigue weakness area, which is of the random nature. The fatigue life estimation under vibratory loads is generally studied in the frequency domain, which does not take into account the sequence or memory effect. Due to high nonlinearity of the fatigue damage evolution, it is difficult but useful to analyze the fatigue process under the vibration loading in the time-domain. In this paper a time-based method is proposed to analyze the fatigue crack growth behavior under variable amplitude loading caused by vibration. This approach is based on our proposed equivalent plastic zone concept and the generalized crack closure model, which is derived from plasticity in the vicinity of crack tip (such as monotonic and reverse plastic zone). The memory or loading interaction effect on the fatigue crack growth can be accounted for well by using the proposed method. A set of experimental data in Al 7075-T6 under “Christmas Tree” loading, a typical vibration loads condition, are used to validate the method. And then additional experimental data in Al 2024-T3 under block loading are also employed for model validation. The predictions have a very good agreement with the testing data, which are also compared with those of NASGRO equation. Finally, some conclusions are given based on our current investigation.
1. Introduction
Many structure components are frequently subjected to vibration loading, which usually lead to fatigue failure. Since vibration fatigue is one of the significant mechanical failure causes, many studies focus on it [1-3]. The approaches to predicting fatigue life are usually conducted in frequency domain or time domain. The frequency domain methods can speed up the calculations as the loading process is defined by power spectral density function which is a probability statistics formulation. However, in most of the existing frequency domain methods, the estimation is usually limited to the stationary Gaussian loading process. Moreover, this type of methods cannot account for the physical mechanisms, especially load sequence effect. The time domain methods are based on the cycle counting and cumulative damage rule [1-3]. The identification of cycles is usually carried out through the rainflow counting algorithm [4, 5]. And then, in the most cases, the linear damage accumulation rule is adopted to deal with the fatigue damage evolution process. The time domain methods have been proven to predict the fatigue life successfully under constant amplitude loading. However, for the variable amplitude loading, the complicated load interaction has a nonlinear and non-negligible influence on the fatigue crack growth process. It is still a big challenge for the most existing fatigue analysis methods [6]. In this paper, a time-based method is proposed to analyze the fatigue crack growth behavior with sequence effects under variable amplitude loading caused by vibration.
Some models have been developed to calculate fatigue crack growth with consideration of the interaction effects under variable amplitude loading. Wheeler [7] and Willenborg [8] presented a series of models based on the plastic zone size ahead of the crack tip. In these methods, the coefficient of crack growth equation is correlated with the monotonic plastic zone size in order to predict retardation phenomenon caused by overload. A great number of modifications are made on these models to improve the prediction accuracy [9, 10]. However, the interaction effects in these models are accounted for by manipulating the fitting coefficients, instead of directly deriving from the physical mechanisms. Elber firstly introduced the crack closure concept that has significant influence on fatigue crack propagation [11]. Elber indicated that fatigue cracks are closed during a portion of the tensile load cycle and developed an equation between the fatigue crack growth rate and the effective intensity factor. And then many researchers focus on the crack closure mechanisms [12-14]. But most existing closure models are applicable for constant amplitude loading condition only. Newman analyzed the crack closure phenomenon under variable amplitude loading by proposing a strip yield model in finite element method [15-17]. The stress-redistribution on the crack line and elastic deformation for the materials along the crack surface are not taken into account in Newman’s method. The computing process under random loading condition is extremely complicated and of high computational cost, owing to involving the nonlinear analysis of cyclic plasticity and crack contact.
In the recent studies, an analytical crack closure model is developed based on an annealing virtual crack hypothesis, which is inspired and validated from the state-of-art in-situ SEM testing performed by Zhang and Liu [18, 19]. This model is derived from the plastic zone ahead of crack tip and able to calculate crack closure level variation under the variable amplitude loading. The researches above indicate that the crack closure has significant influence on fatigue crack propagation. It is proven that the large plastic zone due to overload correlates with the fatigue crack growth retardation phenomenon, which is the typical simple interaction effect [20-22]. In this paper, the crack closure model is generalized by introducing the equivalent plastic zone hypothesis which could quantify the previous sequence effects. And then the time-domain fatigue crack growth method is developed based on the modified crack closure model. The experimental data under typical vibration loads are employed to validate the proposed model. Additionally, the NASGRO equation is also used to compare with our model, which is a popular approach for fatigue crack growth analysis in many engineering projects.
The paper is organized as follows. First, the equivalent plastic zone concept is introduced and the modified crack closure formulation is briefly derived. And then a time-based method is proposed to calculate the fatigue crack growth under vibration loads. Next, the model validation is performed by using the fatigue testing data in Al 7075-T6 under “Christmas Tree” loading and in Al 2024-T3 under block loading respectively. The model predictions are compared with experimental data and the predictions of the NASGRO equation. Finally, some conclusions are given based on the current investigation.
2. Methodology
It is generally known that the crack closure, as first presented by Elber, has important influence on interaction effects [11]. The fatigue crack growth rate can be expressed as:
where is the crack growth rate; is the effective stress intensity factor; the stress intensity factor of the peak load; is the stress intensity factor of crack closure level; , m are calibration parameters. The stress intensity factor is expressed as [23, 24]:
where is the geometry factor; ‘’ is the crack length; and is the remote stress level. Since the fatigue crack growth is significantly influenced by plasticity ahead of the crack tip, the load sequence effect can be correlated with the plastic deformation in the vicinity of the crack tip. In order to investigate this effect, the plastic state caused by the previous loads should be traced.
Therefore, the equivalent plastic zone concept is proposed in this paper, and the general expression can be written as:
where is the equivalent plastic zone size in the th cycle; is the initial crack length; da is the crack increment; is the current plastic zone size in the th cycle; is the crack length in the th cycle; is the current cycle number. A schematic sketch is given to illustrate the equivalent plastic zone concept. The loading sequential process and the corresponding plastic state variation are shown in Fig. 1. The dashed zigzag lines represent the loading history. The large plastic zones have been formed at ‘’, and the crack tip is ‘’ at that moment. The monotonic and reverse plastic zones can be expressed as [19]:
where is the monotonic plastic zone size; is the reverse plastic zone size. The current load is applied at ‘’ and the new crack tip is ‘’. The large forward and reverse plastic zones, which are the dotted ellipses, form during the largest load cycle in the previous loading history. Before ‘’, the following plastic zones do not reach their boundaries respectively even though the crack grows. The solid ellipses represent the equivalent plastic zones ahead of the crack tip . In addition, the actual contour of plastic zone is butterfly-shape instead of circle, but theoratically their diameters along the crack direction are identical, as shown in Fig. 1. In current study, the plastic zone effects are calculated by the equivalent plastic zone which is considered to be in direct proportion to the circular diametric distance. This proportional relation is indicated by the geometry modification factor which is equal to or slightly greater than 1. The Eq. (3) can be rewritten as:
where and are the equivalent monotonic and reverse plastic zone in th cycle respectively; is the geometry modification factor of plastic zone.
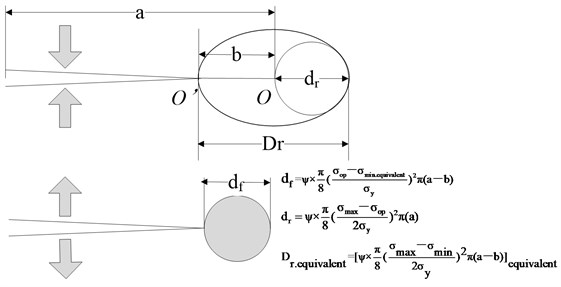
The Ref. [19] derived a crack closure model in the continuous unloading-loading process, which is validated under constant amplitude loading only. In this study, the equivalent plastic zones are introduced to replace the plastic zone formed in the unloading process. A schematic illustration of the modified closure model is shown is Fig. 2. The crack tip is ‘’ after the unloading process. The current crack length is ‘’ and the crack closure length is ‘’. The reversed plastic zone appears ahead of the crack tip and has a diameter of dr. According to the assumption of crack annealing, the virtual crack length can be considered as and the diameter of reversed plastic zone ahead of the crack tip ’ will be . The equation can be established. In the following loading process, the crack closure length ‘’ gradually reduces. When the value of b becomes zero, the crack is fully open and the forward plastic zone with diameter appears. The above equation can be written as . The equivalent plastic zones substitute for the original plastic zone effects. Therefore, the equation can be expressed as:
where is tensile yield strength; the inverse computation maximum stress level from the above equivalent monotonic plastic zone ; the inverse computation minimum stress level from the above equivalent reverse plastic zone; is stress level of crack opening.
Fig. 1Schematic illustration of the equivalent plastic zone concept
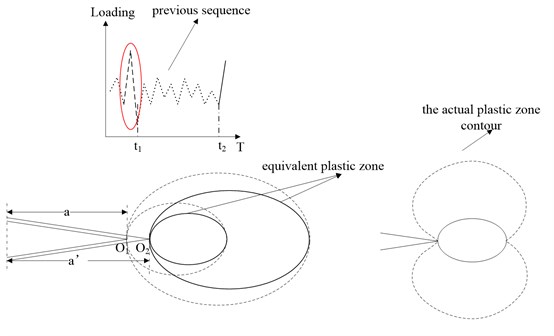
Fig. 2Schematic illustration of real crack and virtual crack model
Eq. (7) can be rewritten using the reverse plastic zone and monotonic zone size as:
where is the equivalent monotonic zone size; is the reverse plastic zone size. Base on that, the theoretical solution of can be expressed as:
where is the crack closure level, derived from the equivalent reverse plastic zone. The time-based model can be developed based on the crack closure model. The crack length can be derived from Eq. (1):
where is the initial crack length; is the crack increment; is the crack length in the th cycle.
In addition, the NASGRO equation is employed to compare with our model, which can be expressed as [25]:
where is the crack closure contribution, , , and are experimentally derived material parameters, is the threshold stress intensity factor range and is the critical stress intensity factor.
For constant amplitude loading the f-function can be expressed according to Newman as:
with the coefficients given by:
where and are the fitting parameters.
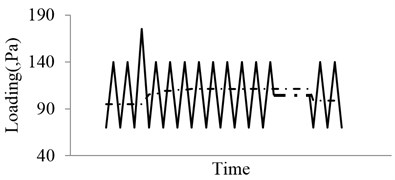
The retardation/acceleration caused by overload/underload is the typical and simplest loading interaction. A schematic illustration for overload/underload effects is shown in Fig. 3. The crack closure level varies due to the interaction of forward and reverse plastic zone. A large plastic zone appears ahead of the crack tip due to overload, which leads to the crack growth slowing down. Right after the overload application, the crack closure level jumps to a higher level, and then decreases gradually to the regular level, as the crack growing though the large plastic zone. The increasing of crack closure level leads to the decrease of crack growth rate, and retardation phenomenon happens. Similarly, the crack closure level decreases after underload applied, and transient crack growth acceleration phenomenon happens. The proposed model can describe interaction effect and avoid complicated cycle-counting calculation under random vibration loading.
Fig. 3Schematic illustration for overload/underload effects
3. Model validation
Fatigue failures in large metallic structures are under the influence of the different frequency loading environment. The low frequency oscillation generally has large amplitude, which usually has more significant effect on fatigue damage in comparison to the high frequency oscillation with minor amplitude. When the stress range is below the limit value, the S-N curve generally becomes flat and the fatigue life is essentially unrelated with the stress variation [26]. In addition, it is well-known that no further growth occurs if the stress amplitude is below the threshold value in the crack propagation process [27]. Therefore, this paper focuses on the fatigue crack growth behavior under the vibration loads with low frequency 0-10 Hz. Since the frequency has little effect in this range, the frequency effects are neglected in this investigation [28, 29]. The oscillation loads are considered as the superposition of multiple loading with different frequencies. Experimental data for various aluminum alloy materials under vibration loading are used to validate the above proposed model. Details are shown below.
3.1. Model validation using “Christmas tree” loading
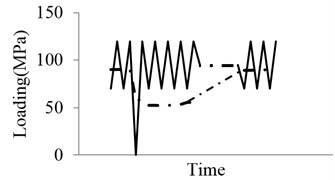
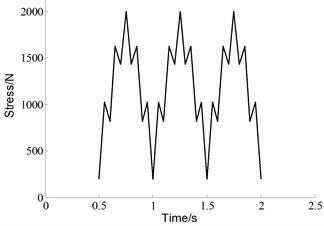
In this section, the model will be validated through comparing the predictions with the experimental data on Al 7075-T6 plate specimen. The Fig. 4 shows the type of vibration loading, which could be considered as the superposition of two loadings.
Fig. 4Schematic illustration of the vibration loading
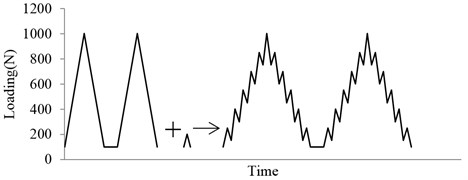
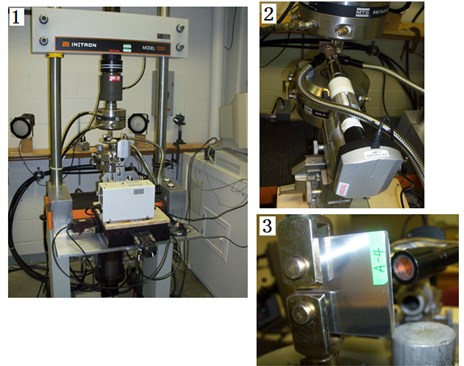
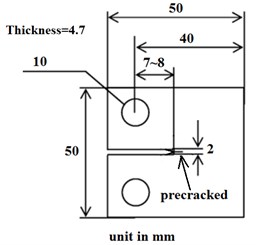
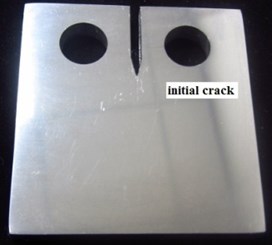
Therefore, the “Christmas Tree” loading is employed to verify the model. Zhang and Liu provided fatigue test data for CT specimen in 7075-T6 aluminum alloy under variable amplitude loading [30]. The testing set-up and the specimen are shown in detail in Figs. 5 and 6. An optical microscope is used to measure the crack length as shown in Fig. 5. The Al7075-T6 specimen is pre-cracked using a hydraulic testing machine INSTRON 1331. The pre-cracking procedure follows the ASTM standard E647-99. Following this, both surfaces of the specimen are polished with the fine sandpaper for the microscopy observation. The detailed geometry of the CT specimen and a pre-cracked real specimen are shown in Fig. 6.
Fig. 5Testing setup
The material properties in longitudinal (LT) orientation are as follows: yield strength 520 MPa, modulus of elasticity 69600 MPa. The geometric dimensions of the specimen are respectively: thickness 4.7 mm, width 40 mm. The initial crack size is 11.3 mm. The geometric factor of the stress intensity factor for this specimen is [31]:
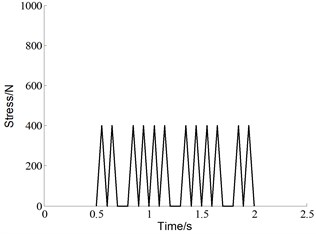
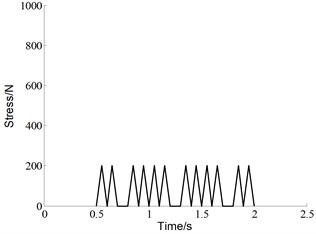
where , is initial crack length, is width of the specimen. The experimental loading cases are shown in Fig. 7. Five different specimens were subjected to the baseline loading, which is constant amplitude load with 0 N, 0. For each of the 20 % high ratio and 10 % low ratio, three different specimens are subjected to variable amplitude loading. The baseline is the control group in this experiment, which is 2 Hz triangular wave without any superimposed load sequences. Both of the two “Christmas Tree” loading conditions are the superposition of two triangular waves with different frequencies and amplitudes. One is identical to the baseline, the other is additive smaller amplitude triangular waves with a frequency of 8 Hz. The two superimposed load sequences have different amplitudes, which are 20 % and 10 % of the maximum load level respectively.
Fig. 6Geometry of CT specimen and pre-cracked specimen
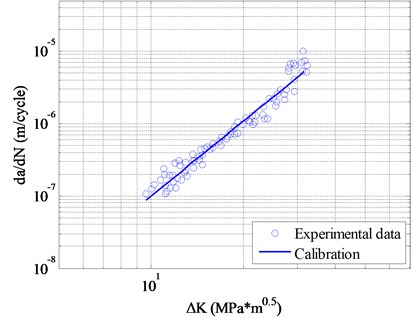
In order to calculate the calibration parameters in Eq. (1), the test data are employed as it is shown in Fig. 8. Wei Zhang and Yongming Liu provided these experimental data under baseline loading for 7075-T6 aluminum alloy specimens [30]. The calibration parameters are 2.0589e-10 and 3.4465.
Fig. 7“Christmas tree” loading profile
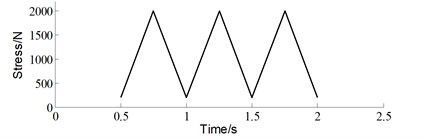
a) Baseline
b) 20 % high ratio
c) 10 % low ratio
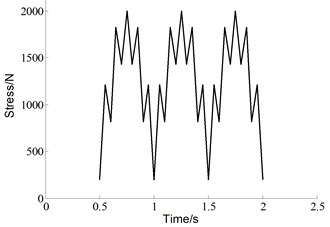
d) “Christmas tree” with 20 % high ratio
e) “Christmas tree” with 10 % low ratio
Fig. 8da/dN-dK calibration
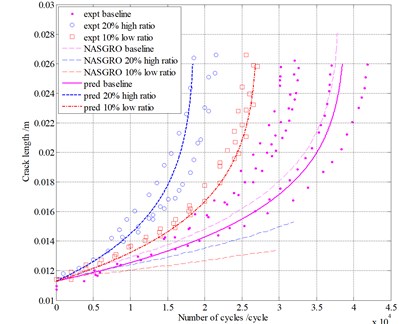
The model predictions are compared to the test data in Fig. 9. The pink solid dots represent the testing data of baseline condition. Five sets of a-N curves almost have the same trend. The predictions by proposed time-based model, which are described by the pink solid line, match the experimental data well. The blue circlets and red squares respectively are testing data of 20 % high ratio and 10 % low ratio cases. The blue dashed line and red dot dash line are respectively calculation results of the proposed method under 20 % high ratio and 10 % low ratio conditions. The three dashed lines are the calculation results by using NASGRO equation. The material parameters are calibrated under the baseline condition, which are used to predict the crack growth behavior under the other cases. The experiment results prove that the crack growth rates under the superimposed loads are higher than those under the baseline condition. However, the NASGRO prediction results are contrary. The NASGRO prediction trend is inconsistent with the experimental data. Therefore, the fatigue crack growth under the similar loading condition cannot be calculated by NASGRO equation. One of the possible reasons is that the NASGRO equation cannot describe interaction effects well for this type of loading. It is obvious that the predictions by proposed model match the experimental data better, which implies that the interaction effects can be accounted for appropriately by our analysis model.
Fig. 9Comparison of the model predictions with experimental results
3.2. Model validation under block loading
McMillan and Pelloux provided fatigue test data under block loading for center-notches 2024-T3 aluminum alloy specimens [32]. The geometry and material properties of plate specimens are as follows: width 229 mm, length 610 mm, thickness 4.1 mm, modulus of elasticity 71750 MPa. The initial crack size is 12.7 mm. The 2024-T3 allunimum alloy composition used for the first type of load was slightly different from the alloy used for another case. The properties of both materials are listed in Table 1.
Table 1Properties of 2024-T3 alluminum alloy
Loading | Ultimate strength (MPa) | Yield strength (MPa) |
a | 473.3 | 327.9 |
b | 492.1 | 315.1 |
Fig. 10da/dN-dK calibration
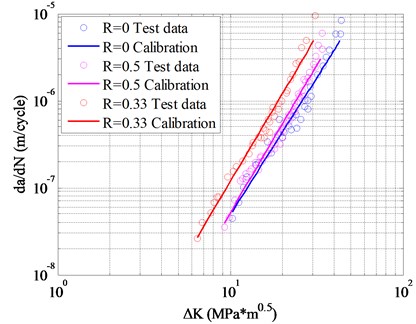
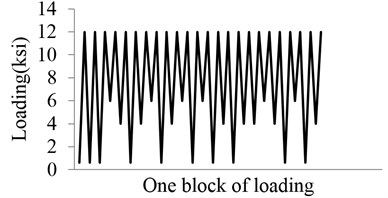
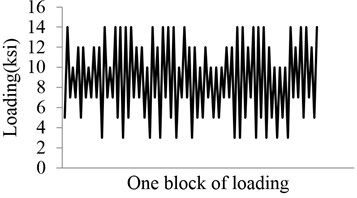
Fig. 11Loading profile
Following the same above procedure, the calibration parameters are estimated by the experimental data. As it is shown in Fig. 10, three sets of 2024-T3 alluminum alloy testing data are used, which are considered to be determined by metrial only [33]. The calibration parameters are: 1.9537e-10 and 3.2939.
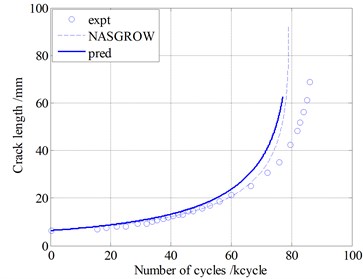
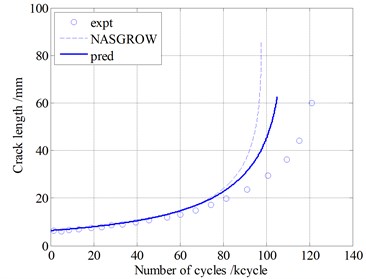
Two types of loading sequences are used to validate the proposed model . Pariodical loading block simulating some typical vibration loadings. The block loads are shown in Fig. 11. These conditions are complex superposition of multiple difference loads, which represents simplified vibration loads environment. Model predictions are compared with experimental data for Al 2024-T3 in Fig. 12. The blue circlets are testing data under the two types of loading. The blue solid lines represent predictions of proposed model. The dashed lines are the prediction by using the NASGROW equation. The prediction results of the two models are similar. Both of the two methods can calculate the fatigue crack growth well under these block loads. Note that the present model can account for the loading sequence interaction effects well.
Fig. 12Model validation under block loading on Al2024-T3
4. Conclusions
A time-based fatigue crack growth model is proposed considering the interaction effects to predict the fatigue crack growth under vibration loading. This model is based on the crack closure concept and plasticity in the vicinity of crack tip. The equivalent plastic zone is introduced to evaluate the previous loads effect. The following conclusions can be drawn:
1) The method is proven to predict the fatigue life under some types of vibration loading successfully through the model validation. Furthermore, this model avoids complex nonlinear cyclic plasticity and crack contact analysis.
2) This paper focuses on the superposition of two load sequences with different amplitudes, which represents a kind of typical and general vibration load environment. The model validations are performed using “Christmas Tree”, and the predictions are compared with those of the NASGRO equation. The proposed model can calculate the interaction effects under “Christmas Tree” case, which the NASGRO equation cannot handle. In addition, the block loading cases are also used to validate this model. The predictions of our model and the NASGRO equation are similar. Both of them match the testing data well.
3) The interaction effects under vibration loads can be quantified by the proposed model, which is derived from the physical mechanisms, such as the crack closure and plasticity.
The above statement is only validated in aluminum alloy under the tension-tension loading. In the future, the investigation will be extended to other loading cases and materials systems.
References
-
Shih Yan, Wu Guan-Yuan Effect of vibration on fatigue crack growth of an edge crack for a rectangular plate. International Journal of Fatigue, Vol. 24, Issue 5, 2002, p. 557-566.
-
Liou H. Y., Wu W. F., Shin C. S. A modified model for the estimation of fatigue life derived from random vibration theory. Probabilistic Engineering Mechanics, Vol. 14, 1999, p. 281-288.
-
Paulus Mark, Dasgupta Abhijit Semi-empirical life model of a cantilevered beam subject to random vibration. International Journal of Fatigue, Vol. 45, 2012, p. 82-90.
-
Dattoma V., Giancane S., Nobile R., Panella F. W. Fatigue life prediction under variable loading based on a new non-linear continuum damage mechanics model. International Journal of Fatigue, Vol. 28, Issue 2, 2006, p. 89-95.
-
Downing S. D., Socie D. F. Simple rainflow counting algorithms. International Journal of Fatigue, Vol. 4, Issue 1, 1982, p. 31-40.
-
Chang J. B. Round-robin crack growth predictions on center-cracked tension specimens under random spectrum loading. Methods and Models for Predicting Fatigue Crack Growth, ASTM STP 748, American Society for Testing and Materials, Philadelphia, 1981, p. 3-40.
-
Wheeler O. E. Spectrum loading and crack growth. Journal of Basic Engineering, Vol. 94, Issue 1, 1972, p. 181-186.
-
Willenborg J., Engle R. M., Wood H. A. A Crack Growth Retardation Model Using an Effective Stress Concept. 1971.
-
Huang X., Torgeir M., Cui W. An engineering model of fatigue crack growth under variable amplitude loading. International Journal of Fatigue, Vol. 30, Issue 1, 2008, p. 2-10.
-
Gray T. D., Gallagher J. P. Predicting fatigue crack retardation following a single overload using a modified wheeler model. Mechanics of Crack Growth, ASTM STP, Vol. 590, 1976, p. 331-344.
-
Wolf Elber Fatigue crack closure under cyclic tension. Engineering Fracture Mechanics, Vol. 2, Issue 1, 1970, p. 37-45.
-
Schijve J., Skorupa M., Skorupa A., et al. Fatigue crack growth in the aluminium alloy D16 under constant and variable amplitude loading. International Journal of Fatigue, Vol. 26, Issue 1, 2004, p. 1-15.
-
Katcher M., Kaplan M. Effect of R factor and crack closure on fatigue crack growth for aluminium and titanium alloys. ASTM STP, Vol. 559, 1974, p. 264-282.
-
Kumar R., Garg S. B. L. Effect of yield stress and stress ratio on fatigue crack closure in 6063-T6 aluminium alloy. International Journal of Pressure Vessels and Piping, Vol. 38, Issue 4, 1989, p. 293-307.
-
Newman Jr J. C. A crack-closure model for predicting fatigue crack growth under aircraft spectrum loading. ASTM STP, Vol. 748, 1981, p. 53-84.
-
Newman Jr J. C. A crack opening stress equation for fatigue crack growth. International Journal of Fracture, Vol. 24, Issue 4, 1984, p. 131-135.
-
Forman R. G., Shivakumar V., Newman Jr J. C. Fatigue-Crack-Growth Computer Program. JSC-22267, NASA, 1986.
-
Zhang W., Liu Y. Investigation of incremental fatigue crack growth mechanisms using in situ SEM testing. International Journal of Fatigue, Vol. 42, 2012, p. 14-23.
-
Wei Zhang, Yongming Liu In situ SEM testing for crack closure investigation and virtual crack annealing model development. International Journal of Fatigue, Vol. 43, 2012, p. 188-196.
-
Chen F., Wang F., Cui W. Fatigue life prediction of engineering structures subjected to variable amplitude loading using the improved crack growth rate model. Fatigue and Fracture of Engineering Materials and Structures, Vol. 35, Issue 3, 2012, p. 278-290.
-
Sadananda K., Ramaswamy D. N. V. Role of crack tip plasticity in fatigue crack growth. Philosophical Magazine A, Vol. 81, Issue 5, 2001, p. 1283-1303.
-
Liu Y. Small time scale fatigue crack growth analysis. International Journal of Fatigue, Vol. 32, Issue 8, 2010, p. 1306-1321.
-
Paris P. C., Gomez M. P., Anderson W. E. A rational analytic theory of fatigue. The Trend in Engineering, Vol. 13, Issue 1, 1961, p. 9-14.
-
Blandford G. E., Ingraffea A. R., Liggett J. A. Two‐dimensional stress intensity factor computations using the boundary element method. International Journal for Numerical Methods in Engineering, Vol. 17, Issue 3, 1981, p. 387-404.
-
Skorupa M., Machniewicz T., Schijve J., et al. Application of the strip-yield model from the NASGRO software to predict fatigue crack growth in aluminium alloys under constant and variable amplitude loading. Engineering Fracture Mechanics, Vol. 74, Issue 3, 2007, p. 291-313.
-
Pascual F. G., Meeker W. Q. Estimating fatigue curves with the random fatigue-limit model. Technometrics, Vol. 41, Issue 4, 1999, p. 277-289.
-
Tanaka K., Nakai Y., Yamashita M. Fatigue growth threshold of small cracks. International Journal of fracture, Vol. 17, Issue 5, 1981, p. 519-533.
-
Hartman A., Schijve J. The effects of environment and load frequency on the crack propagation law for macro fatigue crack growth in aluminium alloys. Engineering Fracture Mechanics, Vol. 1, Issue 4, 1970, p. 615-631.
-
Solomon H. D., Coffin L. F. Effects of frequency and environment on fatigue crack growth in A286 at 1100 F. Fatigue at Elevated Temperatures, 1973, p. 112-122.
-
Zhang W., Liu Y. A time-based formulation for real-time fatigue damage prognosis under variable amplitude loadings. AIAA/ASME/ASCE/AHS/ASC Structures, Structural Dynamics and Materials Conference, Vol. 54, 2013, p. 3231-3241
-
Matsuishi M., Endo T. Fatigue of metals subjected to varying stress. Japan Society of Mechanical Engineers, Fukuoka, Japan, 1968, p. 37-40.
-
Mcmillan J. C., Pelloux R. Fatigue Crack Propagation under Programmed and Random Loads. Boeing Scientific Research Labs Seattle Wash Solid State Physics Lab, 1966.
-
Liu Y. A comparative study between a small time scale model and the two driving force model for fatigue analysis. International Journal of Fatigue, Vol. 42, 2012, p. 57-70.
About this article

The research is financially supported by the National Natural Science Foundation of China (No. 51405009) and the Fundamental Research Funds for the Central Universities.
