Abstract
The fatigue behavior of the structure under multiaxial random loading is studied in this paper. The influence of different parameters on the fatigue behavior is mainly investigated. Firstly, the theoretical analysis for the stress response of the structure under multiaxial random vibration is developed, and the relationship of the stress responses between multiaxial and sequentially applied uniaxial random vibration is obtained, which indicates that the potential failure modes will be different. Then, the experiments are conducted to compare the failure mode between uniaxial and multiaxial inputs (uncorrelated). As anticipated, the experimental results show significantly difference in the fatigue life, failure position and the way of crack propagation. Finally, the correlation between different axial input loads and its influence on the failure mode are investigated experimently. Based on the experiment, the relationship between the failure mode and the correlation coefficient as well as the phase of the input loads are also obtained.
1. Introduction
The vibration fatigue of material, machine and construction occurs prevalently in aviation, transportation and machinery industry both at the stage of manufacturing and during operation [1]. Structural components suffer from vibration fatigue under the conditions of cyclic or random multiaxial loading, which cause huge material losses, ecological disaster and is directly threatening to the life and health of people, So vibration environment test plays a more and more important role on the reliability of structural and equipment, Through vibration environment test, the problem can be detected before a product goes out and experiences a failure in the real word.
In the real life, vibration environment is usually multi-degrees of freedom (MDoF) dynamic loading. Examples include a spacecraft launch, a military ground vehicle over rough terrains, a helicopter blade during instability, and so on. However due to the limitations of test equipment and cost, most vibration environment test are conducted by sequentially applying uniaxial excitation to test product along three orthogonal axes [2], which is called sequentially uniaxial test. MIL-STD-810G also provides guidance and specifications for the conduct of this test. As research continues, this test method was taken as unrealistic and inadequate. Some researchers such as Whiteman and Burman [3, 4], French et al. [5] had pointed out the shortcomings of this test method compared with experiment utilizing multiaxial electrodynamic shakers. However these studies are mainly focused on the difference of the fatigue life. The vibration fatigue mechanism analysis of structures exposed to multiaxial random loading are scarce. Hence in this paper the dynamic response of structure is analyzed in frequency domain, and the differences in failure modes and fatigue life for multiaxial inputs versus single-axis inputs are predicted based on the result of the dynamic analysis. The validation test are conducted on the tri-axial vibration test system, and the full tri-axial (uncorrelated, Load cases I), uniaxial (Load cases II) and sequential uniaxial (Load cases III) random vibration excitation are applied to the specimen in the test. The test results show that different load cases produce different failure times, failure distributions, and mode of crack propagation.
The correlation between the input loads cannot be taken into account in the traditional sequential uniaxial test [6], which is one of the main reason for the difference between test and real-life vibration loads. Currently, the researches on this question are also scarce, and so the coupling of loads impact on the fatigue failure is studied by experiment test in this paper. In the test, simultaneous two-axial loads are applied on the specimen. Different influence rules of the load correlation on fatigue failure are gained by changing the correlation coefficient and the phase angle of the two-axis loads in the test.
2. Theoretical analysis
2.1. The input PSD matrix
Currently, the vibration environment test are usually conducted on shaker tables, and the base excitation is used to provide the vibration environment for the test product. In the full tri-axial vibration test, the random excitations can be descripted by a three-dimensional acceleration excitation PSD matrix :
where the PSD matrix is a 3×3× matrix, the third dimension is the frequency existing of frequency bands .The elements on the diagonal of Eq. (1) are auto PSDs with real values. They can be obtained by uniaxial random vibration test. Correlations that exist between the input loads are taken into account using cross PSDs which are on the off-diagonal positions of Eq. (1), and . denotes the complex conjugate of which can be calculated by:
where and denote the correlation coefficient and the phase angle between the input loads respectively.
In order to guarantee the realizability of the matrix Eq. (1), it should be a half positive definite matrix, that is:
Substituting Eq. (2) into Eq. (3), we obtain Eq. (4) as follows:
The rationality of the correlation coefficient and the phase angle set in the test can be validated by Eq. (4). Phase angle is the phase shift between two excitation directions under a given frequency, which takes the form:
For three dimensional systems, the phase angle should satisfy the following relations:
If two phase angles of Eq. (6) are selected in advance, the third one can be determined according to Eq. (6).
2.2. Dynamic response analysis
The local stress state on the structures excited by multiaxial vibration is generally multiaxial even in the simplest case. According to the random vibration theory [7], the response stress PSD matrix can be calculated from the input PSD matrix by:
where the stress response PSD matrix is a 6×6× matrix. The third dimension is the frequency existing of frequency bands. The values of the diagonal for auto PSDs are real, whereas the cross terms on the off-diagonal are complex because of the phase differences between stresses. is a frequency response function matrix which describes the relation between the response stresses somewhere in the construction and the unity excitation, , where denotes the response stresses of somewhere in the construction caused only by the -axial unity acceleration excitation. denotes the complex conjugate of . In the application, the frequency response function matrix can be determined by frequency response analysis utilizing finite element software.
The response stress PSD matrix can also be introduced as:
When the random vibration inputs to the structure are uncorrelated, Eq. (8) can be simplified as:
where, denotes the response stress PSD matrix of the same position when the -axial vibration is applied to the structure only, as well as and .
2.3. The vibration fatigue damage analysis under multiaxial and uniaxial vibration
Metallic structures excited by multiaxial random loads are exposed to high-cycle vibration fatigue caused by random stresses, and the local stress state is generally multiaxial. Fatigue life prediction under the conditions of multiaxial variable loading remains an unresolved issue, having no unanimously accepted solutions until present-day [8]. At present, the majority multiaxial criteria are traditionally formulated in the time-domain [9, 10]. However, these methods are extremely time-consuming, or even impractical. Since from the last decades, an increasing effort has been devoted to develop alternative methodologies to reduce the computational times while still providing high levels of accuracy and reliability. Several multiaxial fatigue criteria are been reformulated in frequency domain as multiaxial spectral methods [11-14]. These new multiaxial spectral methods allow a significant reduction of total computation time, and can give a quickly estimate for the fatigue damage in frequency domain, compared to classical time-domain approaches. One of the most frequently used methods is equivalent uniaxial stress method which replaces the variable multiaxial stress with an equivalent uniaxial stress, such as the “equivalent von Mises stress” [11, 15], and the procedure is described below.
The von Mises equivalent stress is defined as follows:
Introducing the matrix, the von Mises stress can be expressed in the following equivalent form:
where is the trace operator, and is the stress vector, it can be written as , the constant matrix is given by:
Taking the expectation of both sides of Eq. (11), we get:
where is the covariance matrix of the stress vector related to the PSD matrix of the stress vector by:
The left hand side of Eq. (14) is the mean-square value of the von Mises stress, related to its PSD at by:
Combining Eqs. (13)-(15) we get:
So the equivalent von Mises stress is defined as a Gaussian random process of zero mean whose PSD function is given by:
By means of this reduction, all the spectral methods and the large amount of available experimental data regarding material behavior under variable uniaxial loading for uniaxial random fatigue become applicable. For the uniaxial random process, the fatigue damage can be calculated as:
where and are material parameters defining the constant amplitude S-N curve , and is the cycle amplitude probability density function. is the expected peak occurrence frequency, ,where and are the spectral moment of equivalent von Mises stress PSD. The general form for the th spectral moment is given by:
The function is the key factor considered by frequency-domain methods for fatigue analyses. For a wide-band loading process, there are many empirical expressions developed for the calculation of function , among which Dirlik method [17] has long been considered to the best one. The rainflow-cycle amplitude probability density estimate can be expressed by:
Where, the parameters in Eq. (20) can be calculated by the follow equations [17]:
According to the random vibration theory [7], the mean-square value of the von Mises stress related to its PSD can be obtained by:
Substituting Eq. (17) and Eq. (21) into Eq. (9), we obtain Eq. (22) as follows:
According to Eq. (22), when the full tri-axial vibration inputs are uncorrelated, the equivalent von Mises stresses is the square root of the sum of the squares of the uniaxial results, and the von Mises stress caused by full tri-axial input will be significantly higher than that of the uniaxial inputs. Other studies have shown that fatigue cracks start because of higher stresses present in the loading history. According to the fatigue estimate method described above, the fatigue damage produced by full tri-axial vibration inputs will be larger than that by uniaxial vibration input. In other word, the structure served in full tri-axial vibration environment will have a shorter fatigue life. According to Eq. (22), the location of the maximum stress will be also different between the full tri-axial input loads and uniaxial input loads, which indicates that the potential failure distributions as well as the mode of crack propagation will be different. In order to verify the above predictions, the contrast test are to be conducted as below.
3. Contrast test research on the fatigue failure
3.1. The specimen and the test system
The specimens used in the test are notched cantilever beam structures. The dimensions are provided in Fig. 1, in which all the units are millimeter. The specimens are manufactured from 6061-T6 aluminum. A clamped-free boundary condition is provided by a steel fixture, and the distance clamped by the fixture is 20 mm at the bottom of the specimen, as shown in Fig. 1. Fig. 2 is the picture of specimens under test with the first order natural frequency 73.5±0.25 Hz.
Fig. 1The dimension of test specimen
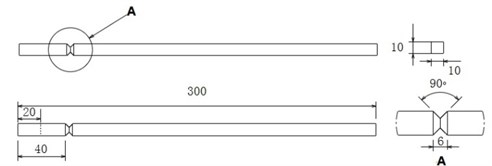
Fig. 2The installation photo of the test specimen
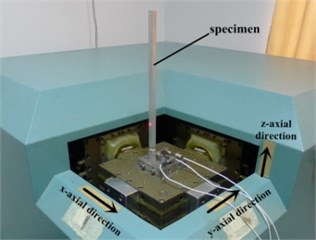
Fig. 3The photo of the test field
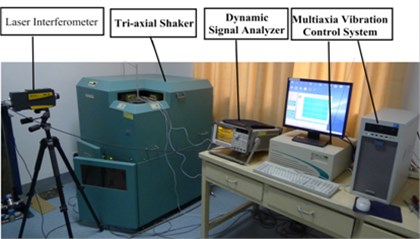
As shown in Fig. 3, the vibration fatigue test systerm consists of three parts: tri-axial vibration table (Shinken, G-6080-3HT-20), multiaxial vibration control system and natural frequency monitoring system. Multiaxial vibration control system consists of a signal feedback accelerometer (PCB, 333B32) of three directions and the multiaxial vibration control instrument (SD, Juguar). The natural frequency monitoring system is composed of a laser interferomneter (PDV-100) and a dynamic signal analyzer. In the vibration fatigue test, the resonant frequency of the specimen reduces due to the propagation of crack [18]. Therefore, the resonant mode shifting can be used to detect possible damage. In this paper, the fatigue failure time is determined when the the frist resonant frequency shifts from its original value by 5 % [5, 18].
3.2. The input loads spectrum
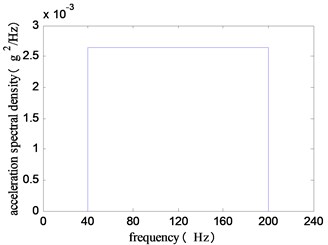
The response amplifies when the excitation frequency is close to the resonance frequency of structure. According to the random vibration fatigue theory and test, the stress cycle with higher level present in the loading history is the main reason for the fatigue failure. Consequently, the structure working under resonant frequency is more likely to suffer from fatigue failure. Several studies also indicated that damage occured in a narrow band around the first resonant frequency [18]. The random vibration acceleration spectrum used in this paper is developed based on the resonant frequency of the specimen, as shown in Fig. 4 with a frequency range from 40 to 200 Hz. The acceleration root-mean-square value of the spectrum is 0.65 g, and the maximum acceleration during the test is 1.95 g. For the convenience of comparison, the same random vibration input spectrum is applied for each of the tests.
Fig. 4The input acceleration PSD
3.3. Vibration fatigue test procedures and results
3.3.1. Full tri-axial vibration test
In the full tri-axial vibration fatigue test, the input acceleration spectrum depicted in Fig. 4 are applied simultaneously in the , , and directions, which are incoherent with each other by setting coherent coefficient between the different direction loads to zero. There are seven specimens to be tested.
Fig. 5Typical PSD of the specimen
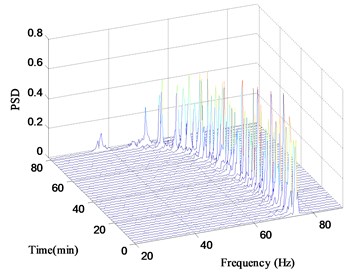
Fig. 6The curves of natural frequency vary with the time
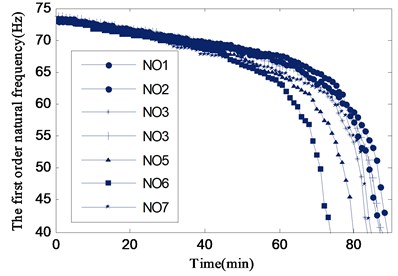
In the test, the laser interferometer is used to measure the velocity response of the structure, and the test results are analyzed by dynamic signal analyzer to display and record the speed power spectral density in time, and the frequency resolution is 0.25 Hz. The typical velocity PSD of the structure at different times is shown in Fig. 5. The curves of natural frequency versus time can be obtained by picking peak value of the velocity PSD of different times, which are demonstrated in Fig. 7. It can be seen that the first natural frequency shifts slowly at the begging of the test, and a dramatically drop appears at about 65 Hz. By the time complete fracture occurring, the first natural frequency has dropped below 40 Hz. The failure frequency of specimens are 69.75±0.25 Hz when the natural frequency experiences a 5 % decline. The fatigue life is listed in Table 1 (loads case I).
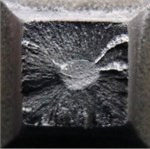
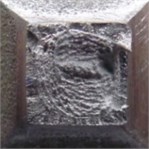
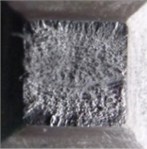
Fig. 7 presents the crack propagation process on the fracture surface of the typical specimenin Fig. 7(a) and Fig. 7(b) are the fracture surface when the specimen break completely with the frequency 39.5 Hz and 37 Hz respectively. In order to further observe the growth of crack, the other two specimen are tested under load case I, and the test is stopped when the first natural frequency experiences 5 % decline (69.5 Hz) and 10 % decline (62.5 Hz) respectively, then, breaking the specimen by external force. The fracture surfaces are shown as Fig. 7(c) and Fig. 7(d) respectively.
Table 1The fatigue life under three vibration conditions (min)
Specimen number | 1 | 2 | 3 | 4 | 5 | 6 | 7 | |
Load Case | I | 41 | 35 | 33 | 28 | 29 | 38 | 37 |
II | 113 | 121 | 106 | 135 | 143 | 127 | 131 | |
III | 138 | 134 | 145 | 149 | 142 | 131 | 137 | |
Fig. 7The fracture surface photo of specimens
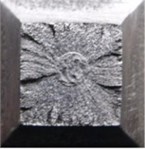
a) NO3:39.5 Hz
b) NO7:37 Hz
c) NO8:69.5 Hz
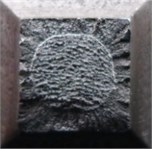
d) NO9:62.5 Hz
3.3.2. Uniaxial vibration test
Fixing the specimen on the vibration table, as shown in Fig. 2, the uniaxial excitation is applied along or direction respectively, with the same spectrum as seen in Fig. 3. The test procedures and damage detection method are the same as full tri-axial vibration test, also seven specimens to be used. Three complete curves of natural frequency vary with the time are recorded, as displayed in Fig. 8. The corresponding fatigue lives are listed in Table 1 (loads case II).
Fig. 9 shows the fracture surface photo of the typical specimen. Fig. 9(a) presents crack growth situation when the nature frequency drops 5 %, and the complete failure surfaces with the frequency of 39.75 Hz is shown as Fig. 9(b).
Fig. 8The curves of natural frequency vary with the time
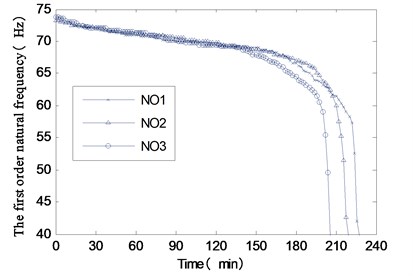
Fig. 9The fracture surface photo of specimens
a) NO4:69.5 Hz (Vibration direction ↕)
b) NO4:39.75 Hz (Vibration direction ↕)
c) NO1:69.75 Hz
d) NO2:69.75 Hz (Vibration direction ↕ and ↔)
3.3.3. Sequential uniaxial vibration test
The purpose of this portion is to investigate the difference of failure modes of structure under both multiaxial loadings and sequential uniaxial vibration. During the tests, the specimens are first excited in direction for 35 minutes, which is the mean failure time determined by the previously full tri-axial tests. Then the exciting time in the direction is also 35 minutes, and finally in the direction until the specimen failure. Once again, seven samples are tested. The total time from the beginning to the failure occur are listed in Table 1 (loads case III), and the failure surfaces of typical specimens are shown as Fig. 9(c) and Fig. 9(d).
3.4. Comparison and analysis for the test results
3.4.1. Comparison and analysis for the crack propagation
The critical structural section of the specimen is square, and the four corners of the section has a strong effect of stress concentration, hence the initial crack generates from these corner, and the nature frequency declines at the beginning of vibration, as shown in Fig. 6 and Fig. 8. Then the natural frequency begins a slow decline which indicates that crack propagation of the specimen has entered the crack stable growth stage.
In full tri-axial vibration test, according to Eq. (22) the maximum stress appears in the corner of the critical section, then gradually reduces along the edge to the neutral axis direction of the section. Therefore, with the increase of vibration time, the cracking regions gradually expand from the corner to the center of the section, and the corresponding crack propagation process are shown in Fig. 7, which are radiated outward from the center. In Fig. 7(c) and (d), the smooth regions at the edge of the section are crack propagation regions that are caused by friction of the metal on the section. The rough regions are the fracture surface which are caused by external force. As displayed in Fig. 7(c), the crack propagation regions are very small, and indicates that the crack propagates slowly before specimen failure. Then rapid crack propagation appeares (Fig. 7(d)) until final fracture. The final fracture surfaces are shown in Fig. 7(a) and (b).
In the uniaxial vibration test, the maximum stress appears at the edge of the critical section which is vertical to the vibrating direction, and is less than the maximum stress caused by full tri-axial vibration. So, as shown in Fig. 9(a), the initial crack occurs on these edge, and expands to the center along vibration direction. The crack propagation region is also smaller than that in Fig. 7(c). The final fracture surfaces are demonstrated in Fig. 9(b). There are distinct differences in crack initiation and propagation between tri-axial and uniaxial vibration test.
Fig. 9(c) and (d) present the typical fracture surface of the specimen failure in the sequential uniaxial vibration test. From the photos, it can be seen that crack propagation regions mainly concentrate at the four corner of the section, similar to the results of full tri-axial vibrations, but different at the crack growth. In full tri-axial vibration test, the width of crack propagation regions at axis edge is as the same as axis. However, in the sequential uniaxial vibration test, the width of the crack propagation regions caused by axial vibration is obviously narrower than that caused by axial vibration. It indicates that the initial crack caused by axial vibration prompts the crack extension on the other axial.
3.4.2. Comparison and analysis for the fatigue life
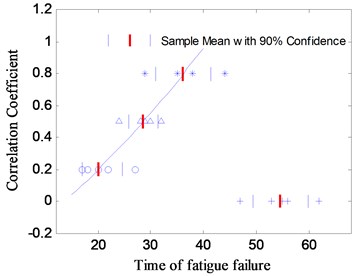
It is suppose that the fatigue life in different load cases presents normal distribution, and the 90 % confidence intervals of the fatigue life are given by:
where, , and denote the sample mean, the sample standard deviation and sample size respectively.
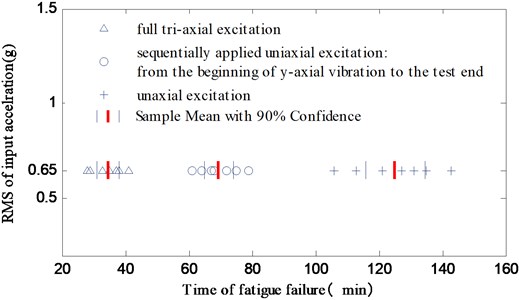
As seen in Fig. 6 and Fig. 8, the nature frequency changes more slowly under uniaxial vibration environment, which demonstrates that the crack propagates slowly in this situation. So, the fatigue life of uniaxial vibration fatigue is far longer than that under full tri-axial vibration. From Fig. 10, it can also be seen that the test time from the beginning of y axial vibration test to the structure failure in the sequentially uniaxial test is much longer than that of full tri-axial test, after the vibration on and axial test. It implies that the products may pass the sequentially uniaxial test but fail under a full tri-axial test at the same energy level.
Fig. 10Fatigue life under three vibration modes
3.4.3. Comparison and analysis for the fatigue damage
According to the fatigue damage theory, the fatigue failure occurs when the damage calculated by Eq. (18) reaches to 1. The damage per minute of time of three load cases is calculated and listed in Table 2. In the sequentially uniaxial test, because the specimens are very stiff along the axis, the nature frequency along axis is much higher than the cut-off frequency of the input spectrum. So, it can be observed that the first order nature frequency of the specimen has no change when the axial excitation is applied only, as the stress appears in the structure is very small. The damage caused by axial vibration could be neglected. Only and axial vibration test times are taken into account in the calculation of the damage per minute of time. The order of magnitude of the data listed in Table 2 is 10-2.
Table 2The damage per minute under three vibration conditions
Specimen number | 1 | 2 | 3 | 4 | 5 | 6 | 7 | Mean | |
Load case | I | 2.44 | 2.86 | 3.03 | 3.57 | 3.45 | 2.63 | 2.70 | 2.95 |
II | 0.88 | 0.83 | 0.94 | 0.74 | 0.70 | 0.79 | 0.76 | 0.81 | |
III | 0.97 | 1.01 | 0.91 | 0.88 | 0.93 | 1.04 | 0.98 | 0.96 | |
As illustrated in Table 2, firstly, the damage caused by full tri-axial test per minute is nearly three times more than that by uniaxial test, which shows that the damage caused by the full tri-axial vibration can’t be simply equivalent by the superposition of uniaxial vibration test. Secondly, the damage caused by sequentially uniaxial test per minute is bigger than that by uniaxial test, though they are both excited by uniaxial input. It is also indicated that the initial crack caused by axial vibration can prompt the crack extension on the other axis. In other word, the change of vibration directions during the test can accelerate the damage of the specimen. In addition, the damage caused by full tri-axial test per minute is more than the sum of that caused by each axial vibration in the sequentially uniaxial test, and so the specimen passed by the sequentially uniaxial test could fail under the real operating conditions.
4. The research on the correlation between the input loads
One of the main inadequacies of sequentially uniaxial test is that it can’t consider the correlation between the input loads. According to Eq. (8), if the correlation coefficient and the phase angle between the input loads are neglected, the stress responses on the structure will be different, and the corresponding fatigue life of the structure will also be affected. In order to investigate the effect of the load correlation on the fatigue failure, in this portion, the two-axial vibration test are conducted considering the correlation coefficient and the phase angle of the input loads.
4.1. Test set-up
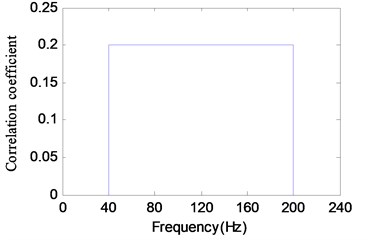
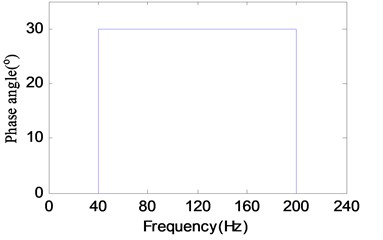
The specimen are manufactured from the same aluminum profile as the foregoing test, the position and shape of the notch are as same as the specimen shown in Fig. 1, but the total length is 250 mm, and the type of specimen assembly are also the same as the foregoing test. The first nature frequency is 102.5±0.25 Hz. In the test, the input acceleration spectrum is applied simultaneously in the , and directions. The spectrum shape and band range are the same as shown in Fig. 4. The acceleration root-mean-square value of the spectrum is 0.8 g, and the maximum acceleration appeared during the test is 2.4 g. In order to make the test easily repeatable, the simple combination of the correlation coefficient and the phase angle between two input loads are used. Here the correlation coefficient is set to 0, 0.2, 0.5 and 0.8 respectively, and the phase angle is set to 30°, 90° and 150°, respectively. The form of the correlation coefficient and the phase angle used in the test are shown in Fig. 11.
Fig. 11The form of the correlation coefficient and the phase
4.2. Analysis of test results
Fig. 12 shows the test results of the fatigue lives, as can be seen, the correlation coefficient have obvious influence on the fatigue life of structure. In addition, as the phase angle changes, the influence law will be different. In the test, when the phase angle is set to 30°, with the increase of correlation coefficient, the fatigue life of the specimens became shorter. On the contrary, when the phase angle is taken to 150°, the fatigue life increases gradually with the increase of the coherent coefficient. When the phase angle is set to 90°, the fatigue failure time of the test specimens with different correlation coefficient are very similar to the test results in which input loads are uncorrelated. It indicates that the change of the correlation coefficient has little impact on the fatigue damage in the two-axial vibration test with 90° phase angle. The reasons for this phenomenon are described below.
In the two-axial vibration test, the response stress PSD matrix of Eq. (8) can be written as:
According to Eq. (2), when the phase is 90°, and .
Due to the symmetry of the specimen, . So the Eq. (24) can be formulated as:
As shown in Eq. (25), the response stress PSD of the two-axial vibration test with 90° phase angle is same as that shown in Eq. (9) for test inputs are uncorrelated, so the fatigue lives are the same as results for input loads are uncorrelated.
Fig. 12The relationship between the correlation coefficient and the fatigue life with different phase angle
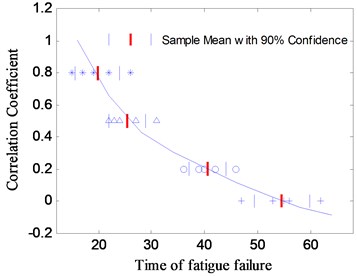
a) Phase angle: 30°
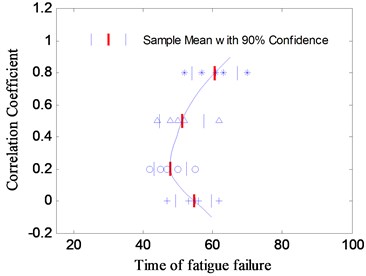
b) Phase angle: 90°
c) Phase angle: 150°
Fig. 13The relationship between the phase angle and the fatigue life
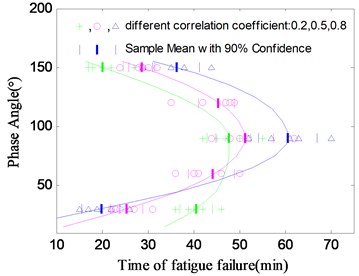
In order to further investigate the effect of phase angle changes on the fatigue life, two groups of test are increased, and the phase angle between the input loads is 60° and 120° respectively, with the both correlation coefficient 0.5. It can be seen from Fig. 13 that the specimens have the longest fatigue life with the phase angle 90°. Fatigue life of the specimens increases with the phase angle when the phase angle is less than 90°. On the contrary, when the phase angle is greater than 90°, the fatigue life decreases with the increase of phase angle.
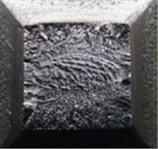
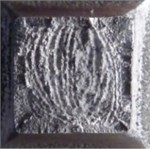
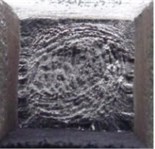
In order to study the crack propagation on the fracture surface, the test is stopped when the first nature frequency experienced 10 % decline, then the specimen is broken by external force. The fracture surfaces of different combination of the correlation coefficient and the phase angle are displayed in Table 3.
Table 3Matrix of the observed fracture surfaces
Correlation coefficient | Phase angle | ||
30° | 90° | 150° | |
0 |  |  |  |
0.2 | 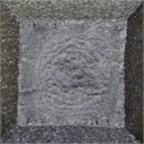 |  | 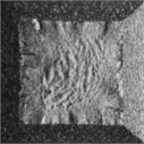 |
0.5 | 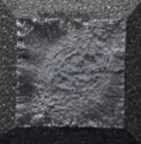 | 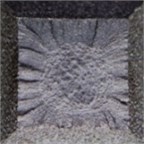 | 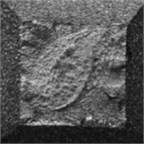 |
0.8 | 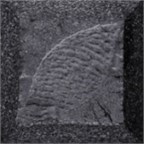 | 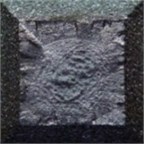 | 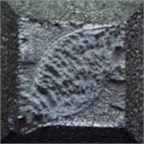 |
As shown in Table 3,when the phase angle is 90°, the crack on the fracture surfaces are the same as that caused by uncorrelated input loads, which are radiated outward from the center, and the specimens under the two types input loads have the same fatigue life, as shown in Fig. 12(b). The crack propagation on the fracture surface are similar to each other when the phase angle is taken as 30° and 150°, with the increase of the correlation coefficient the residue cross section changes from regular circle to irregular ellipse. However, the law of the crack propagation rate are different, the crack growth rate increases with the increase of correlation coefficient when the phase angle is taken 30°, but when the phase angle is taken 150°, the crack growth rate declines when the correlation coefficient changes in the same way. It can be seen in Fig. 12(a) and Fig. 12(c). So the correlation between the input loads has an important influence on the propagation of the crack.
5. Conclusions
This paper analyzed the stress response of the structure under multiaxial random vibration, and the relationship of the stress responses between different loads case is established. Based on the fatigue life estimation method presented in this paper, potential differences of fatigue failure of the structure under different load case are pointed out. The contrast tests are conducted for a notch cantilever beam structure. The differences in the results of the different vibration environment are significant. The different failure times, different crack initiation position and different crack propagation produced by three vibration test are presented and the reason of these differences are analyzed. All these results proved the limitation of the sequential applied uniaxial vibration test.
The other inadequacy of the sequential applied uniaxial vibration test is that the cross correlations of input PSD could not be considered, the research on this question is conducted on the specimen under simultaneous two-axial vibration load. The change law between the fatigue life and the correlation coefficient as well as the phase angle is gained, and difference of the crack growth with different combination of the correlation coefficient and the phase angle are also present in this paper
References
-
Rychlik I. Fatigue and stochastic loads. Scandinavian Journal of Statistics, Vol. 23, Issue 4, 1996, p. 387-404.
-
Chang K. Y., Frydman A. M. Three-dimensional random vibration testing definition and simulation. Proceedings of the Institute of Environmental Sciences, 1990, p. 129-139.
-
Whiteman W., Berman M. B. Fatigue failure results for multiaxial versus uniaxial stress screen vibration testing. Shock and Vibration, Vol. 9, Issue 6, 2002, p. 319-328.
-
Whiteman W., Berman M. B. Inadequacies in uniaxial stress screen vibration testing. Journal of the Institute of Environmental Sciences and Technology, Vol. 44, Issue 4, 2001, p. 20-23.
-
French R. M., Handy R., Cooper H. L. Comparison of simultaneous and sequential single axis durability testing. Experimental Techniques, Vol. 30, Issue 5, 2006, p. 32-35.
-
Aykan M., Çelik M. Vibration fatigue analysis and multi-axial effect in testing of aerospace structures. Mechanical Systems and Signal Processing, Vol. 23, Issue 3, 2009, p. 897-907.
-
Newland D. E. Random Vibrations and Spectral Analysis. Longman Group Limited, London, 1975.
-
Dumitru I., Kun L. On the multiaxial high cycle damage parameters. Petroleum-Gas University of Ploiesti Bulletin, Technical Series, Vol. 63, Issue 1, 2011, p. 117-126.
-
McDiarmid D. L. A shear stress based critical-plane criterion of multiaxial fatigue failure for design and life prediction. Fatigue and Fracture of Engineering Materials and Structures, Vol. 17, Issue 12, 1994, p. 1475-1484.
-
Karolczuk A., Macha E. A review of critical plane orientations in multiaxial fatigue failure criteria of metallic materials. International Journal of Fracture, Vol. 134, Issue 3, 2005, p. 267-304.
-
Pitoiset X., Preumont A. Spectral methods for multiaxial random fatigue analysis of metallic structures. International Journal of Fatigue, Vol. 22, Issue 7, 2000, p. 541-550.
-
Bel Knani K., Benasciutti D., Signorini A., et al. Fatigue damage assessment of a car body-in-white using a frequency-domain approach. International Journal of Materials and Product Technology, Vol. 30, Issue 1, 2007, p. 172-198.
-
Braccesi C., Cianetti F., Lori G., et al. An equivalent uniaxial stress process for fatigue life estimation of mechanical components under multiaxial stress conditions. International Journal of Fatigue, Vol. 30, Issue 8, 2008, p. 1479-1497.
-
Cristofori A., Benasciutti D., Tovo R. A stress invariant based spectral method to estimate fatigue life under multiaxial random loading. International Journal of Fatigue, Vol. 33, Issue 7, 2011, p. 887-899.
-
Benasciutti D. Some analytical expressions to measure the accuracy of the “equivalent von Mises stress” in vibration multiaxial fatigue. Journal of Sound and Vibration, Vol. 333, 2014, p. 4326-4340.
-
Mršnik M., Slavič J., Boltežar M. Frequency-domain methods for a vibration-fatigue-life estimation – application to real data. International Journal of Fatigue, 2013, Vol. 47, p. 8-17.
-
Dirlik T. Application of Computers in Fatigue Analysis. Ph.D. Thesis, The University of Warwick, 1985.
-
Paulus M., Doughty K. Effect of resonant frequency shifting on time to failure of a cantilevered beam under vibration. Journal of the IEST, Vol. 53, Issue 1, 2010, p. 59-68.
About this article

