Abstract
A vibration signal of an internal combustion engine contains several diagnostic information, which are for the most part not utilised since they require complex processing methods in order to separate useful data and noise elimination. The method of diagnostics of leakages in a system: exhaust valve – cylinder, on the basis of reference model of the vibration signal is presented in the paper. It is proposed the statistical autoregressive model of signal with abstractive parameters. The recursive time-varing parameters estimation in the model is performed by the Kalman filtering. The model presented in the paper is illustrated with the signal of the spark ignition combustion engine Fiat Punto. The results of the analysis of the engine vibration signal under conditions of a defected exhaust valve and an increased valve clearance are presented. During road tests the vibrations acceleration signal was recorded as well as certain auxiliary signals used for a synchronisation and identification of engine timing.
1. Introduction
A vibration engine signal is a result of superposition of periodical components related to rotations of a crankshaft, gearbox operation etc. as well as damped vibrations being impulse responses to such operations as: valve opening and closing, ignition, piston stroke etc., occurring in a relevant succession and in an appropriate time sequence. Attempts to model this signal are described in [1, 2]. It contains several diagnostic information for the most part not used, since it requires complex processing in order to separate useful components and to eliminate interferences. Whereas a continuous development of signal processing methods, and availability of microcontrollers and signal processors enable an accurate signal analysis and separation of frequency components, in real time. However, only the formation of multi symptom system utilising additional information from the OBD system sensors has a chance to use the vibroacoustic signal fully.
A wear of elements and small mechanical defects cause the system adaptation to new parameters. Thus, in many cases the adaptive systems of engine controlling can be masking mechanical defects [3]. Examples of such defects are burning-out of exhaust valves or a not proper valve clearance.
The method based on the reference model of the time signal of engine vibrations is presented in the hereby paper. It is proposed the statistical (stochastic) autoregressive model of signal with abstractive parameters. The identification of the signal model realised in the hereby paper consists of the estimation of transmittance parameters determining a dependency between this signal and excitation of a white noise character. Thus, the signal can be treated as time series of data originated from the dynamic system described by stochastic state and output equations. The Kalman filter method seems to be a natural solution of the model parameters identification problem [4]. This filter allows the identification of past and current states as well as forecasting future signals, even when there is a lack of accurate knowledge of their waveforms and uncertainty of the model. Since this is a recursive method, the current model actualisation with each successive measurement is possible. An algorithm realized on-line provides not only parameter values but also an accuracy measure of their estimation represented by the estimation error covariance. There is a possibility of readjusting a measurement time to assure the assumed accuracy or identification of changes in the recorded signal, if the accuracy cannot be obtained on the grounds of the given number of the time series samples [5, 6].
2. Description of examinations
Examinations were performed during road tests on the four-cylinder engine of spark ignition of Fiat Punto 1.4 of 400 000 km mileage. Series of engine vibration measurements for various rotational speeds and loads were performed. The main measuring path included the piezoelectric vibration sensors B&K Delta Shear type 4393 of a frequency range: 0.1 – 16500 Hz, resonance frequency 55 kHz and work temperatures from –74 to +250 oC, fastened by means of a joint screwed into the engine side at cylinder 1, and the portable device for recording data B&K PULSE type 3560E. Accelerations of engine block vibrations were recorded in the vertical and horizontal directions with a frequency of 65536 Hz. Then the signal was pre-processed with antialiasing filter to avoid amplifying the components in the natural frequency band of the vibration sensor.
Apart from the engine vibrations signal also the crankshaft position signal, throttle position and signals from the ignition coil at 1 and 4 cylinders were recorded. Additional signals enabled the identification of engine working cycles, injection moments, ignition and timing of gear phases. Signals of 1-minute duration were recorded during driving with a constant speed. Small speed fluctuations were eliminated during further analysis. Maintaining the constant rotational speed of the engine is essential, since this parameter has a significant influence on the vibration amplitude. A load influence is not as important as speed.
Examinations were performed for various conditions of the exhaust valve:
• Valve in a good working order, optimal clearance (0.25 mm),
• Valve in a good working order, increased clearance +0.06 mm,
• Valve out of order I (small defect), optimal clearance,
• Valve out of order II (large defect), optimal clearance,
• Valve out of order, increased clearance.
Valve defect I constituted the valve head cut 3 mm long, while defect II had this cut increased to 6 mm.
Instantaneous time progresses of the acceleration of vibrations for various conditions, with the marked moments of opening and closing of the exhaust valve, are presented in Fig. 1.
It was observed, in all mentioned types of leakage in the system: exhaust valve – cylinder, that in the time progress of vibration the signal responses for the valve opening and closing are dominating.
The vibration signal was resampled in order to equalise the number of samples analysed in each cycle of engine operations. This procedure enabled changing the domain from the time into the angle of rotation of the crankshaft, during the analysis.
In the moment of the valve opening and closing the components of vibrations of frequencies super positioning on the system components natural frequency are generated, which causes natural amplification of the measuring element vibrations. This explains the impossibility of differentiating the wear degree of valve defect. The simultaneous clearance increase and the valve defect do not cause noticeable signal changes.
The next step in the analysis constituted windowing of the vibration signal, which means leaving only the vibration response related to the operations of the exhaust valve of cylinder No. 1. The exhaust valve opening for the examined engine occurs at 43o before BDC (Bottom Dead Centre), while closing starts at 5o after TDC (Top Dead Centre). These moments can be precisely determined on the basis of the signal from the crankshaft sensor during the analysis. At the on-line analysis the accuracy depends on the complexity of the algorithm of the crankshaft rotation angle determination. More information about investigations can be found in [7].
Fig. 1Instantaneous time progress of the acceleration of engine vibrations in the horizontal direction – for two cycles of engine operation and 3000 rpm: a) good, b) burn, c) enlarged clearance
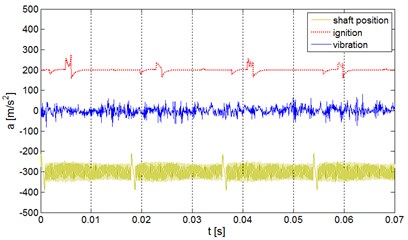
a)
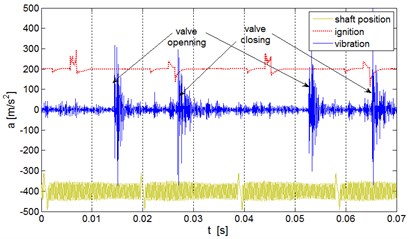
b)
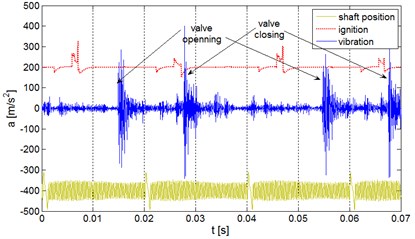
c)
3. Identification of the AR model with the Kalman filter application
Let us assume, that the recorded vibration signal is the response of the linear discrete non-stationary system on which input the white Gaussian noise was put.
Thus the time series can be described by the time-varying autoregressive model AR() of coefficients depended on the sampling moment , for 1, 2, ..., [8]:
where – recorded output signal, – represents white noise process and:
Let us assume the following notations:
for the vector formed from the identified parameters in the th sampling moment:
for the vector formed from the successive values of the signal recorded in previous moments.
Let the variability of the vector of parameters will be described by the random walk process. In such case the signal is modeled by means of simplified stochastic equations of the process and measurement:
where and represent the uncorrelated zero-mean white Gaussian stochastic processes with covariance matrices, , for the process and , 1×1, for the measurement, respectively.
For the needs of the estimation of parameters the innovative form of the above model was applied in the paper:
where is the estimate value of the model parameters vector in the th sampling moment and , is the matrix of the Kalman filter amplification, which minimizes the mean of the squared error of the estimation and is determined by the formula:
moreover:
it is the measurement corrected matrix of the covariance of the model parameters estimation error, .
Both above models (5, 6) and (7) are equivalent, since they simulate the same signal , despite the fact that the state vector as well as the process noise are differently defined in these models.
The recurrence procedure of the model parameters identification encompasses initiation by estimating the initial conditions , , , and determination in successive filtration cycles:
1. Amplification matrix acc. (8),
2. Estimate of the parameters vector acc. (7),
3. Matrix of the estimation error covariance acc. (9).
The accuracy measure of the recorded signal reproduction is the measurement residual, calculated in each algorithm cycle on the basis of the actual signal value and its estimate:
The filter operation quality indicator constitutes the estimation error variance matrix , where is the matrix of the covariance of the model parameters error estimation in the steady state.
4. Model verification and model based diagnostics
The output valve damage causes changes of the time waveform of vibrations during opening and closing of a valve. These parts of the signal should be accurately selected. The further analysis was performed for the moment of closing the output valve. Analogous procedure should be performed for the moment of valve opening.
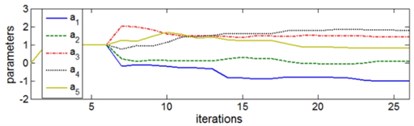
The vibration response of the engine block for closing the output valve in a good technical condition in three consecutive work cycles (time window) is presented in Fig. 2.
Fig. 2Vibration response of the system for closing of the good output valve for three successive cycles of the engine operation
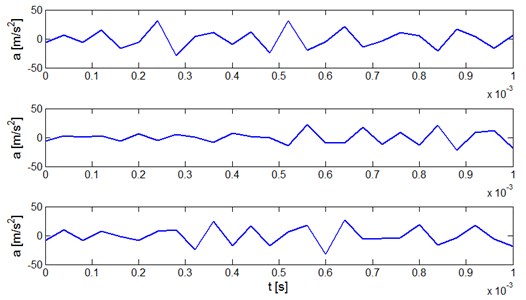
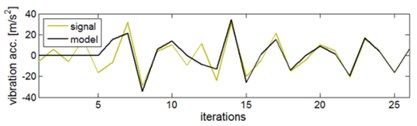
The signal is of a stochastic character. The identification of the model for the waveform No. 1 can be done by the method described above. The way of the vibration signal on-line model identification is shown in Fig. 3. It is seen (Fig. 3a) how the signal model traces the actual signal at the end of the time window and adjusts to it. The lower diagram (Fig. 3b) shows in what way model parameters are changing.
Finally, the reference model of vibration signal for the system response for closing the exhaust valve can be written as:
Fig. 3Identification of the vibration signal on-line model: a) vibration response signal for closing the exhaust valve and ‘tracing’ model, b) steadying parameters of the AR model
a)
b)
The verification of the model was performed for successive work cycles of the valve in good technical condition. Fig. 4 presents the residual signal for three successive cycles.
Fig. 4Residual signal for three successive responses for closing the exhaust valve which is in good technical condition
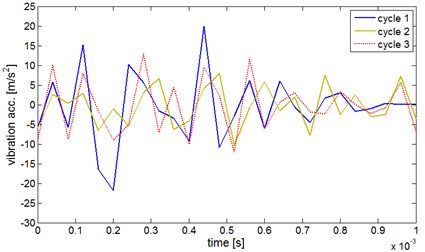
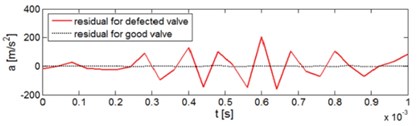
The system response for closing the defected exhaust valve for three successive work cycles is presented in Fig. 5a. In consideration of resonance effects signals are reproducible. When the reference model was applied the residual was obtained as seen in Fig. 5b.
Fig. 5Diagnostics of the valve defect on the basis of the vibration signal reference model: a) vibration response of the system for closing the defected exhaust valve for three successive engine work cycles, b) comparison of the residual for the defected valve and for the valve in good technical condition
a)
b)
When the residuals for various cases of the exhaust valve wear were determined the effective values were calculated from the formula:
where: – residual, – number of iterations (in this case 26).
The measure was averaged for 20 successive work cycles. The calculation results are listed in Table 1.
Table 1List of effective values of the residual of the engine block vibration responsesfor closing the exhaust valve in good technical condition and with various defects
Investigated case | Avaraged RES for 20 cycles [m/s2] |
Valve in a good working order, optimal clearance (0.25 mm) | 7.5 |
Valve in a good working order, increased clearance +0.06 mm | 82.7 |
Valve out of order I (small defect), optimal clearance | 45.4 |
Valve out of order II (large defect), optimal clearance | 89.3 |
Valve out of order, increased clearance | 90.4 |
5. Conclusions
Burning-out of exhaust valves or a not proper valve clearance can be masked by the adaptive control systems of the i. c. engine. The diagnostics on-line method of the engine exhaust valve, based on the vibration signal model of the engine block, was proposed. For this purpose defining the signal model and its easy identification is necessary. The autoregressive model was proposed in the paper and for its identification the Kalman filter method was suggested. Diagnostics is based on comparing the effective value of the residua of the real signal and synthetic - determined from the measurement and model coefficients. The method verification was carried out for the real object, the Fiat Punto engine.
References
-
Komorska I. Modeling of vibration signal for reciprocating engine diagnostics. Diagnostyka, Vol. 50, Issue 2, 2009, p. 23-26.
-
Komorska I. The diagnostic model proposition of the engine vibration signal. Journal of Kones, Vol. 15, Issue 2, 2008, p. 191-198.
-
Dąbrowski Z., Madej H. Masking mechanical damages in the modern control systems of combustion engines. Journal of Kones, Vol. 13, Issue 3, 2006.
-
Kalman R. E. A new approach to linear filtering and prediction problems. Transactions of the ASME, Journal of Basic Engineering, Vol. 82 (Series D), 1960, p. 35-45.
-
Young P. C. Recursive Estimation and Time-Series Analysis. Springer-Verlag, Berlin, Heidelberg, 2011.
-
Isermann R., Münchhof M. Identification of Dynamic Systems, Springer-Verlag, Berlin, Heidelberg, 2011.
-
Komorska I. Vibroacoustic Diagnostic Model of the Vehicle Driving System. Radom: ITE-PIB, 2011.
-
Young P. C. Gauss, Kalman and advances in recursive parameter estimation. Journal of Forecasting, Vol. 30, 2011, p. 104-146.
About this article

