Abstract
In this paper, delamination detection of composite beams is investigated through a transient wave analysis method. A higher-order beam theory is proposed to model the Lamb wave propagation behavior. Wavelet Transform (WT) is used to localized the delamination. The reflection ratios and transmission ratios are found to depend strongly on the frequency of the incident flexural waves, as well as the size of the delamination. So it can be well used to detect the small size of the delamination, which is important for the Structural Health Monitoring (SHM). The numerical results show that the localization and identification of the size of the delamination are feasible by the proposed approach, which is the essential first step for the enhancement of safety and reliability of composite structures. The results are being verified by the experiments.
1. Introduction
Development of active diagnostic methods to localize and then identify the size of damages in critical components before the integrity of the structure is compromised by the growth of damage to a critical state is important in the design, construction, and operation of SHM systems. Composite structures have been widely used in aerospace vehicles because of their superior specific strength and stiffness. Due to its inherent low interlaminar strength, delamination can often occur under loading. This form of damage can also cause during the manufacturing process and mainly from impact [1-3]. However, in a situation known as an inverse problem, damage identification cannot be achieved through forward logical derivation. In the majority of documented research literatures, delaminations in one-dimensional composite beams or two-dimensional plates [4-7] were specifically investigated, in which the delamination, a complicated three-dimensional pattern, usually has to be simplified by the application of certain scenarios, resulting in approximate simulations.
Efforts in the essential work focus on a Lamb wave propagation-based delamination identification scheme for composite beam. Stress waves propagating in plate-like structures in directions parallel to the plate surfaces are defined as Lamb waves or guided elastic waves. An alternative approach would be to employ higher order plate theories [8] to characterize the flexural waves and the extensional waves. Due to the delamination damage in composites is often with finite sizes, Wahyu Lestari et al. consider the arrived time of the propagated waves to determinate the two rigid of the delamination, then get the size of the delamination [9]. However, the size of detected delamination is about 50 mm, and the results are not very well. In this paper, a new proposed method is developed to detect the smaller size by analyzing the multiple reflection and transmission behavior in the composite beam containing delamination. The present work is to optimize to achieve a maximum sensitivity of the size detecting method. And the experiments are being prepared.
2. Dispersion relationships
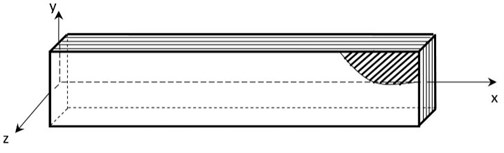
In the right handed coordinate system of Figure 1, the beam centroidal axis is taken to be the x-axis. With the Timoshenko beam assumption, the equilibrium equations were constructed for the symmetric laminated beam. The formulation as follows:
where , an unknown, is the axial displacement of the beam in -direction; , an unknown, is the lateral displacement of the beam in -direction; , also an unknown, is the rotation of the cross section of the beam about the x-axis:
is the axial force per unit beam width, is the axial stress of each lamina:
is the shear force per unit beam width across the cross-section of beam, and is the shear stress of each lamina:
is the bending moment per unit beam width:
is the translational inertia per unit beam width, and is the mass density of the lamina:
is rotational inertia per unit beam width.
Fig. 1The geometry of the composite beam
The strain and stress relationship for the -th layer of the laminated beam is:
where are the transformed stiffness terms; are the shear correction factors.
For the slender laminate beam, we can assume , then Eq. (4a) and (4b) simplify to:
Then Eq. (1) can be written as:
If the displacements are introduced as:
The dispersion relation of flexural waves can be expressed as follows:
where , are the terms of extensional stiffness and bending stiffness.
There are four roots of Eq. (8):
where:
Depending on the frequency, there are either only two propagating waves (one positive-going and one negative-going) plus two evanescent (near-field) waves or four propagating waves (two positive-going and two negative-going). The cut-off frequency for the second flexural mode, obtained by setting 0, is:
Phase velocities and group velocities are given by:
Take a composite beam made of IM7/5250-4 graphite/epoxy material as an example. The fibers are aligned with the beam axis, and cross section is rectangular. In other word, it is a unidirectional rectangular composite beam. The parameters for IM7/5250-4 are shown in Table 1. The dispersion curves are shown in Figure 2 together with the three-dimensional elasticity solution [8]. Obviously, the Timoshenko beam theory is accurate for the first flexural mode in the whole frequency domain. The second flexural mode is well matched with 3-D elasticity solution in the lower frequencies. However, as the frequencies go higher, the two curves are deviated from each other.
Table 1Properties of IM7/5250
(Gpa) | (Gpa) | (Gpa) | (Gpa) | (kg/m3) | ||
168 | 9.31 | 5.17 | 3.45 | 0.33 | 0.4 | 1.61 |
Fig. 2Flexural waves in a composite beam: a) phase velocity, b) group velocity
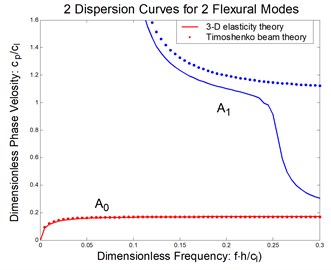
a)
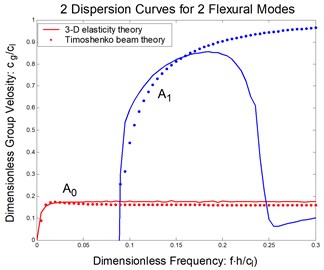
b)
For the extensional mode, there is a non-dispersive wave of Timoshenko beam. The wave number can be express as follows:
Both phase velocities and group velocities equal , where .
3. Reflection ratios and transmission ratios
A general solution of the Eq. (5b) and Eq. (5c) is given by:
where can be given by the eigenvector of the dispersion relations.
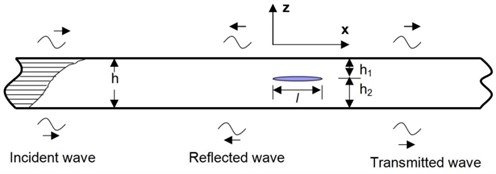
Consider a slender beam contain a delamination shown in Figure 3. The beam is separated to three parts, left part, right part, and delaminated part (damage part). And in the delaminated part, the beam is split into two beams. In every part, transient wave propagation is different.
Fig. 3Wave propagation in a composite beam containing a delamination
In the left part () it includes the positive-going incident waves and negative-going reflected waves. It can be written as:
Due to asymmetric delamination, an extensional wave is also reflected from and transmitted into two split beam region. The negative-going reflected extensional wave in the left part can be expressed as:
Since the second wave number is a pure imaginary when the frequency is below the cut-off frequency, i.e., , the sign of should choose minus according to Eq. (9). Otherwise, the magnitude of the second term of Eq. (15) would be infinite when the excitation is located at For brevity, the term is suppressed in the later discussion.
In the right part () it includes the positive-going transmitted wave. It can be written as:
The positives-going transmitted extensional wave in the left part can be expressed as:
In the delaminated part (), the displacements of two split beams are denoted by , , , , the indicate means delaminated part while 1, 2 is used to distinguish the two beams. Then, the following governing equations can be derived:
for the first split beam, and:
for the second split beam.
Assume the displacement of two beams as follows:
Substituting Eqs. (19a) and (19b) into Eqs. (17a), (17b), (18a) and (18b), the dispersion relations can be expressed as:
where:
There are eight roots of Eq. (20), so the general solution of the wave propagation in the delaminated part contains eight terms, in which four of them are positive-going waves and another four of them are negative-going waves. Neither of them can be eliminated because the size of delamination is finite. So the wave propagation in the delaminated part can be described as:
where the ratios , and can be determined by substituting Eqs. (19a) and (19b) into Eqs. (17a), (17b), (18a) and (18b). The extensional waves in the two split beam are given by:
There are a total of 18 unknowns witch can be determined from the following continuity and equilibrium conditions at and :
where , , , are denoted at Eq. (2). Substituting all the referring quantities into Eq. (23), the following relations implicate the reflected and transmitted behavior of the incident positive-going waves:
where matrixes depend on frequency and size of the delamination ; vectors and are the unknown vectors; vector is the known vector which means the amplification of the incident positive-going waves. Eq. (24) can be solved as:
Let the coefficient matrix be and be . Define the reflected vector and transmitted vector as: and , then the reflected vector and transmitted vector can be solved as:
where:
are defined as reflected and transmitted ratio matrixes respectively. They are strongly depended on the frequency of the incident wave, as well as the size of the delamination. In this study, it can be used to detect the size of the damage, especially for the small size.
Considered a symmetric delamination , the reflection ratios and the transmission ratios versus the frequency of the incident flexural waves with the fixed delaminated sizes are shown in Figure 4 and Figure 5. The reflection ratios and the transmission ratios versus the size of the delamination with the fixed frequencies are shown in Figure 6 and Figure 7. Numerical results show that the reflection ratios and the transmission ratios are given by curves which are not monotonic. Some of them give a pass/stop behavior. This would be discussed in the next section. Figure 4(a) and Figure 5(a) show that reflection ratios R11 and R12 are close to zero when the frequency is higher than the cut-off frequency of the second flexural mode. It means the first flexural mode will not be reflected in the higher-first-mode frequency domain.
Fig. 4Reflection and transmission in a symmetric delamination with the size l=2h: a) reflection ratios, b) transmission ratios
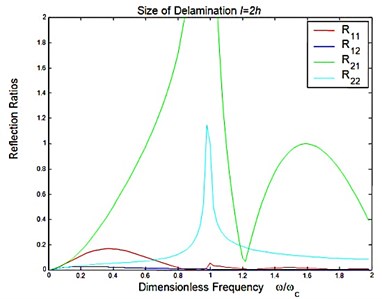
a)
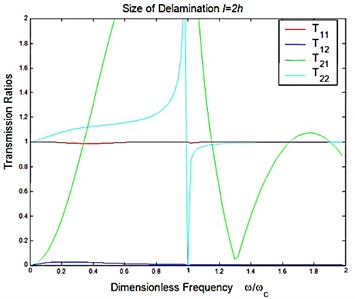
b)
Fig. 5Reflection and transmission in a symmetric delamination with the size l=5h: a) reflection ratios, b) transmission ratios
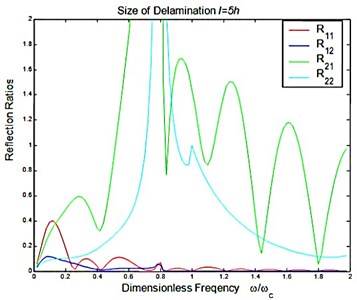
a)
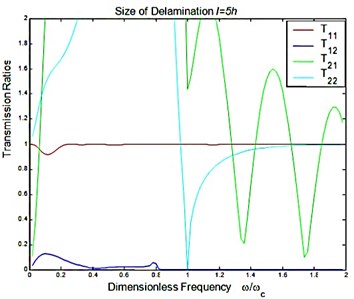
b)
4. Feasibility study of wave analysis
In this section, a proposed method is developed to detect the delamination in the composite beam. This method contains two parts, one is localization and the other is size identification.
The difficulty of applying ultrasonic waves based monitoring in SHM lies in that the raw sensor signals are not inherently interpretable due to their dispersive properties and complicated mode conversion phenomena [10]. Time-frequency representations using wavelet transform seem to be an effective way to resolve the dispersion relationships for Lamb waves [11]. It can be well localized the position of the damage, but the size of the damage cannot be accurate detected [9]. In this study, a new method is introduced here, which using the WT analysis to localize the position while using reflection and transmission analysis to determinate the size.
Fig. 6Reflection and transmission in a symmetric delamination at the natural frequency of the incident wave being 75 KHz: a) reflection ratios, b) transmission ratios
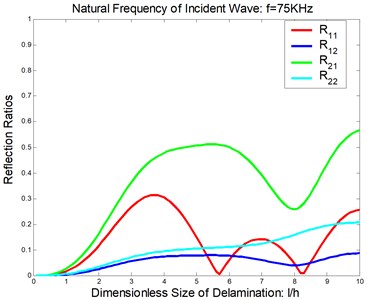
a)
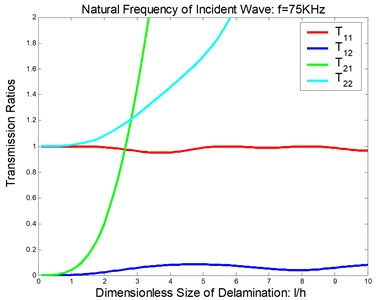
b)
Fig. 7Reflection and transmission in a symmetric delamination at the natural frequency of the incident wave being 150 KHz: a) reflection ratios, b) transmission ratios
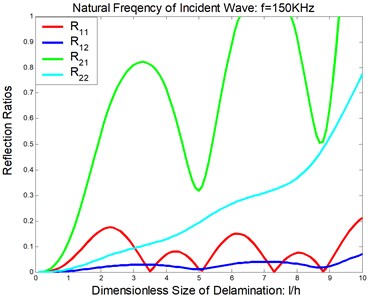
a)
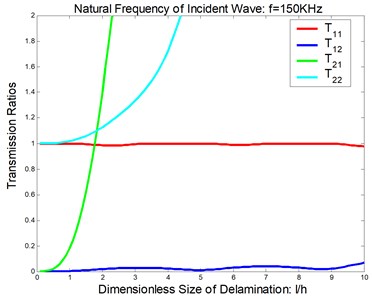
b)
5. Feasibility study of wave analysis
In this section, a proposed method is developed to detect the delamination in the composite beam. This method contains two parts, one is localization and the other is size identification.
The difficulty of applying ultrasonic waves based monitoring in SHM lies in that the raw sensor signals are not inherently interpretable due to their dispersive properties and complicated mode conversion phenomena [10]. Time-frequency representations using wavelet transform seem to be an effective way to resolve the dispersion relationships for Lamb waves [11]. It can be well localized the position of the damage, but the size of the damage cannot be accurate detected [9]. In this study, a new method is introduced here, which using the WT analysis to localize the position while using reflection and transmission analysis to determinate the size.
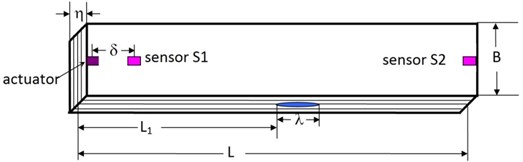
A designed simulative experiment is introduced to demonstrate the feasibility of this theoretical approach, and also for preparing the actual experiment. The simulative specimen of the composite beam containing delamination, which was made of IM7/5250-4 graphite/epoxy material, is sketched in Figure 8 showing the dimensions and the location of the sensors and actuator. The material properties are given in Table 1.
Fig. 8Geometry and dimension of the beam
5.1. Localization
The continuous wavelet transform (CWT) of a function is defined by:
where and superscript * denotes a complex conjugation. The kernel function in the CWT:
is generated by shifting and scaling the mother wavelet , where and are known as the scale and translation parameters, respectively.
The location of the peak on the plane corresponds to the arrival time of the wave having frequency [12]. In this study, the distance , i.e., the location of the left rigid of the delamination in Figure 8, can be determined by:
where is the group velocity at frequency , is the arrival time of the reflected wave at left rigid of the delamination, which is received by sensor S1.
The location of right rigid of the delamination can be also got by this method, and then the size of the delamination can be determined as the distance of the two locations. However, there is an error which is about 10-20 mm [9], which can be ignore while compared with the whole length of the beam. Using this method to determinate the size of the delamination, the error may be 20-40 mm. And it is large enough while compared with the actual size. In other words, it cannot identify the size of the damage which is not large enough.
5.2. Size identification
To identify the size of the delamination, a simulative experimental study is conducted. In Figure 8, 2.5 mm, 20 mm, 20 mm, 300 mm, 600 mm, while is to be identified. The strain signal drives an actuator to generate transient waves. The function generator generates a tone-burst, narrowband modulated sinusoidal input voltage signal and applies it to the actuator according to the formula:
where is the amplitude of the excitation signal, is the central frequency and is the unit step function.
Sensor S1 is used to receive the reflected signal together with the incident signal, while sensor S2 is used to receive the transmitted signal. Employing the low excited frequency comparing with the cut-off frequency (2.25 MHz), it is only need to consider the first mode of flexural mode. Consequently the Fourier transform of the signal received by sensor S1 reduce by the incident signal and S2 can be given by:
The time domain signal of the reflected wave and transmitted wave can be obtained by the inverse Fourier transform. Figure 9 shows the reflected and transmitted signals with size of the delamination be 10 mm at the fixed central frequency being 100 KHz. Figure 10 shows the maximum magnitude of the reflected and transmitted signals versus the size of the delamination at different central frequency.
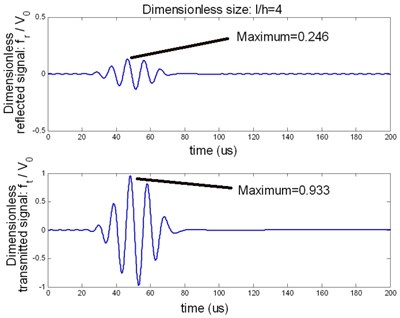
Fig. 9. The reflected and transmitted signal with 10 mm, 100 KHz
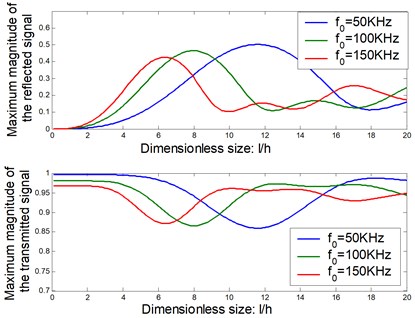
Fig. 10. Maximum magnitude of the reflected and transmitted signal at the different size of the delamination
It can be seen that the reflected signal is more sensitive than the transmitted signal with the changing delaminated size. The curves which describe the changing magnitude of reflected signal versus the delaminated size is close to a linear curve at the small sizes domains. It is useful to determine the size of the delamination. And the more important is that the useful domain is depended on the central frequency of the excited signal.
Figure 10 shows that with a lower central frequency, it can enlarge the identified domain, but it cannot accurately identify the small sizes. For example, when the central frequency is at 50 KHz, the effective identifiable domain is about 3 h–12 h. With a higher central frequency the useful domain becomes smaller, but it can detect the small size of the delamination. When the exited frequency is 150 KHz, the smallest size can be identified about 5 mm. It is useful to optimize the excited frequency to achieve a maximum sensitivity.
It should be noticed that, when choosing a lower frequency to get a larger identifiable range, the frequency cannot be too low, because the dispersion curve will become very cliffy, which can provide a strong dispersive behavior.
6. Conclusions
The dispersion relationships of the composite beam are obtained by using a Timoshenko beam theory. An analytical solution of the reflected and transmitted behavior is obtained by analyzing the transient wave propagation in an asymmetric split beam which is represented by a delamination in the compost beam. The reflected ratios and transmitted ratios are strongly depended on the frequency of the incident wave, as well as the size of the delamination. A new method is developed to identify the size of the delamination. Numerical results show that it is an effective method for size detecting, especially for the smaller sizes. The experiment is being prepared to verify the accuracy.
References
-
Lin M., Chang F. K. The manufacture of composite structures with a built-in network of piezoceramics. Composites Science and Technology, Vol. 62, Issue 7-8, 2002, p. 919-939.
-
Li S., Reid S. R., Zou Z. Modeling damage of multiple delaminations and transverse matrix cracking in laminated composites due to low velocity lateral impact. Composites Science and Technology, Vol. 66, Issue 6, 2006, p. 827-836.
-
Rahul Sandeep G., Chakraborty D., Dutta A. Multi-objective optimization of hybrid laminates subjected to transverse impact. Composite Structures, Vol. 73, Issue 3, 2006, p. 360-369.
-
Islam A. S., Craig K. C. Damage detection in composite structures using piezoelectric materials. Smart Mater. Struct., Vol. 3, Issue 3, 1994, p. 318-328.
-
Kessler S. S., Spearing S. M., Atalla M. J. In-situ damage detection of composites structures using Lamb wave methods. In: Balageas D., Editor, Proceedings of the 1st European Workshop on Structural Health Monitoring, 10–12 July, Paris, France, 2002, p. 374-381.
-
Inada T., Shimamura Y., Todoroki A., Kobayashi H., Nakamura H. Damage identification method for smart composite cantilever beams with piezoelectric materials. In: Chang F.-K., Editor, Structural Health Monitoring, 2nd Ed., Lancaster: Technomic, 1999, p. 986-994.
-
Wisnom M. R., Change F.-K. Modeling of splitting and delamination in notched cross-ply laminates. Composites Science and Technology, Vol. 60, Issue 15, 2000, p. 2849-2856.
-
Wang L. Elastic Wave Propagation in Composites and Least-Squares Damage Localization Technique. M. S. Thesis, North Carolina State University, 2004.
-
Lestari W., Qiao P. Z., Song G. B. Feasibility study of wave analysis for delamination detection of thick laminated composite beams. Proc. of SPIE, Vol. 5057, 2003, p. 543-550.
-
Alleyne D. N., Cawley P. The interaction of Lamb waves with defects. IEEE Transactions on Ultrasonics, Ferroelectrics and Frequency Control, Vol. 39, Issue 3, 1992, p. 381-397.
-
Niethammer M., Jacobs L. J., Qu J., et al. Time-frequency representations of Lamb waves. Journal of Acoustic Society of America, Vol. 109, Issue 5, 2001, p. 1841-1847.
-
Jeong H., Jang Y. S. Wavelet analysis of plate wave propagation in composite laminates. Composite Structures, Vol. 49, Issue 1, 2000, p. 443-450.
About this article

