Abstract
An estimation method of the combustion chamber pressure, in an internal combustion engine, based on the processing of the vibration (acceleration) signal of the cylinder head, at constant speed and no load conditions is presented in this paper. The model is created based on the comparison of the vibration and pressure signals around the peaks of highest vibration, after a preprocessing and filtering of the signal using the most similar frequency bands between the sources. A polynomial regression is used between the selected data points to generate the resulting model relating pressure and vibration (and average rotational speed per cycle, calculated based on the vibration peaks). The model is tested with measurements from two spark ignited engine test benches: a single cylinder engine and a four-cylinder engine. The resulting model has very low computational cost and can provide a very accurate estimation of general shape and magnitude of the pressure trace, but does not reflect strongly cycle by cycle variations. Testing the Normalized Root Mean Square Error (NRMSE), where the best value is 100 % the single cylinder engine scores were 63.52 % and 20.02 % for the points before and after the vibration peak. For the four-cylinder engine those values were: 82.47 % and 28.27 % respectively.
1. Introduction
Vibrations analysis methods are common as fault detection and diagnosis tools for rotating machinery. The successful implementation of this method in various maintenance programs has motivated its application to internal combustion engines [1-5].
Condition monitoring on internal combustion engines has been mainly performed using combustion chamber pressure transducers [6, 7]. This type of sensor provides a great amount of information on the operating conditions of the engine, but its use for regular operation and monitoring is limited because of four main reasons: their price is too high, they are intrusive (since they go all the way into the combustion chamber), they are delicate and usually their location demands modification to the cylinder head that are expensive and difficult to perform [8]. These reasons have motivated the use of different sensors for the task, such as angular velocity measurement [9, 10], surface temperature and exhaust emissions, etc.
In the field of rotating machinery, great developments have been made in condition monitoring, in particular the determination of the condition of bearings. To this end, sensors based on the measurement of vibration have been used, mainly in terms of acceleration (accelerometers, acoustic emissions) that have allowed to differentiate defects based on developments in signal analysis, such as frequency analysis and fault characteristic frequency identification in each component of the bearings. There are commercially available systems that can perform this type of analysis but are very expensive, then the need for a low cost device for measurement and analysis of vibration resulted in an opportunity to perform research work for the Universidad Tecnológica de Pereira, in its research group Procesos de Manufactura y Diseño de Máquinas that leads projects like: I) Development of a pilot system for fault diagnostics in rotating machinery affordable to small and medium sized industries, II) Design and development of a prototype system for on-line diagnostics of internal combustion diesel engines on active duty based in mechanical vibrations: Application on massive public transport systems.
Since there has been a great amount of investment in mechanical vibration analysis equipment for companies, the use of sensors based on acceleration measurement has been encouraged for the condition monitoring of internal combustion engines, for example accelerometers [11-13], acoustic emission sensor [8] and knock sensor [14].
Engine accelerometer based monitoring, as non-intrusive technique is recommended to be applied because of its several advantages: the accelerometers can be placed externally to the engine without structural modifications, they are not requested to resist very high pressures and temperatures; they can provide alerts for abnormal operation to enable detection of the source of the abnormality, and to provide the means to estimate the severity of malfunctions evolving in the engine, related not only to combustion process but also to overall engine mechanical condition. Accelerometers are relatively cheap and are very sensitive to the operation of the engine. These characteristics allow these sensors to be used continuously, during service of the engine, opening possibilities for predictive maintenance programs, fleet management and client support.
The recent development of electronic systems and telematics, along with various wireless communication technologies has made it possible to connect and exchange information with a vehicle engine, e.g. by using GPS, tablets, and cell phones [15-17]. This opportunity to easily communicate with a vehicle and its electronic systems has introduced interesting possibilities for vehicle-related diagnostics, fleet management, and maintenance and repair services, based on novel non-intrusive monitoring systems, such is the vibration analysis method proposed in this paper.
Internet connection allows diagnosing and solving vehicle problems from a remote geographical location, e.g. a central service center or a local repair shop. The ability to wirelessly connect with a vehicle provides experts or service technicians with data that can be examined. Engine problems can be analyzed and some maintenance operations can be carried out remotely, and thus prevent the need of an appointment in a repair shop. If the problem cannot be managed remotely the service technician can inform the driver of a service appointment or send roadside assistance to the vehicle.
In this direction, to exploit the equipment and developments performed in mechanical vibration analysis and its capabilities as a continuous monitoring tool, it has been seen promising the development of a model that allows to relate mechanical vibrations to the combustion chamber pressure in an internal combustion engine, for constant operating conditions, extending the range of utility of the work done in the area of vibration signal analysis by the university and its research group.
To accomplish the stated goal, work has been carried out under two main principles: i signal analysis for pattern recognition that allows classifying engine conditions, ii) the reconstruction of the combustion chamber pressure based on the processing of measured signals.
Different methods have been used for signal analysis including frequency and time-frequency analysis [14, 18, 19], statistic characteristics extraction [20-22], energy [5, 8], parametric models [23] and neural networks [24, 25], all trying to differentiate faulty conditions by comparing measurements to a certain parameter or threshold extracted on normal operating conditions, to be able to alert and identify the fault, and also to estimate its intensity.
Since combustion pressure is considered to be the most meaningful indicator of engine operating conditions, a lot of effort has been spent on developing methods for its reconstruction from the processing of signals coming from less intrusive sensors [9, 26]. Signal processing methods have more frequently used models that correlate pressure in the combustion chamber with angular velocity or angular position of the crankshaft [9, 20, 27], but this measurement is not always so accessible and requires too much sensitivity on the sensor.
In this paper it is presented a method for the estimation of the combustion chamber pressure based on the processing of the vibration (acceleration) signal measured from a non-intrusive sensor. The proposed method is based on the comparison of the vibration (acceleration) and pressure signals, it includes frequency domain analysis to recognize the part of the vibration signal most related to the combustion chamber pressure allowing to setup a filtration method of the measured signals, a comparison between signals and data identification method based on the highest point in the vibration peaks, and a polynomial regression using two variables vibration (acceleration) and average rotational speed in the cycle (calculated based on the vibration peaks of location), to create the model for the combustion pressure. Coherence analysis was used to establish the optimal measurement location.
The paper initially describes the experimental setup used and measurement procedure performed, then it explains the analysis and processing method of the collected signals and the proposed estimation method. In the third part of the paper the validity, reach and characteristics of the proposed model are discussed, as well as its applicability to a multi cylinder engine. Finally, the main conclusions of this work are outlined at the end of the paper.
2. Experimentation
Fig. 1 presents the experimental test benches used in this study: the first of which consisted of a 143 cc, vertical, single cylinder, spark ignited internal combustion engine, the second was a two liter, four cylinders, spark ignited internal combustion engine from a truck, mounted on a movable structure. Both setups allowed easy access to the engine components and simplify condition monitoring, especially in terms of leaks and temperatures.
Fig. 1Experimental setup
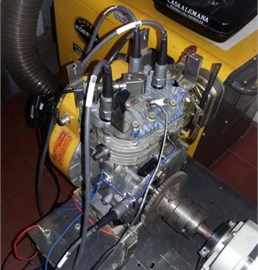
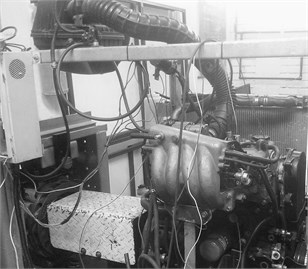
Measurements were performed using two different instruments: One accelerometer (positioned at the top of the engine in vertical position, on the four cylinder engine it was located in the middle of the cylinder head, in between cylinder 2 and 3, on the single cylinder engine it was located on the cylinder head, the orientation and location of it was selected based on coherence analysis) and a pressure sensor, in the four cylinder engine it was located on cylinder number one. All instruments’ signals were fed to a couple of data acquisition modules, NI 9232 3 channel +/–30 V analogue input module and a NI 9234 4 channel +/–5 V analogue input module, mounted on a four slots chassis (NI cDAQ 9174) for data acquisition, which sent the collected measurements via USB connection to a laptop which provided the means for storage to later perform the processing of the information. Tests were performed to establish stable speeds of the engine for measuring and reliable conditions on the long running periods of testing.
The testing procedure included measurements at constant speeds (set throttle position) under no load conditions. For the single cylinder engine five data sets for each of five different speeds were recorded, all working using commercially available fuel. For the four cylinder engine three different ethanol-gasoline fuel blends were used: commercial fuel E8, E20 and E30, for each fuel three sets of data for each of three different speeds were recorded.
3. Applied analysis
The proposed processing model aims at reconstructing the pressure signal measured inside the chamber from the vibration signal (acceleration) at the top of the cylinder head. The model was prepared, set up and tested first on the single cylinder engine and then it was applied on the four cylinder engine.
The first step for this purpose was to find the location of the accelerometer that provides the best relationship between the two signals using a coherence analysis. Several orientations were tested including vertical and horizontal (on a normal direction to the crankshaft axis) and several positions for the vertical sensors (on different attachment points, including bolts on the cylinder head and the housing for the crankshaft bearing).
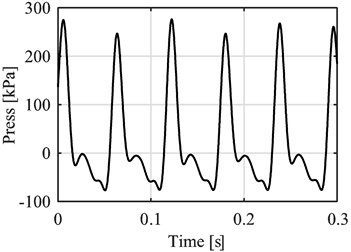
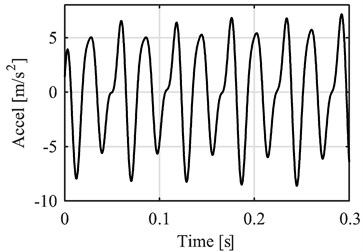
The coherence analysis revealed that the greatest correlation between vibration and combustion chamber pressure was provided by the accelerometer in the vertical orientation located on the cylinder head. With this information, the next step was to compare these signals. Fig. 2 presents both signals in the time domain.
Fig. 2Pressure and vibration signal in time domain
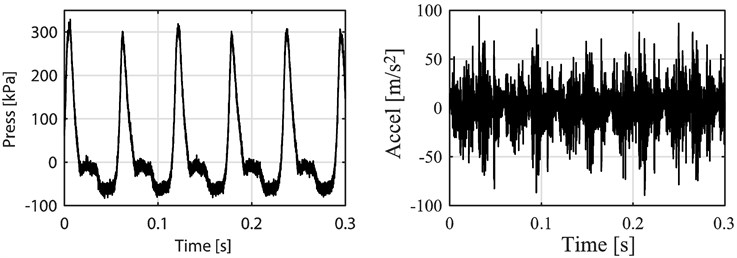
As can be seen from the Fig. 2 the relationship between signals is not so clear. To find the relationship it must be considered that the vibration signal is generated from several different sources. Not only the deformation, caused by the combustion pressure chamber, produces vibration, but also the movement of the mechanisms such as the valve train, the piston slap, resonances and the support of the engine influence this measurement. To better identify the part of the vibration signal related to the combustion pressure a Fast Fourier Transform (FFT) was applied to both signals. The results are presented in Fig. 3.
As can be seen from the frequency spectrum on Fig. 3(a) the content of the pressure signal is located basically on the lower part of the spectrum whereas acceleration signal (vibration) has content on low and medium frequencies as well as a little part of content on the higher bands. When focusing on that lower part of the frequency spectrum (Fig. 3(b)) the relationship between the signals becomes clearer. On the pressure signal the highest peak is the one corresponding to half the rotational speed of the engine, also called combustion frequency (On this particular case that peak is at 17.19 Hz, the rotational speed was 2089.1 rpm which corresponds to a 34.81 Hz frequency) related to the way a four stroke, one cylinder internal combustion engine works, one combustion every two revolutions, and then its five first harmonics also appear. For the acceleration signal the highest peak is the one at the revolution frequency (which is the frequency related to the rotational speed of the engine), which corresponds to every time the piston reaches top dead center, also present in the signal are the first three harmonics of the revolution frequency. Since the most notorious peaks in the pressure signal are the first four harmonics of the combustion frequency (the first four peaks), a low bandpass filter is applied to both signals at this frequency to reduce or eliminate vibration information from sources unrelated to the combustion process. The result of this filter is shown in Figure 4.
Fig. 3FFT analysis of the pressure and vibration (acceleration) signal
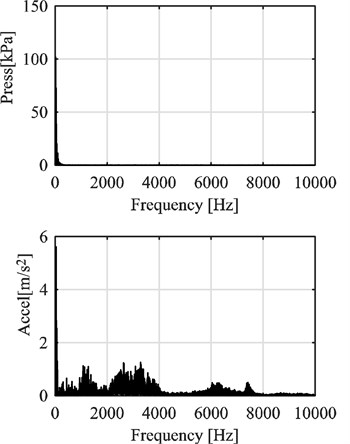
a) High frequency
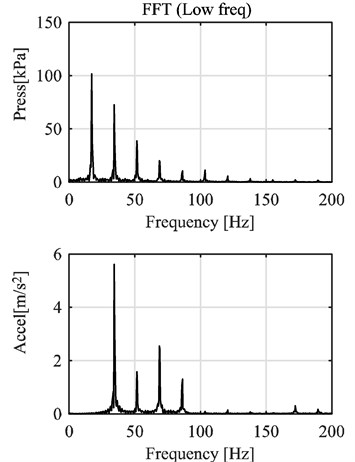
b) Low frequency
Fig. 4Filtered pressure and vibration signals
a) Filtered pressure
b) Filtered acceleration
Considering the similarities between the filtered signals, a direct relationship was established. For the proposed method only the part of the pressure signal around the peak was considered.
As such every peak in the pressure signal was compared to its corresponding peak in the vibration signal. In order to make it work only on the vibration signal, a reference point was established at the highest value of the vibration on each peak. Then a point by point comparison between signals was carried out, before and after the reference point. Fig. 5 presents the example of the data before the reference point.
A certain amount of data points were located before the reference point in the vibration signal, and then on those exact time values their corresponding pressure values were located and compared to the vibration. The same process was followed with the data after the reference point.
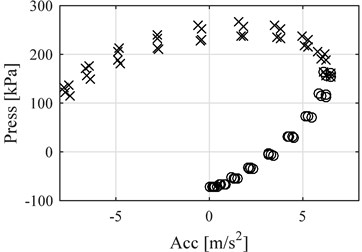
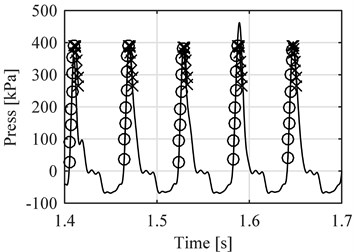
This data was then put together for each point in all the cycles recorded on each measurement. An example of this relationship between pressure and vibration in several cycles from a single measurement performed at constant throttle position can be seen on Fig. 6. This figure presents with circles the points before the reference point and with an the points after.
From this behavior it can be seen that there seem to be a mathematical relationship between pressure and vibration that can be described with a polynomial function. The same procedure performed on the other measurements revealed that the speed of the engine affected this relationship, and based on the time it takes between vibration peaks, an average rotational speed for each cycle was calculated and added to each pressure and vibration data pair, thus allowing to create a model in the form:
where is the acceleration value of the vibration signal and is the average rotational speed at each time point. The polynomial constants are , and the polynomial degree for the effect of the vibration is and for the effect of the speed is . Considering the shape of the relationships and some testing, the values selected for and were 4 and 1 respectively. Then the proposed model has the following form:
Fig. 5Data selection before the reference point (vibration acceleration peak)
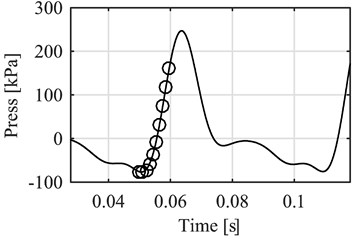
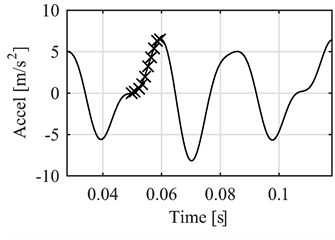
Fig. 6Pressure vs vibration acceleration around the reference points at several cycles under the same conditions
The signals measured are separated, half for the purpose of generating the model and half for evaluation of the results. Applying the polynomial regression on the data from before and after the reference point at the vibration peaks, yields the following results for the model:
Using the models generated, an evaluation is performed on the other half of the measured data. Then, using only the vibration data, an average rotational speed between cycles is calculated and both the vibration and the speed are introduced in the proposed model. An example of the results is presented in Fig. 7.
Fig. 7Comparison between measured pressure (continuous line) vs. estimated pressure (circles before reference point, exes after), single cylinder engine
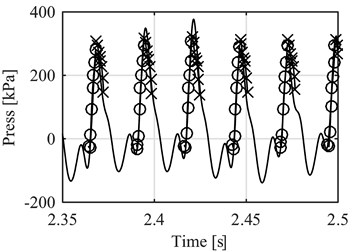
Fig. 8NRMSE for the points before reference point compared to the average speed of each data samples. Single cylinder engine
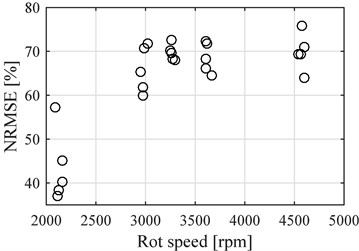
The performance of the model was evaluated using the normalized root mean square error (NRMSE), on the 25 evaluation data sets. This evaluation gives a percentage rating where a 100% value means the signals are exactly the same. Fig. 8 presents the results for the model using points before the reference point and Fig. 9 presents the results after de reference point, both compared to the average rotational speed of the engine at the time of the measurements.
Fig. 9NRMSE for the points after reference point compared to the average speed of each data samples, single cylinder engine
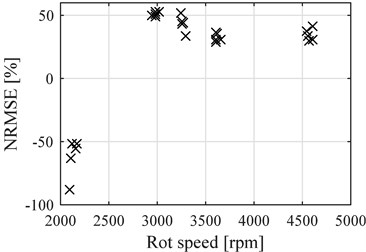
Fig. 10Comparison between measured pressure (continuous line) vs estimated pressure (circles before reference point, exes after), four cylinder engine
The average NRMSE for the data before the reference point is 63.52 %, whereas for the data after the reference point the average is 20.02 % (Significantly lowered by the negative values obtained at lower speeds, disregarding this values the average would have been 40.50 %).
As was stated at the beginning, a second test bench was used with a four cylinders engine, using three different fuel blends. Applying the exact same method the results obtained were as follows:
Again, half the measured data was used for evaluation purposes of the obtained model. An example of the results of using the vibration data for evaluation is presented on Fig. 10.
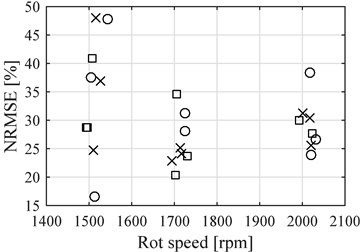
Fig. 11 presents NRMSE values for the proposed model for the four cylinder engine using points before the reference point and Fig. 12 presents the results after de reference point, both compared to the average rotational speed of the engine at the time of the measurements.
Figs. 11 and 12 present the NRMSE results for E8 blend with circles, E20 with exes and E30 with squares. The average value of NRMSE for the points before the reference point was 82.47 % and for the points after it was 28.27 %. The effect of having different fuels was not noticed at medium or high speeds with data before the reference point, where the results of all three fuels in NRMSE were very similar. Only at low speeds E8 results are different significantly generating less accurate results.
Fig. 11NRMSE for the points before reference point compared to the average speed of each data samples (Circles E8, Exes E20 and Squares E30), four cylinder engine
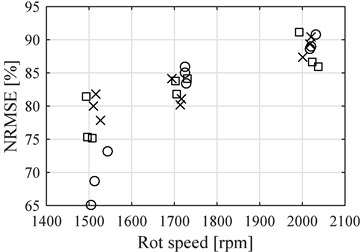
Fig. 12NRMSE for the points after reference point compared to the average speed of each data samples (Circles E8, Exes E20 and Squares E30), four cylinder engine
4. Discussion
From the NRMSE analysis on both engines it can be seen that the lowest values appeared on the data selected after the highest value of each vibration peak (reference point), compared to the points before such point. This can be attributed to the fact that the part after the vibration peak is closely related to the top of the pressure peak which is the part that contains the highest variability on a cycle to cycle basis, because of the presence of the combustion itself. This can be seen on other comparisons from the results as well.
When comparing the results from the two test benches, the single cylinder (150 cc) and the four cylinder (2000 cc) engines, it can be seen that the NRMSE values were considerably higher on the four cylinder engine. This can be attributed to the inertial forces which were considerably higher on the much bigger and heavier multi cylinder engine having a higher contribution to the pressures inside the chamber in comparison to the combustion, and reducing the cycle to cycle variations, generating a pressure signal that has more regular peaks. Also helping to this was the effect of having four cylinders pushing, giving a more even response because when a cylinder presents a significantly different pressure trace, the combustion from the others averages out the effect, since the point when the next combustion occurs is not the moment in the revolution with the lowest rotational acceleration, as compared to the case of a single cylinder engine where the combustion happens always when the acceleration is the lowest (at top dead center).
The effect of inertia in reducing the cycle by cycle differences is also visible in both engines, as the evaluation samples recorded at higher rotational speeds presented better NRMSE values than the lower speed ones, with the data before the reference point. With the data after such point the single cylinder engine behaves the same, but the four cylinder engine does not, it has a slightly higher NRMSE value for the lower speed data, this can be attributed to the differences in combustion and the effect of weight, because even if the mean value of the low speed data is indeed higher than the higher speed, the dispersion of it and its variance reveal that there still is a lot of combustion effect affecting the results.
When comparing the effect of the fuels on the model, it appears to have no effect on the proposed model, all of them provided similar results at all speeds and with all data points.
Lastly it is notable that even though the performance of the method can still be improved, in particular on the section after the vibration peak (lowest NRMSE values) and the cycle by cycle variation is barely noticeable, it can still reconstruct the general shape of the pressure trace, it is on the same scale (magnitude) as the original value and the computational load is very low which gives it value for on line diagnostics and/or control. Further analysis should be performed to account for the effect of load in the engine and to test its capability for fault monitoring.
5. Conclusions
A model to estimate the combustion chamber pressure (around the peaks) based on the analysis and processing of the vibration of the cylinder head, in terms of its acceleration, was proposed. The results show a good performance for the estimation in terms of the magnitude and general shape of the pressure trace, but show difficulties to react to cycle by cycle variations. The proposed model requires a very low computational load and therefore could be useful for on line applications such as control and diagnostics.
The proposed model, once determined, is capable of working using only the vibration signal.
Coherence analysis was used to determine the best place to measure vibrations in relation with the pressure signal.
Two engines were used for testing and evaluation was performed using Normalized Root Mean Square Error (NRMSE), where the best value is 100 %. For the single cylinder engine NRMSE values were 63.52 % and 20.02 % for the points before and after the vibration peak. For the four cylinder engine those values were: 82.47 % and 28.27 % respectively.
References
-
Merkisz J., Waligórski M., Gis W. On-Board Diagnostic of Combustion Process in CI Engines with the Use of Dimensional and Non-Dimensional Vibration Signal Parameters. SAE Technical Paper 2007-01-3545, 2007.
-
Carlucci A., Chiara F., Laforgia D. Block Vibration as a Way of Monitoring the Combustion Evolution in a Direct Injection Diesel Engine. SAE Technical Paper 2006-01-1532, 2006.
-
Ben-Ari J., deBotton G., Itzhaki R., Sher E. Fault Detection in Internal Combustion Engines by the Vibrations Analysis Method. SAE Technical Paper 1999-01-1223, 1999.
-
Barelli L., Bidini G., Vuratti C., Maiani R. Diagnosis of internal combustion engine through vibration and acoustic pressure non-intrusive measurements. Applied Thermal Engineering, Vol. 29, 2009, p. 1707-1713.
-
Arnone L., Boni M., Manelli S., Chiavola O., Conforto S., Recco E. Block Vibration Measurements for Combustion Diagnosis in Multi-Cylinder Common Rail Diesel Engine. SAE Technical Paper 2009-01-0646, 2009.
-
Chandroth G. O., Sharkey A. J. C., Sharkey N. E. Cylinder pressures and vibration in internal combustion engine condition monitoring. Proceedings of Comadem 99, 1999.
-
d’Ambrosio S., Ferrari A., Galleani L. n-cylinder pressure-based direct techniques and time frequency analysis for combustion diagnostics in IC engines. Energy Conversion and Management, Vol. 99, 2015, p. 299-312.
-
Arroyo J., Muñoz M., Moreno F., Bernal N., Monné C. Diagnostic method based on the analysis of the vibration and acoustic emission energy for emergency diesel generators in nuclear plants. Applied Acoustics, Vol. 74, Issue 4, 2013, p. 502-508.
-
Taglialatela F., Lavorgna M., Mancaruso E., Vaglieco B. M. Determination of combustion parameters using engine crankshaft speed. Mechanical Systems and Signal Processing, Vol. 38, Issue 2, 2013, p. 628-633.
-
Charchalis A., Dereszewski M. Processing of instantaneous angular speed signal for detection of a diesel engine failure. Mathematical Problems in Engineering, Vol. 2013, 2013, p. 659243.
-
Jiang R., Yan X. Condition Monitoring of Diesel Engines. Springer Series in Reliability Engineering. 2008.
-
Antoni J., Daniere J., Guillet F. Effective vibration analysis of IC engines using cyclostationarity. Part I: A methodology for condition monitoring. Journal of Sound and Vibration, Vol. 257, Issue 5, 2002, p. 815-837.
-
Gravalos I., Loutridis S., Moshou D., Gialamas T., Kateris D., Tsiropoulos Z., Xyradakis P., Detection of fuel type on a spark ignition engine from engine vibration behavior. Applied Thermal Engineering, Vol. 54, Issue 1, 2013, p. 171-175.
-
Vulli S., Dunne J. F., Potenza R., Richardson D., King P. Time-frequency analysis of single-point engine-block vibration measurements for multiple excitation-event identification. Journal of Sound and Vibration, Vol. 321, Issues 3-5, 2009, p. 1129-1143.
-
Casey E., Smith W., Timoney D. Examination of Low-cost Systems for the Determination of Kinematic Driving Cycles and Engine Operating Conditions in Dublin, Ireland. SAE Technical Paper 2009-01-2791, 2009.
-
Alessandrini A., Filippi F., Orecchini F., Ortenzi F. A new method for collecting vehicle behavior in daily use for energy and environmental analysis. Proceedings of the Institution of Mechanical Engineers, Part D: Journal of Automobile Engineering, Vol. 220, 2006, p. 1527-1537.
-
Duran A., Earleywine M. GPS Data Filtration Method for Drive Cycle Analysis Applications. SAE Technical Paper 2012-01-0743, 2012.
-
Moosavian A., Najafi G., Ghobadian B., Mirsalim M., Mohammad Jafari S., Shargi P. Piston scuffing fault and its identification in an IC engine by vibration analysis. Applied Acoustics, Vol. 102, 2016, p. 40-48.
-
Grajales J. A., López J. F. Quintero H. F. Diagnostic method based on the analysis of vibration and acoustic emissions for internal combustion engines faults. 2014 XIX Symposium on Image, Signal Processing and Artificial Vision, Armenia, 2014, p. 1-5.
-
Benedetto M. F., Berrone S. Scialò S. Efficient combustion parameter prediction and performance optimization for a diesel engine with a low throughput combustion model. Energy Conversion and Management, Vol. 96, 2015, p. 105-114.
-
Sharma A., Sugumaran V., Babu Devasenapati S. Misfire detection in an IC engine using vibration signal and decision tree algorithms. Measurement, Vol. 50, 2014, p. 370-380.
-
Grajales J. A., López J. F. Quintero H. F. Diagnóstico de un motor de gasolina de cuatro cilindros mediante el análisis de vibraciones. Ingeniería Mecánica, Vol. 18, Issue 3, 2015, p. 188-195.
-
Ettefagh M. M., Sadeghi M. H., Pirouzpanah V., Arjmandi Tash H. Knock detection in spark ignition engines by vibration analysis of cylinder block: a parametric modeling approach. Mechanical Systems and Signal Processing, Vol. 22, 2008, p. 1495-1514.
-
Porteiro J., Collazo J., Patiño D., Míguez J. L. Diesel engine condition monitoring using a multi-net neural network system with nonintrusive sensors. Applied Thermal Engineering, Vol. 31, Issues 17-18, 2011, p. 4097-4105.
-
Wu J. D., Liu C H. An expert system for fault diagnosis in internal combustion engines using wavelet packet transform and neural network. Expert Systems with Applications, Vol. 36, 2009, p. 4278-4286.
-
Antoni J., Daniere J., Guillet F. Effective vibration analysis of IC engines using cyclostationarity. Part II: New results on the reconstructions of the cylinder pressures. Journal of Sound and Vibration, Vol. 257, Issue 5, 2002, p. 839-856.
-
Al-Durra A., Canova M., Yurkovich S. A real-time pressure estimation algorithm for closed-loop combustion control. Mechanical Systems and Signal Processing, Vol. 38, 2013, p. 411-427.
Cited by
About this article

The authors acknowledge the support of Colciencias through the Project: Diseño y Desarrollo de un Sistema Prototipo en Línea Para el Diagnóstico de Motores de Combustion Interna, Code 1110-669-46074.
Jairo Grajales, his contribution is on: engine test, signal processing, estimation models. Héctor Quintero, his contribution is on: vibration analysis, estimation models. Carlos Romero, his contribution is on: internal combustion pressure analysis, engine test. Edison Henao, his contribution is on: internal combustion pressure analysis, engine test. Juan López, his contribution is on: signal processing, data acquisition system. Daniela Torres, her contribution is on signal processing.
