Abstract
We compare the mean value of apparent diffusion coefficient (ADC) in a healthy cervix, cancer affected cervix and the cervix after chemoradiation therapy and evaluate the correlation of the value of ADC with the various clinical and histological findings. Prospective clinical study accomplished in Lithuanian University of Health Sciences University Clinical Hospital. Magnetic resonance imaging (MRI) examinations performed on 117 women with and 49 women without cervical cancer by using a 1.5 Tesla scanner. Diffusion–weighted (DW) imaging was performing by using values of 50, 400 and 800 s/mm2. ADC measured in a healthy cervix, cancer affected cervix and the cervix months after chemoradiation therapy. The mean ADC of the patients of the study group – 0.658±0.120×10⁻³ mm2/s was considerably lower than the mean of the control group – 1.169±0.134×10⁻³ mm2/s 24.123, 0.02. There was no correlation between mean ADC and the stage of the disease, the histological type or grade of the tumor. A weak negative correlation was detected between ADC and the age of the subjects (–0,337, 0,000). The mean ADC of responders increased to 1.111±0.138×10⁻³ mm2/s, the mean ADC of non-responders remained lower – 0.733±0.073×10⁻³ mm2/s (9.158, 0.04). The ADC value in the case of cervical cancer is significantly lower than in the non-affected cervical tissue. It increases after effective chemoradiation therapy and becomes closer to the coefficient value of non-affected cervical tissue but remains lower. We cannot credibly consider about the stage of the disease, the histological type and grade of the tumor, according to the ADC value of cervical cancer. Slight decreasing of ADC value closely relate with elderly of patients.
1. Introduction
Worldwide cervical cancer is third among female genital malignancies following the uterine body and ovarian cancers [1, 2]. It is often detect belatedly when effective (including surgical) treatment is no longer available. When assessing the local spread of the tumor, the clinical gynecological examination is not very accurate [2, 3].
Magnetic resonance imaging (MRI) significantly complements the clinical examination and can be an optimal radiodiagnostic method for evaluation of cervical cancer dissemination. This helps accurately select the most appropriate treatment approach – surgery, radiation therapy or chemoradiation therapy. MRI examination methodology is also useful for the assessment of the efficacy of radiation or combined chemoradiation therapy, performance and the determination of tumor recurrence [4-6].
Despite the listed MRI advantages, it has aimed to achieve the maximum examination accuracy in the evaluation of cervical cancer and the residual tumor tissue after chemoradiation therapy [7, 8]. Therefore, the techniques of patient preparation, scanning and image evaluation are sought to be improved [5, 7]. On this way, diffusion weighted magnetic resonance imaging (DW-MRI) as a relatively new investigative technology could expand MRI diagnostic capabilities [9]. The principle of this examination is basing on the diversity of the movement of water molecules in biological tissues, and is characterize by apparent diffusion coefficient (ADC). It was also observed that the signal intensity decreases in proportion to the increase of water molecule diffusion. ADC values are higher in tissues with less limited water molecule motion, as compared to tissues with more limited diffusion [9, 10].
For approximately twenty years, DW-MRI is using exclusively for the analysis and detection of brain diseases [8, 10]. In the recent years, due to the developments in research and technology, it has been possible to adopt DW-MRI for the examination of other anatomical areas: the abdomen and pelvis. The above-mentioned research methodology was employed in the diagnostics of malignant tumors relatively recently [9-11] and there exists a particular interest in the adaptation of DW-MRI for the assessment of the response of tumors to chemoradiation therapy [7, 12].
In the recent years, only a few research papers has been published in the field of cervical cancer diagnostics by using DW-MRI. The main problem is a small number of examined subjects and rather scattered ADC values, representing cervical cancer (Table 1). In our clinical study for DW-MRI we utilized values of 50, 400 and 800 s/mm2. We did not come accross any clinical studies that used the same combination of values for detection of cervical cancer. Therefore, this clinical study has the significant scientific value in optimizing the use of MRI potential in the evaluation of the diagnostics and treatment efficacy of the above-mentioned diseases.
The objective of our study was to compare the mean value of ADC in a healthy cervix, cancer affected cervix and the cervix status after chemoradiation therapy as well as to evaluate the correlation of the value of ADC with the various clinical and histological findings.
2. Material and methods
We performed a prospective clinical study in period from 2008 to 2010 and included patients (Permission of Biomedical Research Ethics Committee No.: BE-2-52).
The study group consisted of 117 patients, for whom cervical cancer was clinically suspected and confirmed by biopsy, before the MRI examination. The mean age of the study group was 51.9±2.7 years, ranging from 21 to 87 years. Most frequent histological tumor type was non-keratinizing squamous cell carcinomas – 55 (47.0 %), keratinizing squamous cell carcinomas – 33 (28.2 %), adenocarcinomas – 21 (18.0 %), and other types of malignant tumors of the cervix – 8 (6.8 %). According to the histological grade, tumor differentiation was good for 18 (15.4 %) patients (G1), moderate - for 74 (63.2 %) (G2), and poor - for 25 (21.4 %) (G3). The stage of the disease based according to the classification of the International Federation of Gynaecology and Obstetrics (FIGO). IB stage was defined – for 16 subjects (13.7 %), IIA – for 18 subjects (15.4 %), IIB – for 49 subjects (41.9 %), IIIA – for 10 subjects (8.5 %), IIIB – for 17 subjects (14.5 %), IVA – for 5 subjects (4.3 %) and IVB – for 2 (1.7 %) subjects.
MRI was performed only once – in the pretreatment evaluation of cervical cancer – for 52 study group patients – 34 of them underwent surgery, 7 - only radiotherapy, 11 did not recall for MRI after chemo-radiotherapy. The remaining 65 patients studied by this method twice: in the pretreatment evaluation of cervical cancer and 6 months after chemoradiation therapy. In 13 (20 %) of patients we founded residual tumor and no cervical tumor was detected in 52 (80 %) women. The residual tumor tissue confirmed by biopsy or surgery. MRI results later compared with the clinical examination data at the time and 1.5 to 2 year after the examination. Patient monitoring median was 704 days (1.95 year).
The control group consisted of 49 patients for whom cervical cancer was not suspected and MRI was performed because of other pelvic diseases. The mean age of the control group was 56.0±4.8 years, ranging from 31 to 88 years. These patients had no cervical pathology. Uterus myomas were diagnosed for 16 patients (32.7 %), ovarian cysts – for 15 patients (30.6 %), ovarian cystadenomas – for 8 patients (16.3 %), pelvic abscesses – for 3 patients (6.1 %), and no pathology – for 7 patients (14.3 %).
Table 1The comparison of mean ADC in the healthy and cancer affected cervix
Author | Year of publication | Number of subjects | ADC (×10–3 mm2/s) | values (mm2/s) | |||
Study group | Control group | Cervical cancer | Normal cervix | ||||
S. Naganawa [13] | 2005 | 12 | 10 | 1.09±0.20 | 1.79±0.24 | 0;300;600 | <0.01 |
V. Zhang [14] | 2007 | 20 | 16 | 0.97±0.13 | 1.71±0.14 | 0;800 | <0.01 |
P. Z. McVeigh [15] | 2008 | 47 | 26 | 1.09±0.20 | 2.09±0.46 | 0;600 | <0.01 |
H. D. Xue [16] | 2008 | 24 | 24 | 0.98±0.17 | 1.73±0.31 | 0;800 | <0.01 |
E. V. Charles-Edwards [17] | 2008 | 18 | 15 | 0.757±0.110 | 1.331±0.159 | 0;300; 500;800 | <0.0001 |
Y. Liu [18] | 2009 | 42 | 15 | 0.88±0.15 | 1.50±0.16 | 0;1000 | 0.0000 |
Y. B. Chen [19] | 2010 | 26 | 30 | 0.98±0.19 | 1.77±0.23 | 0;800 | 0.00 |
J. Chen [20] | 2010 | 33 | 20 | 1.110±0.175 | 1.593±0.151 | 0;800 | <0.001 |
G. S. Payne [21] | 2010 | 62 | – | 1.117±0.183 | 1.724±0.195 | 0;100;300; 500;800 | <0.001 |
S. Rizzo [22] | 2011 | 17 | 17 | 1.06 | 1.45 | 0;50;250; 500;900 | <0.0001 |
MRI examinations were performed by using a 1.5 Tesla MRI scanner “Siemens Magnetom Avanto Syngo MR B 15”, employing pelvic phased–array coils. Patients were lying on their back position, with hands raised above their heads, legs outstretched along hip and knee joints. The examinations carried out by using the pelvic examination protocol (Table 2). The first phase involved a native scan in T1–weighted (T1W)/TIRM, T1W/TSE and T2–weighted (T2W)/TSE sequences. The second stage included a DW/EPI sequence using values of 50, 400 and 800 s/mm2. ADC maps were reconstructed from DW images (Fig. 1). The third phase consisted of T1W/TSE and T1W/SE/FS sequences using intravenous contrast medium. The main component of the agents used for intravenous contrast was gadolinium. Contrast medium was injected into a peripheral (forearm) vein; the precise amount was calculated according to the patient's body weight: 1 ml product / 5 kg body weight or 15 ml / 75 kg.
Two radiologists analyzed MRI on the consensus reading. Conventional MRI and DW-MRI images were taking to detect cervical cancer and later compared with the ADC map. A circle was drowning in the region of interest of cervical area on one of the ADC map images and ADC measured in this circle. The widest possible part of the cervical tumor excluding ulcerations with air and fluid inclusions attempted to be drowning in the study group. Analyzed unaffected area of cervical tissue excluding stroma and mucosa circled in the control group.
The statistical data analysis performed by using the program “SPSS 15.0 for Windows” and “Microsoft Excel 2003”. We used the relative frequency polygon drawn to assess and present graphically distribution of sample values of the study and control groups. Kolmogorov–Smirnov test used to evaluate the distribution of sample values in the smaller groups. The Student criterion used for the comparison of the means ADC values. The dispersive analysis of variance (ANOVA) applied to compare more than two sample means the data of which distributed under the normal law. The Kruskal-Wallis criterion used to compare more than two sample means the data not distributed under the normal law. The Pearson correlation analysis invoked for the assessment of the relationship between the ADC and the patient’s age. The chosen level of statistical significance was 0.05.
Fig. 1Cervical cancer: a) DW–MRI (b value 400 s/mm2) shows hyperintense tumor (white arrow), b) corresponding ADC is low (0.545×10⁻³ mm2/s) (black arrow)
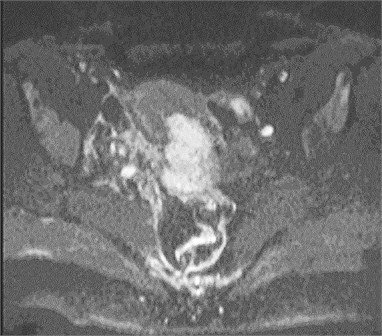
a)
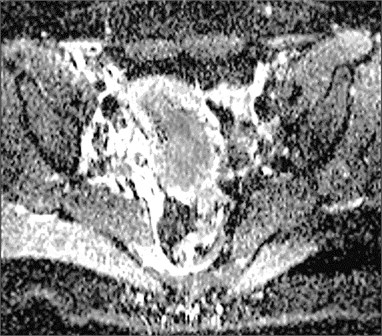
b)
Table 2Cervical cancer MRI examination protocol
Sequence | T1/TIRM | T2/TSE | T1/TSE | T1/SE/FS | D/EPI | |
Plane | Coronal | Sagital | Axial oblique | Sagital | Axial | Axial |
TR (ms) | 3500 | 4100 | 4000 | 470 | 580 | 2200 |
TE (ms) | 22 | 81 | 72 | 11 | 11 | 83 |
NSA | 2 | 3 | 3 | 2 | 2 | 12 |
Flip angle (°) | 150 | 150 | 150 | 150 | 180 | – |
TI (ms) | 160 | – | – | – | – | – |
Slice thickness (mm) | 5 | 4 | 3 | 4 | 4 | 4 |
Gap (mm) | 1,5 | 1,6 | 2,1 | 2,0 | 2,0 | 2,0 |
TF* | 6 | 13 | 14 | 2 | 2 | 144* |
Frequency range (Hz/Px) | 191 | 161 | 161 | 180 | 186 | 1302 |
Matrix | 256×320 | 256×320 | 256×320 | 240×320 | 192×256 | 144×192 |
FOV (mm) | 380 | 230 | 200 | 230 | 222 | 250 |
TR – Repetition time, TE – Echo time, NSA – Number of signal averages, TI – Inversion time, FOV – Field of view, TF – Turbo factor, EPI – Echo planar imaging, TIRM – Turbo inversion recovery with a magnitude display, TSE – Turbo spin echo, SE – Spin echo, FS – Fat saturation. *EPI factor in DW/EPI sequence. | ||||||
3. Results
ADC of cervical tissues was calculated using DW–MRI method for the patients of the study and control groups. According to the relative statistical frequency, polygons of the ADC values was revealed that ADC values in study and control groups are distributed in accordance of normal (Gaussian) law (Fig. 2).
The mean ADC of the patients of the study group (0.658±0.120×10⁻³ mm2/s) was considerably lower than the mean of the control group (1.169±0.134×10⁻³ mm2/s). A statistically significant (substantial) difference was detected between the means of the comparison samples (24.123, 0.02) (Fig. 3).
In order to assess the dependence of ADC on the stage of the disease, the histological type and grade of tumor, the patients of the study group divided into corresponding smaller groups.
The mean ADC calculated according to the FIGO stage: I – 0.672±0.141×10⁻³ mm2/s, II – 0.670±0.107×10⁻³ mm2/s, III – 0.618±0.130×10⁻³ mm2/s, IV – 0.660±0.151×10⁻³ mm2/s. We don’t observed statistically significant difference between the means (1.298, 0.279).
The mean ADC of adenocarcinomas was 0.664±0.145×10⁻³ mm2/s, keratinizing squamous cell carcinomas – 0.668±0.128×10⁻³ mm2/s, non-keratinizing squamous cell carcinomas – 0.645±0.097×10⁻³ mm2/s, malignant tumors of another type – 0.678±0.173×10⁻³ mm2/s. No statistically significant difference was found between the means of the groups (0.0387, 0.763).
Fig. 2The relative frequency polygons of: a) ADC values of control, b) study groups
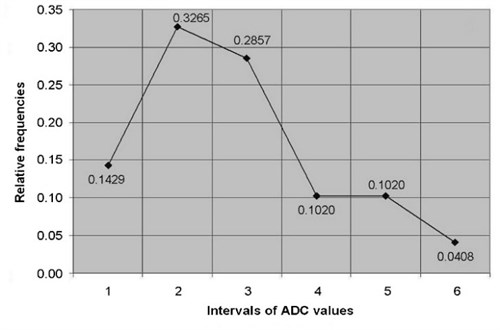
a)
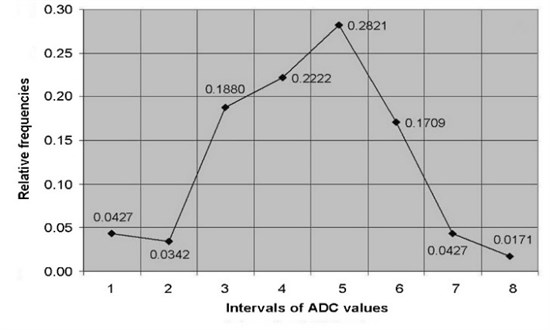
b)
The mean ADC of well-differentiated tumors (G1) was 0.722±0.115×10⁻³ mm2/s, respectively of moderately differentiated (G2) was 0.654±0.107×10⁻³ mm2/s and of poorly differentiated (G3) was 0.618±0.145×10⁻³ mm2/s. The mean ADC in the group of well differentiated tumors was slightly higher, while in the poorly differentiated group it was slightly lower than in other groups, however, the difference proved to be statistically insignificant (5.657, 2, 0.059) (Fig. 4).
A weak negative correlation was detected between ADC and the age of the subjects (–0.337, 0.000; 0.3 0.5).
Fig. 3The comparison of the ADC values in study and control groups (t= 24.123, p= 0.02)
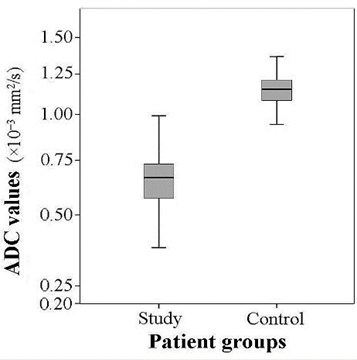
Fig. 4The comparison of the ADC values according to the histological grade (χ2= 5.657, df= 2, p= 0.059)
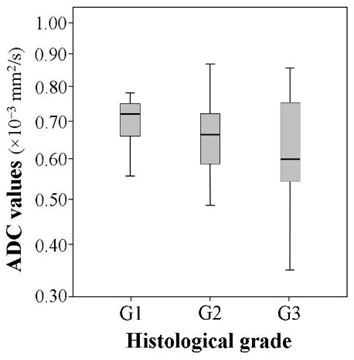
Fig. 5The comparison of the ADC values in the selected groups (t= 2.114, p= 0.03 and t= 11,329, p= 0.04)
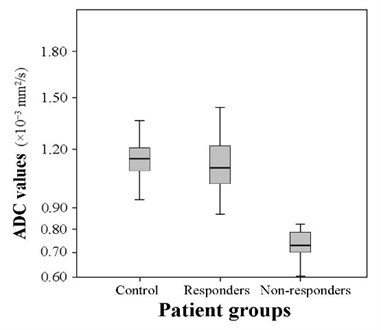
The mean ADC of the patients who responded to combined chemo-radiation therapy increased to 1.111±0.138×10⁻³ mm2/s, and the mean ADC of the patients who did not responded remained lower – 0.733±0.073×10⁻³ mm2/s. The comparison of the means of the groups of responders and non-responders revealed that the difference of the means between the above mentioned groups is substantial (9.158, 0.04). The difference of the mean ADC between the responders before (0.655±0.127×10⁻³ mm2/s) and after (1.111±0.138×10⁻³ mm2/s) combined chemo-radiation therapy was statistically significant (19.214, 0.03). The mean ADC of non-responders after the therapy increased slightly – from 0.658±0.079×10⁻³ mm2/s up to 0.733±0.073×10⁻³ mm2/s as well (3.58, 0.02). The mean ADC of the control group was slightly higher than of the group of responders (2.114, 0.03) and significantly higher than of the group of non-responders (11.329, 0.04) (Fig. 5). The comparison of the mean ADC of responders and non-responders before the treatment showed no significant difference (0.655±0.127×10⁻³ mm2/s) and (0.658±0.079×10⁻³ mm2/s) (0.59, 0.04).
4. Discussion
As mentioned above, there are only few studies where ADC value from DWI-MRI was compare in healthy and cancerous cervix (Table 1) and the first paper published in 2005 by Naganawa et al. [13]. Thoroughly, all previous studies indicate rather different average ADC values, characteristic for healthy and cancerous cervix tissue, but in all cases ADC value of cervical cancer is considerably lower, compared to normal tissue [13-22]. Punawi et al. demonstrated ADC value of cancerous cervix ranges between 0.757±0.110×10⁻³ mm2/s and 1.110±0.175×10⁻³ mm2/s, while in healthy tissue – 1.331±0.159×10⁻³ mm2/s and 2.09±0.46×10⁻³ mm2/s [11].
We observed that ADC value of healthy and cancerous cervix is much lower when described in earlier studies. Moreover, our ADC value of healthy cervix is close to that of cancerous cervix determined by Naganawa, McVeigh, Chen and Payne [13, 15, 20, 21]. The reason for this could be different values. Hoogendam et al. applied different combinations of value (0, 150, 500, 1000 s/mm2) and reported, that ADC value of cancerous cervix ranges 0.85±0.18×10⁻³ mm2/s – 1.15±0.21×10⁻³ and of healthy cervix – 1.42±0.22×10⁻³ mm2/s – 2.08±0.31×10⁻³ mm2/s [23].
We uphold the view and are unique, who applies values of 50, 400 and 800 s/mm2, and thus we can presume that we detected the lowest possible value of ADC of healthy and cancerous cervix. It is obvious from our and other studies that ADC value should be regarding as provisory – it depends upon the technical protocol of MRI investigation ( value). We agree with results, obtained by Naganawa, Zhang, McVeigh, Chen and Rizzo, that after effective chemo-radiotherapy ADC value increases and become close to that of normal cervix [13-15, 20, 22].
There are several reports about ADC values of cancers of other locations. Supposedly, tumors with lower ADC value are more susceptible to chemo-radiotherapy, compared to those with higher ADC value, probably due to necrosis formation in future. It has well known, that necrotic tissues are more hypoxic, acidotic, and thus resistant to chemo-radiotherapy [8-10]. In our study, we did not reveal significant difference between mean ADC values of recovered and not recovered patients. This could be because we avoided inclusion of ulcerations and necrosis into region of interest, thus avoiding inclusion of air and fluid that are present in the cervical channel [13-15]. Rizzo et al. [22] also presented similar results. On another hand, McVeigh et al. detected mean ADC value slightly lower comparing to that of unfavorable outcomes, but they investigated small paucity comparing to our study.
In some studies were tried to determine corellation between mean of ADC value of cancerous cervix and stage, hystological type and grade of the tumour [15, 19, 21, 22]. According to FIGO stage we failed to detect any significant difference.
McVeigh et al. represented a significant correlation between T stage of the tumor and mean of ADC value, but there they used the TNM, but not FIGO classification. Rizzo et al. did not reveal correlation between FIGO stage and ADC values, but they divided the sample only into the two groups: IB1–IIA2 and IIB–IVB [22]. Payne et al. determined significant correlation between tumor grade and mean ADC value – the ADC values of well (G1) and moderately (G2) differentiated tumors were lower comparing to that of poor (G3) differentiated tissues [21]. We observed slightly higher ADC values in G1 group and slightly lower in G3 group, but these findings were not statistically significant. Liu et al. determined significant correlation between tumor grade and mean ADC value – ADC of squamous cell carcinoma was lower comparing with adenocarcinoma [19]. We did not determine any correlations of this kind.
As it appears from literature sources, rift in cervical cancer usually observed in age of 52 years [1-3]. In our study, it was 51.9±2.7 years. We do not found studies, where correlation between ADC value and patients’ age was been searched. According to our data a weak negative correlation – ADC value of cancerous cervix slightly increases with age. The reason for this is not clearly established until now and could be a matter of our further investigations.
5. Conclusions
1. The ADC value in the case of cervical cancer is significantly lower than in the non-affected cervical tissue.
2. The ADC value increases after effective chemoradiation therapy and becomes closer to the coefficient value of non-affected cervical tissue but remains lower.
3. We cannot credibly consider about the stage of the disease, the histological type of the tumor and its grade, according to the ADC value of cervical cancer. However, ADC value slightly decreases when the patients get older.
References
-
Arbyn M., Antoine J., Valerianova Z., Mägi M., Stengrevics A., Smailyte G. et al. Trends in cervical cancer incidence and mortality in Bulgaria, Estonia, Latvia, Lithuania and Romania. Tumori., 2010, Vol. 96, p. 517-523.
-
Schiffman M., Castle P., Jeronimo J., Rodriguez A., Wacholder S. Human papillomavirus and cervical cancer. Lancet., 2007, Vol. 370, No. 9590, p. 890-907.
-
Moore D. H. Cervical cancer. Obstet. Gynecol., 2006, Vol. 107, Issue 5, p. 1152-1161.
-
Kinkel K. Pitfalls in staging uterine neoplasm with imaging: a review. Abdom. Imaging, 2006, Vol. 31, Issue 2, p. 164-173.
-
Balleyguier C., Sala E., Da Cunha T., Bergman A., Brkljacic B., Danza F. et al. Staging of uterine cervical cancer with MRI: guidelines of the European Society of Urogenital Radiology. Eur. Radiol., 2011, Vol. 21, Issue 5, p. 1102-1110.
-
Harry V. N., Deans H., Ramage E., Parkin D. E., Gilbert F. J. Magnetic resonance imaging in gynecological oncology. Int. J. Gynecol. Cancer, 2009, Vol. 19, Issue 2, p. 186-193.
-
Padhani A. R., Khan A. A. Diffusion-weighted (DW) and dynamic contrast-enhanced (DCE) magnetic resonance imaging (MRI) for monitoring anticancer therapy. Targ. Oncol., 2010, Vol. 5, p. 39-52.
-
Whittaker C. S., Coady A., Culver L., Rustin G., Padwick M., Padhani A. R. Diffusion-weighted MR imaging of female pelvic tumors: a pictorial review. Radiographics, 2009, Vol. 29, Issue 3, p. 759-778.
-
Koh D. M., Thoeny H. C. Diffusion-Weighted MR Imaging. Berlin, Springer, 2010.
-
Koh D. M., Collins D. J. Diffusion-weighted MRI in the body: applications and challenges in oncology. AJR Am. J. Roentgenol., 2007, Vol. 188, p. 1622-1635.
-
Punwani S. Diffusion weighted imaging of female pelvic cancers: concepts and clinical applications. Eur. J. Radiol., 2011, Vol. 78, Issue 1, p. 21-29.
-
Thoeny H. C., Ross B. D. Predicting and monitoring cancer treatment response with diffusion-weighted MRI. J. Magn. Reson. Imaging, 2010, Vol. 32, Issue 1, p. 2-16.
-
Naganawa S., Sato C., Kumada H., Ishigaki T., Miura S., Takizawa O. Apparent diffusion coefficient in cervical cancer of the uterus: comparison with the normal uterine cervix. Eur. Radiol., 2005, Vol. 15, p. 71-78.
-
Zhang Y., Liang B. L., Gao L., Ye R. X., Shen J., Zhong J. L. Diffusion weighted imaging features of normal uterine cervix and cervical carcinoma. Ai. Zheng., 2007, Vol. 26, Issue 5, p. 508-512, (in Chinese).
-
McVeigh P. Z., Syed A. M., Milosevic M., Fyles A., Haider M. A. Diffusion-weighted MRI in cervical cancer. Eur. Radiol., 2008, Vol. 18, p. 1058-1064.
-
Xue H. D., Li S., Sun F., Sun H. Y., Jin Z. Y., Yang J. X. et al. Clinical application of body diffusion weighted MR imaging in the diagnosis and preoperative N staging of cervical cancer. Chin. Med. Sci. J., 2008, Vol. 23, Issue 3, p. 133-137.
-
Charles-Edwards E. M., Messiou C., Morgan V. A., De Silva S. S., McWhinney N. A., Katesmark M. et al. Diffusion-weighted imaging in cervical cancer with an endovaginal technique: potential value for improving tumor detection in stage Ia and Ib1 disease. Radiology, 2008, Vol. 249, Issue 2, p. 541-550.
-
Liu Y., Bai R., Sun H., Liu H., Wang D. Diffusion-weighted magnetic resonance imaging of uterine cervical cancer. J. Comput. Assist. Tomogr., 2009, Vol. 33, Issue 6, p. 858-862.
-
Chen Y. B., Hu C. M., Chen G. L., Hu D., Liao J. Staging of uterine cervical carcinoma: whole-body diffusion-weighted magnetic resonance imaging. Abdom. Imaging, 2010.
-
Chen J., Zhang Y., Liang B., Yang Z. The utility of diffusion-weighted MR imaging in cervical cancer. Eur. J. Radiol., 2010, Vol. 74, Issue 3, p. 101-106.
-
Payne G. S., Schmidt M., Morgan V. A., Giles S., Bridges J., Ind T. et al. Evaluation of magnetic resonance diffusion and spectroscopy measurements as predictive biomarkers in stage 1 cervical cancer. Gynecol. Oncol., 2010, Vol. 116, Issue 2, p. 246-252.
-
Rizzo S., Summers P., Raimondi S., Belmonte M., Maniglio M., Landoni F. et al. Diffusion-weighted MR imaging in assessing cervical tumour response to nonsurgical therapy. Radiol. Med., 2011, Vol. 116, Issue 5, p. 766-780.
-
Hoogendam J. P., Klerkx W. M., De Kort G. A., Bipat S., Zweemer R. P., Sie-Go D. M. et al. The influence of the b-value combination on apparent diffusion coefficient based differentiation between malignant and benign tissue in cervical cancer. J. Magn. Reson. Imaging, 2010, Vol. 32, Issue 2, p. 376-382.
-
Harry V. N., Semple S. I., Gilbert F. I., Parkin D. E. Diffusion-weighted magnetic resonance imaging in the early detection of response to chemoradiation in cervical cancer. Gynecol. Oncol., 2008, Vol. 111, p. 213-220.
-
Liu Y., Bai R., Sun H., Liu H., Zhao X., Li Y. Diffusion-weighted imaging in predicting and monitoring the response of uterine cervical cancer to combined chemoradiation. Clin. Radiol., 2009, Vol. 64, Issue 11, p. 1067-1074.
About this article

