Abstract
For the viscoelastic damping material to possess excellent dissipating performance, it is crucial to obtain the dynamic characteristic parameters (DCP) of viscoelastic damping material exactly and effectively, and then to make it as input data for numerical analysis and design in the control of structural vibration. For this sake a new measurement method is presented to acquire the DCP of the viscoelastic damping material effectively in the manuscript. The properties of damping material can be achieved by substituting tested wave numbers or loss factor of composite viscoelastic damping beam (CVDB) into its inversion process of complex bending stiffness. In the present study, the loss factor of beam with unconstrained viscoelastic damping layer is measured by McDaniel and attenuation methods, respectively. And those results are compared with each other to certify the accuracy of test results firstly. Then influences of test conditions on loss factors derived from McDaniel method are studied to give some advices in the measurement. Finally the DCP of the viscoelastic damping material are obtained by the new method with complex wave number and compared with those obtained by using the resonance beam method. From the comparison it is concluded that the present proposed new approach can use limited samples to measure the DCP of the viscoelastic damping material in a wide range of frequencies effectively and conveniently.
1. Introduction
The harmful vibration of machine can decrease the work life of instrument attached to it or located in its near range. While damping technique is a useful approach to reduce the harmful vibration in engineering structures. In real situations these viscoelastic damping materials are applied in the form of composite or isolation coverings to dampen structural vibrations in the mid and high frequency range [1-3], because the viscoelastic damping materials can transfer the vibratory energy to the heat energy and dissipate it.
To analyze the effect of viscoelastic damping material on attenuation of the structural vibration energy, lots of attentions were paid on the study of vibration suppression of beams, plates and shells like structures with constrained damping layer [4-7], and other researchers focused on study of optimizing distribution of damping treatment [8-9]. In the above mentioned studies, the DCP of viscoelastic damping material are used as input data in numerical simulation of vibratory behaviour of composite structure. To narrow the difference between the numerical model and real structure, the DCP of viscoelastic damping material in analysis should be selected using the experimental data. So the accuracy of measurement directly influences the calculation results derived from numerical model. Therefore the approach for testing the DCP of viscoelastic damping material becomes a significant subject to be studied.
Different methods [10-15] are published to evaluate the DCP of viscoelastic damping materials, which can be classified into three broad families: vibratory, ultrasonic and wave attenuation methods [10]. Vibratory methods include measurement of the resonance characteristics of beam-like structure (resonance beam method [11]) and test of the dynamic rigidity of a cylindrical material sample [12]. They measure material properties by analyzing the vibration characteristics in structures. Ultrasonic method [13] acquires the parameters of viscoelastic material by testing the resonance of small sample block in ultrasonic frequency range. Attenuation method [14-15] tests the Young’s modulus and loss factor of viscoelastic material by studying the performances of viscoelastic structure decay with time or length of the beam. Although the accuracy of test method is validated in above researches, valuable results derived from each sample are limited. If the measuring frequency range is broader or the number of useful values in scale of analyzing frequency needs to be larger, the samples used in the test will become of a tremendous quantity and require great measurement efforts. To avoid this problem, a new approach to measure the DCP of viscoelastic damping material with small sample in a wide frequency range is proposed in the paper.
In this paper a new method, which mainly combines the McDaniel method [16-18] and the function of complex bending stiffness of composite visco-elastic damping of a beam (CVDB), is presented to measure DCP of viscoelastic damping material with limited sample in a wide frequency range. Since the results of the method are derived form complex wave number of the structure, it falls into the wave number method category. In the analysis section the particle swarm optimization method is introduced to reduce the cost of time in matching process of the wave number. To certify the new approach wholly, the loss factor of CVDB is measured and compared with the results of attenuation method firstly. And then the effects of test conditions on the results obtained from wave number method are discussed. Finally the DCP of viscoelastic damping material are calculated by the inversion analysis of complex bending stiffness of composite beam and are compared with the test results obtained by the resonance beam method.
2. Theory
In this section the basic theory for measuring DCP of viscoelastic material is demonstrated. It is mainly composed of the McDaniel method and the inversion process of the function of composite beam. In the wave number’s estimation of McDaniel method, the improved particle swarm optimization method is carried out to accelerate the searching process.
2.1. Fitting method for structural damping
From the method of McDaniel, the Fourier transform equation [16] of the vibration of the free damping of the beam can be written as follows:
where , , indicate the beam’s Young modulus, loss factor and density respectively, and represents the beam’s cross-section moment of inertia, indicates the cross sectional area of the beam, indicates the excitation frequency.
The response [16] can be written as:
where , , and indicate the coefficients of the displacement’s response, respectively. The complex wave number can be expressed as:
The sizes of test samples of the CVDB in this paper are small, which is different from those referred in the literature [17]. For this small size the noise generated by the driving source and the boundary reflection can be easily introduced into the measurement results of the displacement response of the transducer. Hence greater error may be introduced into the result, if the response of the displacement is continued to be used as input quantity. In order to reduce the error mentioned above, the noise generated by driving/pick up point must be reduced. While the estimated frequency response function based H3 can effectively suppress the noise of the measuring point and driving points, and this just meets the need of error suppression. Accordingly, Eq. (1) can be transformed as follows:
It can be written in the form of matrix:
where represents the th position of the measuring point, the is the response of the displacement’s transfer function from to . While are the unknown coefficients.
Because of the fact that the wave number of the CVDB is acquired by means of fitting optimization of points’ measured data, the transfer functions at a frequency should be measured firstly. Then we can calculate the error between the estimated result and the measurement result through Eq. (6):
where indicates the transfer function which needs to be tested at each measurement point, indicates the transfer function of the which is estimated by the supposed complex wave number. indicates the correlation coefficient of the response of the displacement and incentive force.
At last the minimum optimized value of the can be obtained through the swarm intelligence optimization method. Corresponding to the minimum value is the complex wave number. The loss factor can be written as Eq. (7):
2.2. Inversion method for DCP of viscoelastic damping material
From the reference [19] it is revealed that a relationship exists between the parameters of the damping material and the loss factor of VDB or the complex wave number. Hence the inversion formula of the viscoelastic damping material can be deduced by the Eq. (8), which is the complex stiffness of the free damping of a beam [19]. Then the loss factor and the Young’s modulus of the viscoelastic damping material can be obtained from the results of the McDaniel method:
where , , , , and indicate the Young’s modulus, thickness and loss factor of the viscoelastic damping layer, respectively. , indicate the Young’s modulus and thickness of the base layer.
According to the value of which is estimated by the experiment, the complex stiffness of the CVDB can be derived through inversion of Eq. (3), and the complex stiffness of the CVDB can be written as follows:
Substituting Eq. (9) into Eq. (8), after rearrangements it can be written as:
Let , , , , then the Eq. (10) can be transformed as:
The solution of the Eq. (11) is:
For the can’t be a negatyve value, so is:
Then the Young’s modulus and loss factor of the damping material can be obtained:
2.3. Optimization method
Since the relation between estimating function and wave number is implicit in the expression, the classic optimization method is not suitable to simulate wave number from the iterations process. To settle the mentioned problem the particle swarm method is used to obtain the wave number. While initialization of the search process of particle swarm optimization algorithm is random and thus can guarantee that most of the initial solution group is distributed evenly. But if we have a better initial solution, the efficiency and quality of solution will be improved greatly, so the chaotic method is introduced to the particle swarm optimization.
(1) Chaos initialization. According to a typical chaotic system, each component values in the -dimensional vector are between 0 and 1, they are generated by Logistic Mapping iterative formula shown as:
From Eq. (15) are obtained, the range of variables applied in optimization can be described as follows:
where , are upper and lower limits of the sth variable.
All the variables are substituted into Eq. (6) to calculate the objective function. From the results of calculation, which are performed best in the objective function, are chosen from above as the initial location and initial velocity vectors , which are generated randomly.
(2) Assign values of to the optimal position of the individual particles and then substitute them into the objective function to calculate the individual particle extreme value . Also the global extreme value and its corresponding location are obtained from the particle extreme value and position.
(3) Each location and velocity of a particle is updated as follows:
In Eqs. (17)-(18) denotes the particle, represents the iteration number, is the velocity (or pseudo-velocity) of the particle and is the position of the particle. and represent the regions of the search space where the objective function attains optimum values. is the best position found by the particle itself, while is the best position found by the whole swarm. and are two random numbers with uniform distribution in the range [0, 1]. , and are search parameters. are the limits of the particle velocity.
(4) Substituting the renewed location into the objective function calculation, the result is obtained, if , and will be assigned to and respectively and updated location and extreme values of individual particles, otherwise that of individual particles will not be updated.
(5) The global extreme value is found out by extreme individual particles and its corresponding location is obtained at the same time.
(6) In the iterations of optimizing, then repeat the steps (3) – (5).
3. Experimental study
For the DCP of viscoelastic damping material they are acquired from the wave number or structural loss factor by using McDaniel method, the structural loss factors are measured firstly in the stable system of McDaniel method and their accuracy is certified by comparing with those obtained from the attenuation method. Then the influences of test conditions on measured data, like weight of the sensor and boundary conditions, are discussed. Further more, the DCP of viscoelastic damping material are derived from the proposed new method and contrasted with those from resonance beam method to prove the method valuable.
3.1. Test system
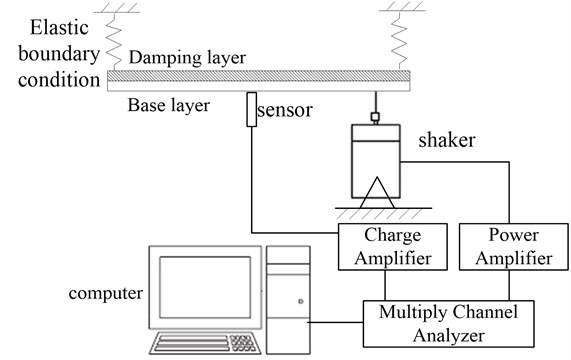
The test system depicted in Fig. 1 is a steady testing system. The test system consists of two parts: the steady-state excitation subsystem and the data acquisition and analysis subsystem. The steady-state excitation subsystem consists of the shaker (JZ shaker), power amplifier (B&K2716C). The other part consists of vibration accelerator (PCB 256B08), impedance head (B&K8001), charge amplifier (B&K2692) and multi-channel analyzer (B&K3560B). The sensor with the mass of only 3 g can minimize the impact of changes caused by the quality of vibration accelerator.
Fig. 1Schematic view of the steady-state testing system
In the process of measuring the wave number, the basic wave shape can be restructured with at least 6 measured points, then the measured points need more than 6 times the number of transmitted wave number in the structure. However the number of wave number is relevant to frequency, the frequency range should be set before beginning of the test. Substituting the measured upper limit frequency into the Eq. (19), the minimum wavelength of the base steel beam can be estimated:
where represents wavelength, represents the thickness of the viscoelastic damping layer, represents the Young’ modulus of the base layer, represents the density of the base layer.
The DCP of the viscoelastic damping layer is unknown. At this time the wavelength of the CVDB can be substituted by the wavelength of the base layer of the steel. Then according to the size of the beam, the measured points can be estimated when the wave number of the structure is multiplied by six. Moreover, the following basic conditions should be satisfied:
(1) measured points should be equally spaced on the target structure, and also try to stay far from the boundary of the CVDB, which aims to reduce the impact of the boundary reflection on the test results,
(2) signal-to-noise ratio is greater than 10 dB,
(3) in order to eliminate the random errors of test, each measured point should be tested and averaged at least 256 times,
(4) shaker should be connected to the free end of the beam.
3.2. Measurement results of structural damping
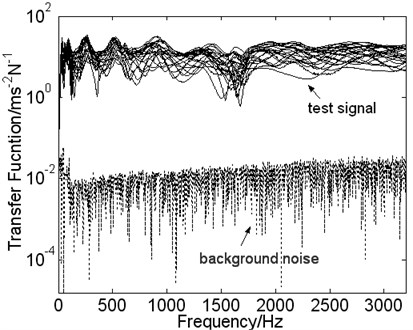
The test sample is described as follows: the length of the free damping beam is 0.3 m, the width is 0.02 m, the base layer is steel and its thickness is 0.002 m, the thickness of the damping layer is equal to that of the base layer. According to the points uniformly spaced in the beam, 23 measured points from 0.04 m to 0.26 m are arranged with the same distance between each other. The free damping beam is hung by two elastic ropes, and a white noise with the frequency band of 50-4000 Hz is generated by the multi-channel analyzer. Then the signal is transferred through the power amplifier to drive the shaker to excite the endpoint of the beam. The force signal is picked up at the exciting point of the beam by the impedance head, the displacement response signal of the beam is picked up at the measured point by a vibration accelerator. Those two signals are collected into the multi-channel analyzer through the charge amplifier, thereby the frequency response function is obtained.
In the Fig. 2 the comparison between the test signals of the 23 measured points and the background noise is done. It shows that the signal-to-noise ratio is greater than 10 dB, which satisfies the test requirement.
Fig. 2The signal-to-noise ratio of transfer function
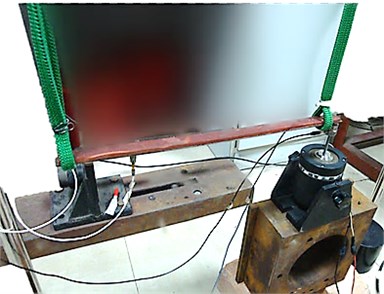
In order to check the correlation between the measured data and the excitation, the correlation coefficient, which represents the input force from the impedance head and the acceleration of the 23 measured points, is shown as Fig. 3. In the analytical frequency range the correlation coefficient is greater than 0.8 mostly and there is only one lowest point at 1.6 kHz. Combined with Fig. 4, the reason of low correlation may be checked as the coupling vibration between the elastic rope with rigid frame. To solve this problem, CVDB can be hanged in the greater rigidity of the frame, which makes the interference frequency beyond the test frequency range.
Once the vibration data at the measured points and the correlation coefficient of the excitation points have been obtained, the wave number of each frequency can be derived from Eq. (5) and Eq. (6) by combing swarm particle optimal fitting method. And the loss factor measured by McDaniel method was calculated with the wave number of the structure. For the steady performance of the measured result of the loss factor, it will be influenced by the convergence property of the wave number, thus the degree of convergence in the process of wave number fitting should be analyzed. Then the estimation error of the fitting process of wave number varied with the number of iterations and is plotted in Fig. 5. It indicates that the basic objective function is achieving convergence after 50-steps of iteration. Therefore the swarm particle optimization method is a usable tool to estimate the wave number with high convergence speed and efficiency.
Fig. 3Correlation coefficient of the input force and acceleration value of each measured point
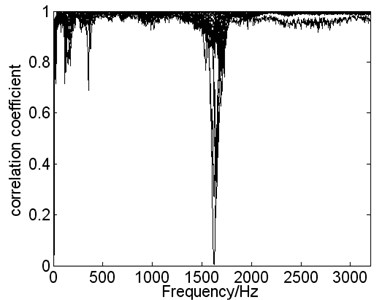
Fig. 4Schematic view of the experimental measurements configuration
In reference [17] the lower frequency limit of wave numbers acts as the first order modal frequency of the beam, the measured points in the beam can only fit half bent waveform, which will affect the precision of test results. In order to increase their precision, a complete waveform will be restructured by the measured points in the process of fitting. So the lower limit of frequency needs to raise to the second modal frequency of the beam.
For the complete waveform can be restored by using at least six points [17], 23 measured points can only describe up to three and a half bending waves. Therefore the upper limit of the analysis frequency is the seventh modal frequency of the beam. In the measurement the second-order modal frequency of the CVDB measured experimentally is 289 Hz and the seventh-order modal frequency is 3430 Hz. For ensuring the accuracy of the data and setting an upper limit of frequency slightly lower than the seventh-order modal frequency, the frequency range is arranged from 289 Hz to 3200 Hz. The curve about loss factor, which is calculated through Eq. (7), varied with the frequency and is plotted in Fig. 6. In order to verify the correctness of the measured method, the loss factor obtained by the attenuation method [14] is also plotted in Figure 6.
As seen from Figure 6, results of the attenuation method for measured results seem to be less volatile. The value decreases with frequency increasing and also it located the center of the floating region of measured results obtained by the McDaniel method. Because the loss factor obtained by the attenuation measurement is the average value of loss factor within a band and the results of the McDaniel method are corresponding to each frequency, the results of McDaniel method should float around the average results obtained by the attenuation method and the trends are basically the same. From the above analysis it is clear that the loss factors of the two methods are in agreement with each other. As a conclusion, correctness and effectiveness of the McDaniel method are verified.
Fig. 5The curve of fitting error changes with the number of iterations
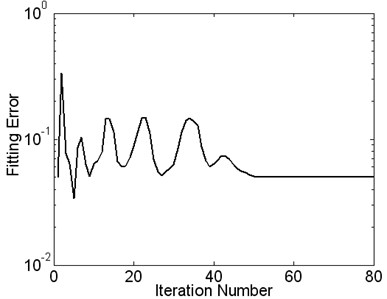
Fig. 6The comparison of loss factor obtained by two different methods
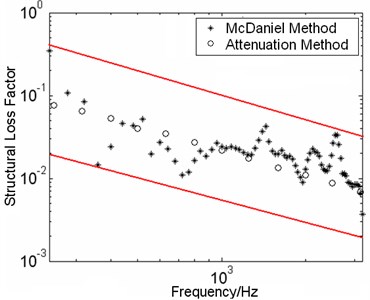
Fig. 7The influence of the vibration sensor’s mass on the measured result of loss factor
3.3. Influence of test conditions on the results
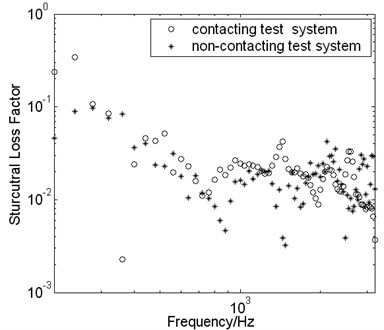
In this section the influence of the test conditions, including the mass of transducer and boundary reflection, on the results is studied. Firstly the influence of the weight of the accelerator on the measured result of loss factor is carried out. Hence two transducers are used in the measurement. One is contact sensor with 3 g weight, the other is non-contact sensor. Then the results derived from test systems by using these two sensors are compared and plotted in Fig. 7. It is seen that the loss factor obtained by non-contacting vibration transducer is in good agreement with the contacting vibration transducer’s value. In order to elaborate the influence relations of the transducer’s mass and beam’s mass on the result, the mass of the transducer and beam are weighed, respectively. The PCB transducer’s mass is 3 g, and the beam’s mass is 121.1 g. So the sensor mass is equal to about 3 % of the structural quality. At this situation the influence of the transducer’s mass on the result can be ignored analogously in the McDaniel method.
For the loss factor obtained through calculating the wave number of the structure, the reflection wave will yield discrepancy in the measured results under different boundary conditions. However the boundary can reflect waves in measurement, thus the influence of the boundary reflection on the wave number should not be ignored and needs to be studied in the McDaniel method.
With the aim to study the influence of the boundary conditions on the measured results in the McDaniel method, the comparison of structural loss factor is done under two different conditions (one condition is Free-Free, called CD1, the other is Clamped-Free, called CD2), and the contrast curve is plotted in Fig. 8.
Fig. 8The influence of different conditions on the loss factor
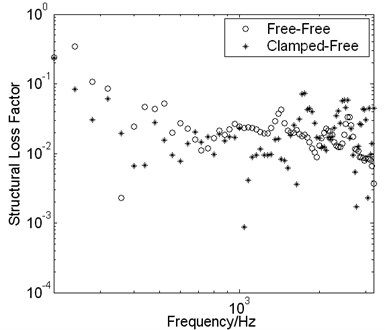
In Fig. 8 the results show that unconstrained damping beams under the CD2 condition have a greater value in the high frequency and a wider range of fluctuations in the data. It is easy to find that the boundary conditions are mostly responsible for the change of the measured results. In the test the fixed boundary of the beam is carried out by clamping. This will bring more boundary damping than free boundary conditions and the loss factor will be greater under the CD2 condition accordingly. Furthermore, when the boundary condition from free changes to fixed, a reflected wave becomes stronger and the stability of the test results is worse. Hence, for one end fixed and one end free, stability of measurement results will become higher and more volatile.
3.4. New proposed test method: wave number method
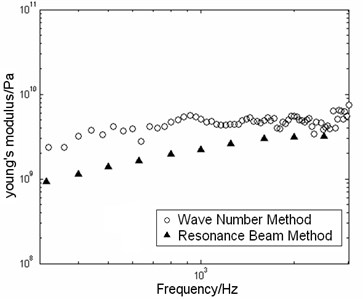
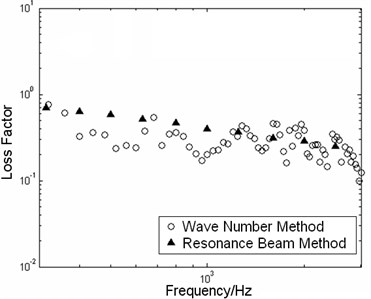
In section 3.2 a new test method (called as wave number method) about measuring the DCP of the CVDB is proposed. The DCP of the CVDB are obtained by the inversion of wave number measured through McDaniel method. In the test the composite structure is the same as in section 3.2. Young's modulus of the viscoelastic material and the loss factor are measured by wave number and the resonant beam method, respectively, and the corresponding compared curves are plotted in Fig. 9.
In Fig. 9 the good agreement about the measured results of the two different methods is verified, and the trend of the results measured by the wave number method coincides with that of the resonance beam method.
Although the measurement results of the two methods are very close in Fig. 9, the numbers of test pieces used in the two measurements are wholly different. For example these frequency values in Fig. 9 can be obtained by the wave number method, which only needs one CVDB. However, if we want to get the same frequency values used by resonant beam method [11], 3 to 4 CVDB are needed, which is decided by the testing standards of the resonant beam method. Through the above discussion it is concluded that the wave number method can measure the DCP of viscoelastic material in a wide frequency range with few samples.
Fig. 9The measured DCP are compared with two different methods
a) Young’s modulus
b) Loss factor
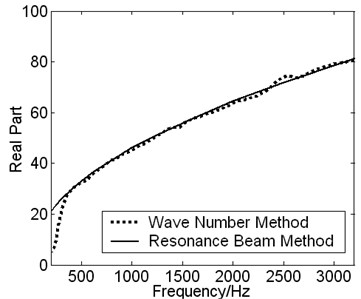
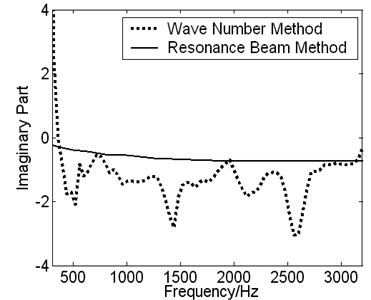
In order to analyze the difference of DCP of viscoelastic material measured by the wave number method and the resonant beam method, respectively, the contrast results are shown in Fig. 10.
Good agreement is shown in the real part of the structure’s wave number by the two different methods in Fig. 10. However there exists a larger perturbation in the imaginary part of the structure’s wave number by the method of wave number.
Fig. 10The measured DCP are compared with two different methods
a) Real part
b) Imaginary part
Form the section 2 it is seen that DCP of damping material are acquired from raw data in measurement by using the fitting and inversion process. Accordingly measurement errors of the imaginary part of the wave number can be passed to the material’s Young’s modulus and loss factor through those processes. It can bring errors and lead to fluctuations in the measured results, which is also the reason of the perturbation in the results of Fig. 8 and Fig. 9. Hence errors of DCP are composed of errors in measurement, fitting and inversion processes. To improve the precision of the results, decreasing of the error in transfer function’s measurement and the improvement of precision in optimization are in research process and should receive equal attentions.
4. Conclusions
A new method called wave number method for measuring parameters of VSDB is introduced in this work. This new test technique is based on the complex wave number for a particular frequency by matching the experimental response to the analytical response and calculating DCP of the CVDB by using inversion process of composite beam function. In the process of estimating wave number, the developed particle swarm optimization method is used to obtain the values of wave number more conveniently. After the test system is built up, the structural loss factor is measured and compared with those obtained from attenuation method to prove the accuracy of the McDaniel method for measuring the structural loss factor. Then the effects of test conditions on the results derived from McDaniel method are analyzed. It is easy to conclude that the clamped boundary condition can increase the values and fluctuation amplitude of the test results. Finally the DCP of CVDB are derived by the wave number method with structural loss factor and certified by comparing result of this new proposed method and the resonance beam method. Through the above study it is revealed that the wave number method can measure accurately the DCP of CVDB with few test specimen in a wide frequency range, which also means that the wave number method can obtain more valuable results with less cost in the test sample and times. In further study of the method we should focus on the improvement of precision in transfer function’s test and optimization’s researching process to get accuracy of the results from the wave number method.
References
-
Ahmed Maher, Fawkia Ramadan, Mohamed Ferra Modeling of vibration damping in composite structures. Composite Structures, Vol. 46, 1999, p. 163-170.
-
Zhiwei Xua, Michael Yu Wang, Tianning Chen Particle damping for passive vibration suppression: numerical modelling and experimental investigation. Journal of Sound and Vibration, Vol. 279, 2005, p. 1097-1120.
-
Xin Jin Dai, Jia Hao Lin, Hao Ran Chen, F. W. Williams Random vibration of composite structures with an attached frequency-dependent damping layer. Composites: Part B, Vol. 39, 2008, p. 405-413.
-
Fernando Cortés, María Jesús Elejabarrieta Structural vibration of flexural beams with thick unconstrained layer damping. International Journal of Solids and Structures, Vol. 45, 2008, p. 5805-5813.
-
Horng Jou Wang, Lien Wen Chen Vibration and damping analysis of annular plates with constrained damping layer treatments. Journal of Sound and Vibration, Vol. 264, 2003, p. 893-910.
-
Werner Hufenbach, Carsten Holste, Lothar Kroll Vibration and damping behaviour of multi-layered composite cylindrical shells. Composite Structures, Vol. 58, 2002, p. 165-174.
-
Lin Hung Chen, Shyh Chin Huang Vibration attenuation of a cylindrical shell with constrained layer damping strips treatment. Composite Structures, Vol. 79, 2001, p. 1355-1362.
-
H. Zheng, G. S. H. Pau, Y. Y. Wang A comparative study on optimization of constrained layer damping treatment for structural vibration control. Thin-Walled Structures, Vol.-44, 2006, p. 886-896.
-
H. Zhenga, C. Cai, G. S. H. Pau, G. R. Liu Minimizing vibration response of cylindrical shells through layout optimization of passive constrained layer. Journal of Sound and Vibration, Vol. 279, 2005, p. 739-756.
-
P. Lemerle Measurement of the viscoelastic properties of damping materials: adaptation of the wave propagation method to test samples of short length. Journal of Sound and Vibration, Vol. 250(2), 2002, p. 181-196.
-
ASTM_E756-83 Standard Test Method for Measuring Vibration-Damping Properties of Materials.
-
Jean C. Piquette Determination of the complex dynamic bulk modulus of elastomers by inverse scattering. Journal of Acoustic Society of America, Vol. 77(5), 1985, p. 1665-1673.
-
T. Lee, R. S. Lakes, A. Lal Resonant ultrasound spectroscopy for measurement of mechanical damping: comparison with broadband viscoelastic spectroscopy. Review of Scientific Instruments, Vol. 71(7), 2000, p. 2855-2861.
-
Filipe Magalhaes, Alvaro Cunha, Elsa Caetano, Rune Brincker Damping estimation using free decays and ambient vibration tests. Mechanical Systems and Signal Processing, Vol. 24, 2010, p. 1274-1290.
-
Y. Sogabe, K. Kishida, K. Nakagawa Wave propagation analysis for determining the dynamic properties of high damping alloys. Bulletin of JSME, Vol. 201(25), 1982, p. 321-327.
-
J. G. McDaniel, P. Dupont A wave approach to estimating frequency-dependent damping under transient loading. Journal of Sound and Vibration, Vol. 231(2), 2000, p. 433-449.
-
J. G. McDaniel, W. S. Shepard Jr. Estimation of structural wave numbers from spatially sparse response measurements. Journal of Acoustic Society of America, Vol. 108(4), 2000, p. 1674-1682.
-
Vikrant Palana, W. Steve Shepard Jr., J. Gregory McDaniel Characterization of an experimental wavenumber fitting method for loss factor estimation using a viscoelastically damped structure. Journal of Sound and Vibration, Vol. 291, 2006, p. 1170-1185.
-
Xiao Heye, Sheng Meiping, Lei Ye A new type dynamic vibration absorber to reduce broad-band vibration in plates. Advanced Materials Research, Manufacturing Processes and Systems, Vol. 148-149, 2011, p. 485-497.
About this article

This research is financially supported by the NPU Foundation for Fundamental Research, Ministry of Education Fund for Doctoral Students Newcomer Awards of China.
