Abstract
Traditional structural health monitoring (SHM) techniques are vulnerable to factors such as temperature change and vibration noise that are not relevant to structural damages. To overcome these drawbacks, this paper develops a reference-free crack detection method based on Lamb wave mode conversion. Neither baseline data nor damage threshold is required in this method. According to PZT polarization characteristics, feature signals which contained crack-lead Lamb wave converted modes are obtained from PZT components of two sets of side-by-side, and their amplitudes are obtained in the frequency domain to represent signal energy. Whether there being a crack is judged by comparing energy of each feature signal. Simulation and experiments show that the proposed method is not sensitive to optimal excitation frequency and sampling time, therefore it has strong robustness and applicability.
1. Introduction
It has important practical significance to detect cracks in aircraft structures using structural health monitoring (SHM) system [1]. SHM based on Lamb wave can realize active damage detection at a long distance in large area [2]. Generally, if Lamb wave meet a crack when propagating in the plate-like structure, mode conversion will occur. Willberg [3] pointed out that this phenomenon could be used for crack detection.
Traditional damage detection techniques are mostly committed to measuring changes of baseline data and relate these changes to structural damages. However, significant damages appear in structures long after baseline-data have been got. Traditional techniques are vulnerable to factors such as temperature change and vibration noise that are not relevant to structural damages. That will impact the accuracy of SHM [4]. To overcome these drawbacks, some reference-free damage detection schemes have been raised. Reference-free scheme judges the existence of damages using real-time responses without any baseline-data. Wang and Yuan [5] proposed a reference-free Lamb wave damage detection method based on time reversal theory. This method requires that the obtained signals are time-reversal-transformed in computers before they are input to the structure again for damage detection. The operation processing is too complex to realize real-time online monitoring. Bagheri [6] proposed a reference-free Lamb wave damage detection method based on wavelet transform and empirical mode decomposition. This method has been demonstrated sufficiently using finite element simulation. However it is difficult in practice to realize its requirement that energy of Lamb waves which are excited by PZT sensors is totally the same.
This paper develops a reference-free crack detection method based on Lamb wave mode conversion. The proposed method utilized piezoelectric sensors to excite and measure Lamb waves. And then feature signals that contain crack-lead Lamb wave converted modes are extractted and classified. The relationship between Damage Index () and the existence of cracks is set up on the basis of energy of feature signals. Simulation and experiments show that the proposed method in this paper could realize crack detection effectively.
2. Lamb wave mode extraction
It is considered that Lamb waves which are excited at a certain driving frequency in plates with a certain thickness contain only basic modes of symmetric () and antisymmetric () type [7]. When Lamb wave meets a crack during its propagation, generally, the mode will convert out a new mode (marked as ), and the mode will convert out a new mode (marked as ). PZT sensors under mutative stress will produce mutative voltage. On the contrary, applying a voltage to a PZT sensor will enable its deformation [8]. As it has excellent piezoelectric characteristic, PZT sensor is often used for exciting and measuring Lamb waves in SHM [9]. Relative phase of the Lamb wave modes varies with the polarization direction and the location of PZT sensors, as well as the symmetry of Lamb wave modes [10].
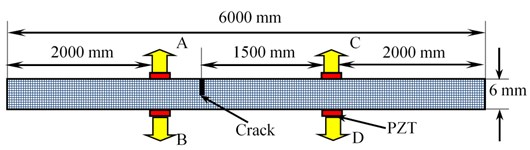
In this paper, Abaqus 6.10 software was used for simulating crack-lead Lamb wave mode conversion. As shown in Figure 1, a two-dimensional model of aluminum plate was set up. The material properties of the aluminum plate were as follows: 70 GPa, 0.3, 2.78×10³ kg/m³. Four piezoelectric sensors (PZT APC 850 [11]) with their positive direction off-board were symmetrically arranged in the upper and lower surface of the plate. The size of PZT sensors was 10 mm×0.5 mm. Sensor A and sensor B formed the excited end. Sensor C and sensor D formed the measuring end. The plate was meshed into 36,000 plane strain elements with the size of 1 mm×1 mm, and each PZT sensor was meshed into 20 piezoelectric elements with the size of 0.5 mm×0.5 mm. A crack with the size of 3 mm×1 mm which was closer to the excited end was simulated by deleting three elements from the upper surface of the plate.
Fig. 1Schematic diagram of finite element simulation model
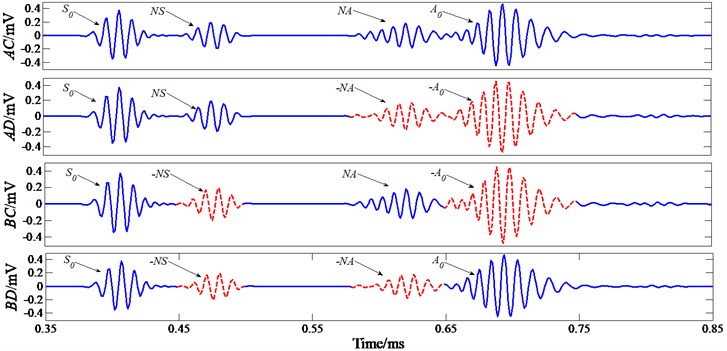
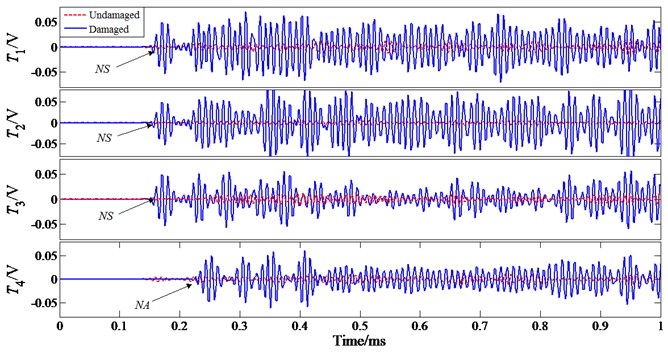
In the simulation, a five-peak narrowband wave with the center frequency of 120 kHz and the amplitude of 1 V was selected as the input signal to excite Lamb waves in the plate. The interval of the sampling time was 0.1 μs, and the response waveform is shown in Figure 2. Time-of-flights (ToF) of those four wave modes in each response signal are as follows: 0.39 ms, 0.46 ms, 0.6 ms and 0.67 ms. It is known by theoretical calculation [12] that when Lamb wave propagated in a 6 mm thick aluminum plate at a driving frequency of 120 kHz, the group velocities of mode and mode are 5194 m/s and 3004 m/s respectively. Combining these results with the size of model and the crack location, it can be judged that these four wave modes are , , and successively. Lamb wave modes represented by the solid and dotted lines in Figure 2 are out of phase. Comparing the relative phase between two basic modes and between two converted modes, it is shown that when excitation and measuring components are located in the same side of the plate, and modes as well as and modes are in phase. On the contrary, when they are located in the different side, not only and modes, but also and modes are out of phase. The relative phase between the basic modes and their converted modes ( and , and ) is affected by crack symmetry. In signal whose monitoring path (upper surface) is closer to the crack, the basic modes and their converted modes are in phase. However, in signal whose monitoring path (lower surface) is farther to the crack, the basic modes and their converted modes are out of phase.
According to the relative phase of each mode, the compositions of response signals can be represented by the formula (1):
Fig. 2Response signals of simulation at a driving frequency of 120 kHz
Further, the way of extracting each Lamb wave mode in time domain can be obtained by the formula (2):
To make sure of extracting Lamb wave mode information by formula (2) completely accurately, it is required that not only PZT components and their positions but also the bonding conditions of them are identical. However, these requirements cannot be completely satisfied in practice. Additionally, modes overlap caused by Lamb wave multiple reflections will also increase the difficulty of extracting single Lamb wave mode. Not only that, when environmental noise becomes serious, information contained in response signals will be more complicated, it will be more challenging to extract individual Lamb wave mode accurately in the time domain.
3. Crack detection based on energy of feature signals
In order to overcome the difficulties of Lamb wave mode extraction in the time domain, this paper develops a reference-free crack detection method based on energy of feature signals. This method combines time-domain feature extraction techniques and frequency-domain signal processing techniques together. First, feature signals (rather than single Lamb wave mode) relevant to the damage are extracted and classified in the time domain. And then the amplitudes of each class of feature signals are obtained in the frequency domain to represent signal energy which will be used for judging the existence of crack. The method of extracting feature signals can be obtained by analyzing formula (2), as shown in formulas (3) and (4):
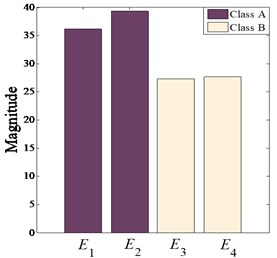
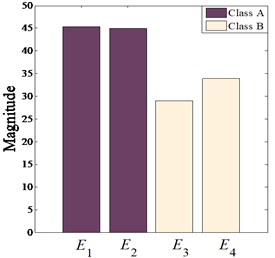
Feature signals and are extracted by formula (3), as shown in Figure 3, and by formula (4) and are separated into feature signals and , as shown in Figure 4(a). Feature signals are normalized in order that the converted modes in different signals have the same amplitude. These four feature signals are divided into two classes. Class A as and contain two converted modes both. Class B as and contain one converted mode only. Energy of feature signals is represented by the amplitudes of them in the frequency domain, as shown in Figure 4(b). Under ideal case, signal energy in Class A ( or ) is twice the signal energy in Class B ( or ). If there is no crack in the plate, crack-lead converted modes will not exist, and energy of these two classes of signals will be zero.
Fig. 3Extraction of feature signals
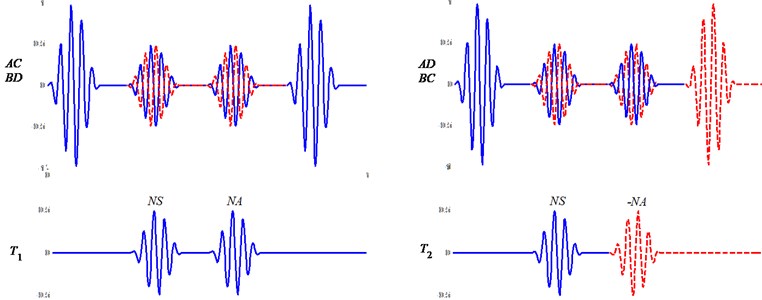
Fig. 4Feature signals and their energy
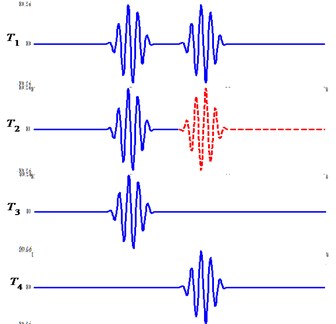
a) Feature signals
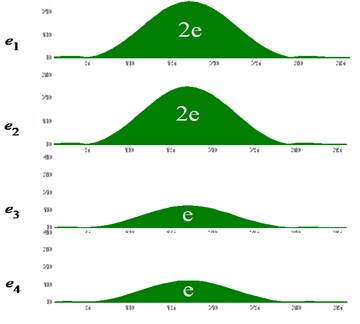
b) Signals energy
Above results are obtained in the ideal case which have no initial error, environmental noise and mode overlap. In the non-ideal case, signal amplitudes in the two classes are not necessarily zero under undamaged condition, and signal energy in the two classes will not necessarily meet the 2:1 relationship under damaged condition.
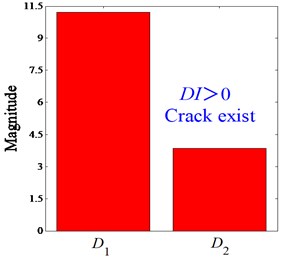
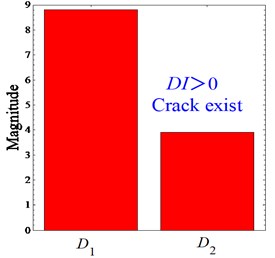
With the length of excitation/measurement path, the material and dimensions of the plate and the location of the crack changed, the optimal excitation frequency corresponding to the minimum degree of the mode overlap will also change. In order to avoid the selection of the optimal excitation frequency, the proposed method in this paper will achieve the detection of cracks in a certain frequency band. When the excitation frequency takes an equal spacing change in the frequency band, each kind of feature signal is obtained first. And their frequency responses will be obtained by the Fast Fourier Transform. The amplitudes of these frequency responses are averaged respectively to represent the average energy –. Considering the presence of initial errors, environmental noises and mode overlaps, damage index () is defined as follows: if the minimum value of the signal energy difference in different classes is larger than the maximum value of it in the same class, the plate will be judged as damaged with a crack; otherwise, the plate will be judged as undamaged with no crack. Here the minimum value of the signal energy difference in different classes is:
It means the minimum value of the energy difference caused by a crack. While the maximum value of the signal energy difference in the same class is:
It means the maximum value of the energy difference caused by initial errors and other factors. Based on this definition, damage index can be expressed as:
If , the crack does exist; if , the crack does not exist.
4. Experimental verification
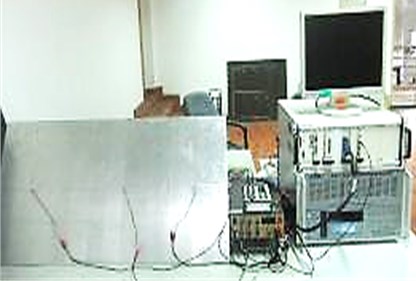
Based on the proposed method, a crack detection system was developed including a computer, an arbitrary waveform generator (NI-5412), a broadband power amplifier (KH Model 7620M), a multifunction data acquisition card (NI-6115) and an aluminum plate with the size of 1000 mm×500 mm×5 mm, as shown in Figure 5. Four PZT sensors whose diameter was 10 mm and thickness 1 mm were symmetrically arranged in the upper and lower surface of the plate with their positive directions off-board.
Fig. 5Crack detection system
Three different cases were tested to verify the validity of the proposed method in this paper. They are as follows: ‘Undamaged Condition’ with no crack, ‘Damaged Location I’ and ‘Damaged Location II’ with a crack. Compared with the difference between the distance of the crack to the excited end and the distance of the crack to the measurement end under ‘Damaged Location I’, in the case of ‘Damaged Location II’ the difference between them is smaller. This makes that the crack-lead converted Lamb wave modes have not enough distance for separation during their propagation, therefore mode overlaps between them will be more serious. Five-peak narrowband waves were selected as the input signals to excite Lamb waves in the plate. The excitation band was 100 kHz – 150 kHz, and the sweep step was 1 kHz. The response signals were collected in the measuring end with 8 MHz sampling frequency and 1 ms sampling time.
Fig. 6Schematic diagram of experimental specimen under ‘Undamaged Condition’
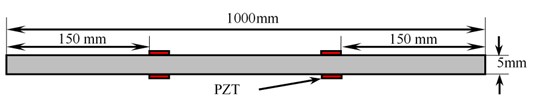
Fig. 7Feature signals at a driving frequency of 100 kHz under ‘Undamaged Condition’
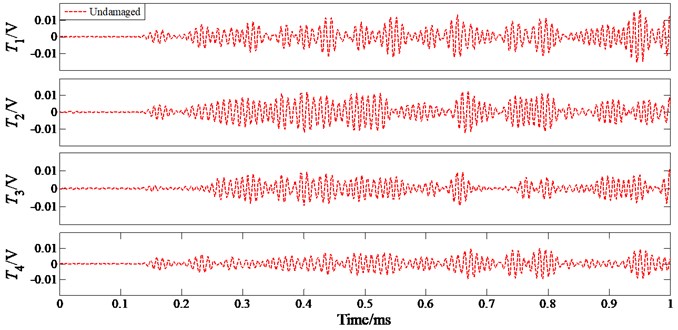
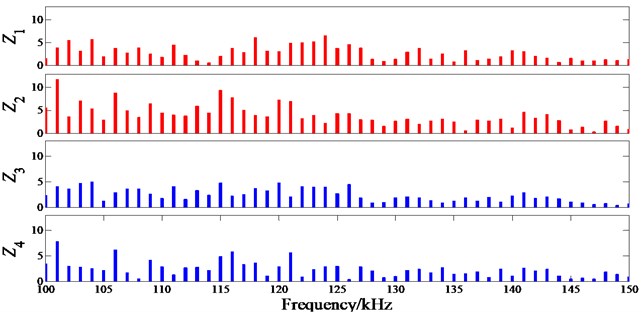
Fig. 8Amplitude spectrum of feature signal frequency responses under ‘Undamaged Condition’
4.1. Undamaged condition
Figure 6 is the experimental specimen diagram of ‘Undamaged Condition’. Feature signals – under ‘Undamaged Condition’ at a driving frequency of 100 kHz are shown in Figure 7. Theoretically their amplitudes should be zero, however due to the presence of initial errors signals whose amplitudes are less than 0.02 V were still received. Figure 8 shows the amplitude spectrums –obtained under ‘Undamaged Condition’. Average energies – were obtained by averaging – respectively, as shown in Figure 9(a). Further and were obtained under ‘Undamaged Condition’, as shown in Figure 9(b): , . The plate was judged as healthful with no crack, the result was consistent with the actual situation.
Fig. 9Average energy and their differences under ‘Undamaged Condition’
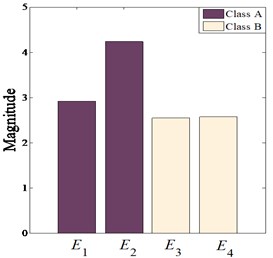
a) Average energy under ‘Undamaged Condition’
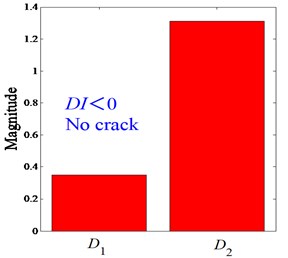
b) Energy differences under ‘Undamaged Condition’
Fig. 10Schematic diagram of experimental specimen under ‘Damaged Location I’
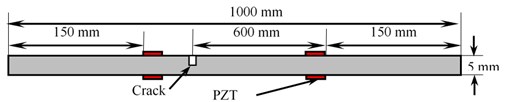
Fig. 11Feature signals at a driving frequency of 100 kHz under ‘Damaged Location I’
4.2. Damaged location I
Figure 10 is the experimental specimen diagram of ‘Damaged Location I’. There was a crack with 50 mm long, 1 mm wide and 3 mm deep which was closer to the excited end. Feature signals – under ‘Damaged Location I’ at a driving frequency of 100 kHz are shown in Figure 11. Signal amplitudes are much larger than they were under ‘Undamaged Condition’. It is known by theoretical calculation [12] that the group velocities of mode and mode are 5282 m/s and 2857 m/s respectively. The first wave packets in – can be judged as , as their ToF are all 0.15 ms. And the first wave packet in can be judged as , as its ToF is 0.23 ms. But in –, mode is submerged by boundary reflected signals. Figure 12 shows the amplitude spectrums – obtained under ‘Damaged Location I’. Average energy was obtained by averaging – respectively, as shown in Figure 13(a). Further and were obtained under ‘Damaged Location I’, as shown in Figure 13(b): , . The plate was judged as damaged with a crack, the result was consistent with the actual situation.
Fig. 12Amplitude spectrum of transfer impedance under ‘Damaged Location I’
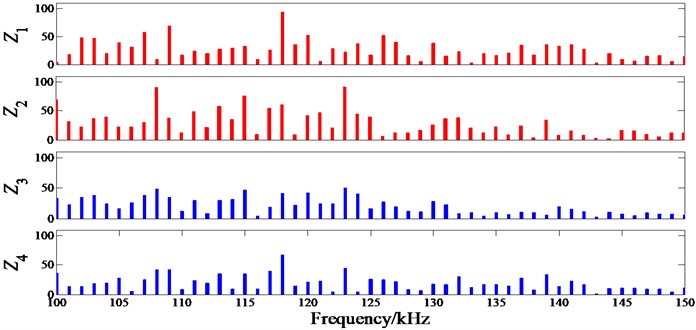
Fig. 13Average energy and their differences under ‘Damaged Location I’
a) Average energy under ‘Damaged Location I’
b) Energy differences under ‘Damaged Location I’
4.3. Damaged location II
As shown in Figure 14, under ‘Damaged Location II’ PZT sensors at the measuring end were moved closer to the crack to make a further verification of the proposed method. Feature signals – under ‘Damaged Location II’ at a driving frequency of 100 kHz are shown in Figure 15. The group velocities of mode and mode are still 5282 m/s and 2857 m/s respectively. The first wave packets in and can be determined as conversion modes and respectively, as their ToF are 0.07 ms and 0.09 ms. Under ‘Damaged Location II’, as the distance between the measuring end and the crack is shorter than it is under ‘Damaged Location I’, and overlapped with each other. It makes them difficult to judge in and . The average energies – and theenergy differences and were obtained under ‘Damaged Location II’, as shown in Figure 16(a) and (b): . Cracks can still be detected. The experiment shows that the proposed crack detection method in this paper can overcome the difficulties brought by complex mode overlap.
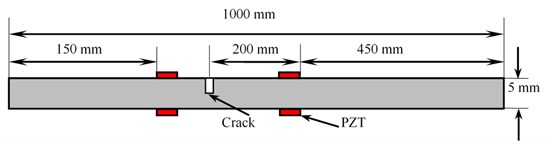
Fig. 14. Schematic diagram of experimental specimen under ‘Damaged Location II’
Fig. 15Feature signals at a driving frequency of 100 kHz under ‘Damaged Location II’
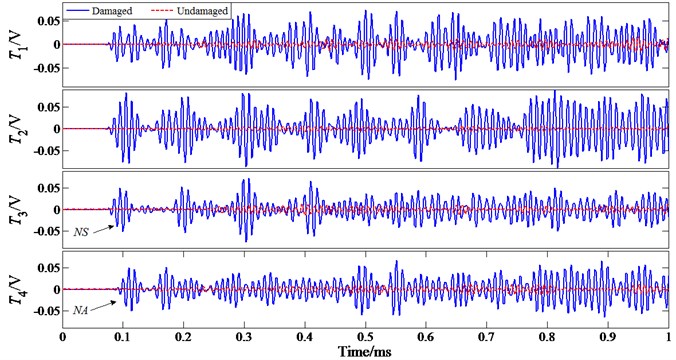
Fig. 16Average energies and their differences under ‘Damaged Location II’
a) Average energy under ‘Damaged Location II’
b) Energy differences under ‘Damaged Location II’
4.4. Sampling time effects on the proposed method
In order to discuss effects of the sampling time on the proposed method, further experimental verifications were conducted under ‘Undamaged Condition’ and ‘Damaged Location I’. Under these two conditions, the ToF of the slowest mode is 0.25 ms. As shown in Table 1 and Table 2: when the sampling time is greater than the ToF of the mode, the under ‘Undamaged Condition’ is always less than zero and the under ‘Damaged Location I’ is always greater than zero, the absolute value of the increases with the increment of the sampling time, the proposed method can make accurate judgments. However when the sampling time is close to or less than the ToF of the mode, feature signals will not be able to fully reflect information relevant to the structural health status. As shown in Table 2: corresponding to the sampling time of 0.25 ms or 0.125 ms is less than zero. The judgment results are no longer accurate.
Table 1Verification results of ‘Undamaged Condition’ correspond to different sampling times
Sampling time/ms | |||||||
1 | 2.92 | 4.24 | 2.54 | 2.58 | 0.34 | 1.32 | -0.96 |
0.875 | 2.24 | 3.25 | 1.94 | 1.98 | 0.26 | 1.01 | -0.75 |
0.75 | 1.64 | 2.39 | 1.45 | 1.62 | 0.02 | 0.75 | -0.73 |
0.625 | 1.14 | 1.66 | 0.99 | 1.01 | 0.13 | 0.52 | -0.39 |
0.5 | 0.73 | 1.06 | 0.66 | 0.64 | 0.07 | 0.33 | -0.26 |
0.375 | 0.41 | 0.6 | 0.36 | 0.32 | 0.05 | 0.19 | -0.14 |
0.25 | 0.27 | 0.18 | 0.09 | 0.16 | 0.02 | 0.09 | -0.06 |
0.125 | 0.04 | 0.02 | 0.02 | 0.03 | 0 | 0.02 | -0.02 |
Table 2Verification results of ‘Damage Location I’ correspond to different sampling times
Sampling time/ms | |||||||
1 | 36.5 | 39.8 | 26.1 | 26.5 | 10 | 3.4 | +6.6 |
0.875 | 27.9 | 30.5 | 20 | 20.1 | 7.8 | 2.6 | +5.2 |
0.75 | 20.5 | 22.4 | 14.9 | 15.7 | 4.8 | 1.9 | +2.9 |
0.625 | 15.5 | 14.3 | 10.2 | 10.4 | 3.9 | 1.2 | +2.7 |
0.5 | 9.1 | 10 | 6.6 | 6.5 | 2.5 | 1.1 | +1.4 |
0.375 | 5.1 | 5.6 | 3.7 | 2.9 | 1.4 | 0.8 | +0.6 |
0.25 | 2.3 | 2.5 | 2.1 | 0.8 | 0.2 | 1.3 | -1.1 |
0.125 | 0.02 | 0.04 | 0.03 | 0.01 | 0.01 | 0.02 | -0.01 |
It is known from the above experimental results that as long as the sampling time is greater than the ToF of the mode, the proposed method in this paper is not sensitive to sampling time and this method can achieve effective judgments on the existence of cracks.
5. Conclusions
This paper proposed a reference-free Lamb wave crack detection method for plate-like structures based on mode conversion. Results of the simulation and experiments show that this method is feasible and effective. The main contributions of this paper are as follows:
(1) In this paper crack-lead Lamb wave mode conversion is used for extracting and classifying feature signals from the excitation/measurement path. And a rapid detection of the crack is achieved by comparing the energy differences of feature signals which contain the converted modes.
(2) The proposed method has a simple signal processing and high detection efficiency as it does not need to extract individual Lamb wave mode accurately in the time domain. Only the amplitudes of the feature signals are required to calculate in the frequency domain.
(3) The proposed method has strong robustness and applicability, as it has no need to select a specific excitation frequency and sampling time, only the energy differences of feature signals are needed to be compared in a certain frequency band for crack detection.
References
-
Schubel P. J., Crossley R. J., Boateng E. K. G., et al. Review of structural health and cure monitoring techniques for large wind turbine blades. Renewable Energy, Vol. 51, 2013, p. 113-123.
-
Feng Y. M., Zhou L. Nonlinear ultrasonic test using PZT transducer for crack detection in metallic component. Journal of Vibroengineering, Vol. 13, Issue 3, 2011, p. 523-530.
-
Willberg C., Koch S., Mook G., et al. Continuous mode conversion of Lamb waves in CFRP plates. Smart Materials and Structures, Vol. 21, Issue 7, 2012, p. 075022.
-
Sohn H. Reference-free crack detection under varying temperature. KSCE Journal of Civil Engineering, Vol. 15, Issue 8, 2011, p. 1395-1404.
-
Wang Q., Yuan S. F. No baseline time reversal imaging method for active Lamb wave structural damage monitoring. Acta Aeronautica Et Astronautica Sinica, Vol. 31, Issue 1, 2010, p. 178-183.
-
Bagheri A., Li Kaiyuan, Rizzo P. Reference-free damage detection by means of wavelet transform and empirical mode decomposition applied to Lamb waves. Journal of Intelligent Material Systems and Structures, Vol. 24, Issue 2, 2013, p. 194-208.
-
Doyle J. F. Wave Propagation in Structures. New York, Springer-Verlag, 1997.
-
Baptista F. G., Vieire F. J., Inman D. J. Real-time multi-sensors measurement system with temperature effects compensation for impedance-based structural health monitoring. Structural Health Monitoring – An International Journal, Vol. 11, Issue 2, 2012, p. 173-186.
-
Marzani A., Salamone S. Numerical prediction and experimental verification of temperature effect on plate waves generated and received by piezoceramic sensors. Mechanical Systems and Signal Processing, Vol. 30, 2012, p. 204-127.
-
Kim M., Kim E. J., An Y. K., et al. Reference-free impedance-based crack detection in plates. Journal of Sound and Vibration, Vol. 330, Issue 24, 2011, p. 5949-5962.
-
Soni S., Das S., Banerjee S., et al. Simulation of damage-features in complex joint using guided waves. Proc. SPIE 6926, Modeling, Signal Processing, and Control for Smart Structures 2008, p. 69260O.
-
Yan G. Damage Detection and Identification for Composites Using Stress Waves and Time-Frequency Analysis. Nanjing, Nanjing University of Aeronautics and Astronautics, 2005.
About this article

This research is partially supported by the National Natural Science Foundation of China (Grant No. 11172128), the Funds for International Cooperation and Exchange of the National Natural Science Foundation of China (Grant No. 61161120323), the Specialized Research Fund for the Doctoral Program of Higher Education of China (Grant No. 20123218110001), the Jiangsu Foundation for Excellent Talent of China (Grant No. 2010-JZ-004) and the Priority Academic Program Development of Jiangsu Higher Education Institutions.
