Abstract
Slow-wave is one of the most typical epileptic activities in EEGs and plays an important role in the diagnosis of disorders related to epilepsy in clinic. However artifacts such as blinking resemble slow-waves in shape and confuse slow-wave detection. Thus, differentiating and removing these artifacts are of great importance in slow-wave detection. In this paper, we propose an improved slow-wave detection algorithm based on discrete wavelet transform (DWT) that specially concerns on removal of blinking artifact (BA). EMD that can break down a complicated signal without a basis function such as sine or wavelet functions is used to decompose EEG. Two intrinsic mode functions (IMFs) which have BA’s characteristic are extracted. Then, we compute the similarity between original EEG and the combination of IMFs for identifying BA. Regression method is used to remove influence of BA from all channels. Finally, improved DWT is employed to detect slow-waves. We employ this method to clinical data and results show that the average false detection rate of the improved method is much lower than that of the traditional DWT method.
1. Introduction
Epilepsy is a common neurological disease that affects millions of people around the world and epileptic seizures are clinical manifestations of abnormal and excessive neuronal discharges in the brain [1]. EEG is a summation of electrical activities generated by cortical neurons and widely used in diagnosis of disorders related to epilepsy [2, 3]. The epileptic EEG signals acquired in clinic contain epileptic waves including spike, sharp-wave, slow-wave, and the combinations. In clinic, they can be observed in most ictal and interictal rhythmic discharges. However slow-wave is an important sign of partial seizures and generalized seizure [4]. Thus the detection of slow-wave is crucial in diagnosis and seizure prediction of epilepsy. Simultaneously, labeling the epileptic waves manually is a very time-consuming process [5] and visual detection has not been proven very efficient [6]. Consequently, automatic detection of epileptic waves is highly concerned.
Epileptic seizure may lead to transient disturbances of mental function and/or movements of different body parts. Therefore, epileptic seizure can cause artifacts which interfere in the judgment of epileptic waves [7, 8]. The BA which occurs at any moment is one of the most common artifacts. It diffuses across the scalp and pollutes all channels’ EEG signals. During the past decades, many methods have been put forward for removing artifacts. A traditional strategy is according to a fixed threshold. All the data that exceed the threshold is discarded on related electrodes. So this method is likely to be simply arbitrary and a complete waste of information. With the non-stationary characteristic of artifacts being accepted, non-linear methods such as independent component analysis (ICA) [9, 10] and wavelet transform [11, 12] etc. are applied. ICA can decompose artifacts and real EEGs into different independent components, but ICA usually requires a large amount of data and visual inspection to eliminate noisy independent components, making the method time-consuming. Wavelet transform is based on an established basis function and reflects the frequency distribution of neural activity of subjects. However, the frequency and amplitude of blinking artifacts are inter- and intra-subject variabilities. Thus, it is difficult to remove the BA irreproachably using wavelet transform; even it may be a wrong way in practice. One of the advantages of EMD is that it can break down a complicated signal without a basis function such as sine or wavelet functions [13]. So EMD can be used to analyze some complicate signals from biology and all of the oscillatory modes embedded in the complicated signal can be described in the time frequency domain.
In virtue of the non-stationary characteristic of epileptic waves, many non-linear methods are applied to detect epileptic waves. Since the amplitude and frequency of slow-wave are comparatively fixed, Wavelet which owns similar morphological characteristics comparing with slow-wave is selected to detect slow-wave. Arab and Suratgar [12] apply Mexican-hat wavelet to decompose the epileptic EEG signals and obtain the wavelet coefficients.Then they use neural network to classifier the epileptic EEG signals from the normal ones with the data set of wavelet coefficients. Gandhi and Panigrahi [14] undertake systematic study. They compare different wavelets’ performance on the accuracy of distinguishing epileptic EEG signals from the healthy ones by features they choose, energy, entropy, and standard deviation of wavelet coefficients. Similarly, wavelet transform is adopted to differentiate epileptic EEG segments from the normal rather than locate the epileptic waves. So wavelet transform is believable in slow-wave detection. For reducing false detection rate, we improve slow-wave detection method based on wavelet transform, applying third order of wavelet coefficients.
In this paper, we employ EMD and regression method for artifact cancelling and we also improve the algorithm of DWT to extract slow-waves. The outline of this study is organized as follows. In section 2, we briefly describe the sets of EEG signals and the algorithms used. In section 3, we discuss optimal weighting combining in artifact removal method and we also present the results of artifact removing method and slow-wave detection method. At last section the performance of slow-wave detection method is provided and we conclude the paper.
2. Materials and methods
2.1. Subjects and recordings
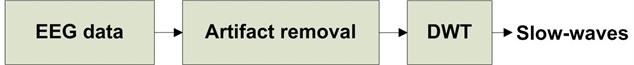
EEG data applied in this paper are collected from the subjects of the second affiliated hospital of Xi’an Jiaotong University, Xi’an, China. The subjects include 28 patients with epilepsy (12-25 year-old males and females) and two normal adults (a 22 year-old male and a 30 year-old male. They are volunteers in Xi’an Jiaotong University, Xi’an, China. They are able bodied, free from medication and any disorders of, or injuries to, the central nervous system.). 21 out of 28 patients are training set to determine the threshold of detecting slow-wave and the remaining 7 patients are test set. To obtain dataset 1 including blinking artifacts, subjects (normal subjects) are instructed to self generate blinking at ease. We also achieve multi artifacts EEG data (dataset 2) which contain blinking artifacts and Electromyography (EMG). Data acquisition system is WEE-1000A/K, Nihon Kohden Corporation, Japan. Exploring cup electrodes are fixed to the scalp at Fp1, Fp2, F7, F8, C3, C4, T5, P3, P4, T6, O1, and O2 according to the International 10-20 System. The reference electrode is located on the ipsilateral ear electrode. The epileptic EEG signals, dataset 1, and dataset 2 are recorded at a sampling frequency of 200 Hz. All the EEG data are amplified with bandpass filter of 0.5–60 Hz. 50 Hz notch filter is employed to wipe power frequency out. Block diagram of the EEG signal processing is shown in Fig. 1.
Fig. 1Block diagram of epileptic EEG signals diagnosis
2.2. Artifacts removing methods
BA may be presented throughout the recording process and the amplitude of this artifact is much greater than the EEG signals [12]. In this paper, we use EMD and regression method to eliminate it.
1) Empirical mode decomposition: empirical mode decomposition (EMD) proposed by N. E. Huang in 1998 [15] is a nonlinear signal processing method. It decomposes signals into a series of intrinsic mode functions (IMFs) indicating the bases of the signals. Each IMF satisfies two basic conditions: (1) in the whole data set, the number of extrema and the number of zero-crossing must be the same or differ at most by one; (2) the local mean value of the envelope defined by local maxima and the local minima is zero. The algorithm of EMD for extracting IMFs from is been summarized as follows [16]:
(1) Compute all the local extrema including maxima and minima of .
(2) Obtain the upper envelope and lower envelope respectively by cubic spline interpolation.
(3) Compute the mean : .
(4) Extract from as Check by the two basic conditions and repeat step 1-4 until an IMF is obtained.
(5) Compute the residual as: , when the first IMF is extracted.
(6) Consider as new and repeat steps 1-5 until IMFs are obtained.
If residual or is a constant or a function with only one maxima and minima, the procedure stops.
After the procedure, IMFs and a residual are achieved. The original signal can be described as Eq. (1). The lower order IMF owns the higher frequency and vice versa.
2) Regression method: regression methods often assume that the scalp potential is a linear combination of brain and blinking potentials. By subtracting propagated blinking from EEG recordings, EEG signals can be recovered [17]. The algorithm is summarized as Eq. (2). [9, 10, 18, 19]:
where is the reconstructed EEG. is the EEG signal except Fp1 and Fp2. is EEG polluted by BA in Fp1 or Fp2. is electrode index except Fp1 and Fp2. indicates Fp1 or Fp2. and are computed in Eq. (3) and Eq. (4) respectively:
where stands for the correlation coefficient of and . and indicate the standard deviations of and respectively. and are the means of and respectively.
2.3. Slow-wave detecting method
Wavelet transform (WT) that is proposed in the late 1980s has the advantage of analysis signals in frequency-scale. The usage of WT is widely. A common use is wavelet filter [20, 21] besides, epilepsy detection is also an area in which the WT has been particularly successful since WT captures transient features and localizes them in both time and frequency content accurately [12]. The wavelet transform is an integral transform and the formula of wavelet transform is described in Eq. (5):
where is the mother function wavelet. is the dilation parameter and stands for the translation parameter.
3. Results
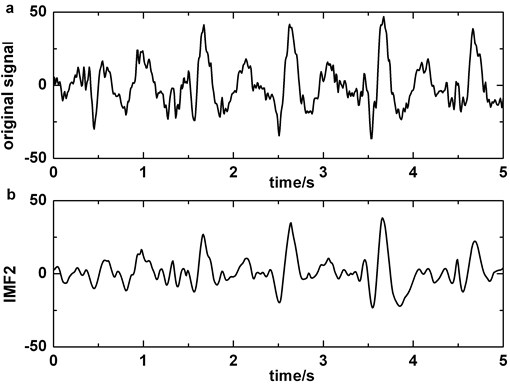
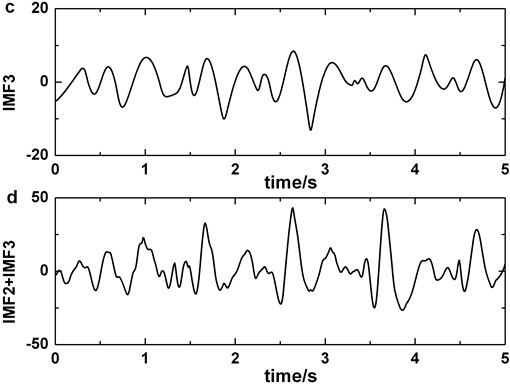
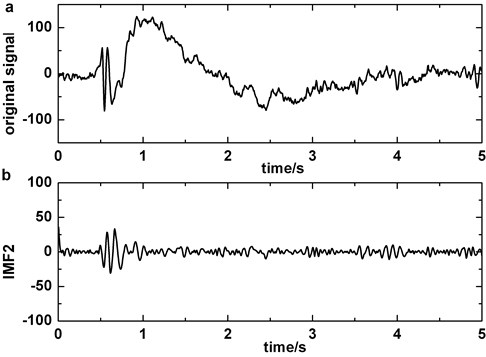
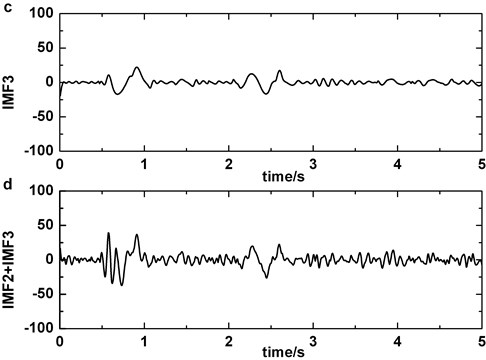
After analyzing dataset 1 with EMD, we discover that IMF2 and IMF3 contain the main morphological features of BA (Fig. 2 (a-b)) and the combination of IMF2 and IMF3 should have more superior similarity than either of them. For obtaining optimal weight of combination, we make a comparison.
Fig. 2Decomposing of EEG signal contained blinking artifacts by EMD: a) original signal, b) IMF2, c) IMF3, d) IMF2 + IMF3
3.1. Optimal weight for combination
The combination method ( and in ) takes the summation value between the two input IMF2 and IMF3. For searching optimal weight, we make comparison on three different ways. The first one is . The second is that (in Eq. (6)) and when the energy of IMF2 is lower than IMF3, i.e., is less than 1; on the contrary, we define and . The last is similar with the second except that (in Eq. (7)) is employed:
where and are the average energy and standard deviation of the -th IMF respectively (2, 3).
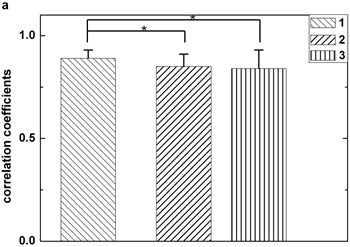
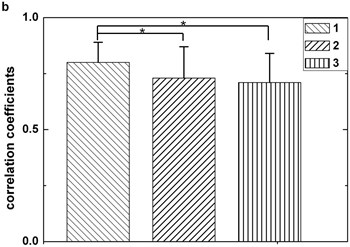
In Fig. 3, box 1, box 2, and box 3 represent correlation coefficients calculated by three different combination ways mentioned above respectively. It is obviously that the first combination method () yield higher correlation coefficients than those using other ways. This suggests that the threshold defined by the first way is higher than others and it benefits to decrease erroneous judgment. Fig. 3 also clearly shows that the first way () holds higher robustness when another artifact is included.
Fig. 3Statistical comparison. The box 1 is significantly higher than the second (p< 0.05), this situation also appears when comparing the first with the third (p< 0.05). Figures (a) and (b) are plotted by dataset 1 and dataset 2 respectively. Each sample stands for five seconds EEG signals. The length of data should not be too short for preventing not enough maxima and minima existing or too long for avoiding reduction of the correlation coefficients between original EEG signal and IMF2 + IMF3
a)
b)
3.2. Artifact removing
Therefore, IMF2 + IMF3 can be served as useful signal in identifying BA from EEG background. It is more clearly in Fig. 2 (a)-(d). We also analyse the clinical EEGs containing BAs and the results validate this finding. Correlation coefficient is employed to quantify the similarity between original EEG signal and IMF2 + IMF3. If the correlation coefficient of original EEG signal and IMF2 + IMF3 is higher than the predefined threshold in Fp1 or Fp2, BA in the original EEG signal is detected.
The threshold discriminating blinking artifacts should be confirmed. The databases contain clinical epileptic EEG data, dataset 1, and dataset 2. Segmentation is performed for a set of thresholds between 0 and 1 with a step of 0.005. For each threshold, the number that is accordance with the prior awareness form of data style is counted. The threshold which leads to the maximum number is kept as the definitive threshold. If several threshold levels lead to the same number, the lowest one is taken. After analyzing, the threshold is set to 0.715.
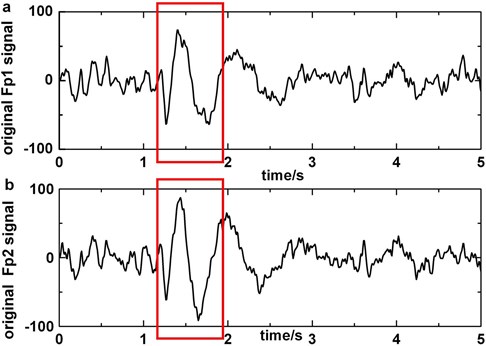
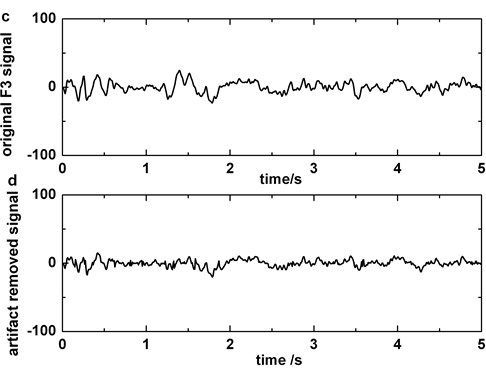
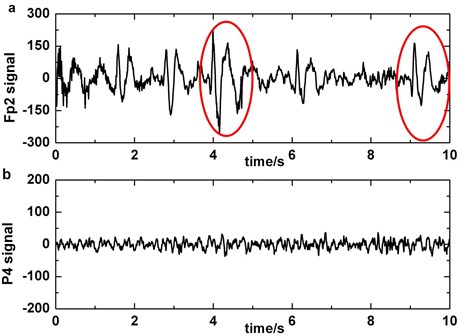
For purpose of removing blinking artifacts completely, we filter the original polluted EEG signals in Fp1 or Fp2 with bandstop filter of 5-8 Hz that is the main frequency of blinking artifacts. Considering the BAs that are obtained by subtracting the filtered data from the original EEG as template, the influence of artifacts on other electrodes (except Fp1 and Fp2) is reduced by regression method. Fig. 4 shows the performance of artifact cancelling method.
Fig. 4a) Original EEG signal which contains blinking in Fp1, b) original EEG signal which contains blinking in Fp2, c) original EEG signal polluted by blinking in F3, d) the EEG signal processed by artifact cancelling method in F3. Blinkings in Fp1 and Fp2 are boxed in boxes
3.3. Slow-wave detection
To locate slow-waves, we apply the db6 wavelet function because the shape of its mother wavelet resembles slow-wave. Fig. 5(a) and (b) display the scale function and the wavelet function of db6 respectively.
The analysis of slow-wave based on discrete wavelet transform (DWT) is performed in three stages: 1) decomposition, using DWT to analysis of EEG signals in four levels; 2) feature extraction, selecting the frequency band, the fourth level, that involves the frequency of slow-wave and cubing the slow-wave wavelet coefficients; and 3) label, detecting and marking the slow-wave relying on slow-wave threshold.
Since EEG is complex in clinic and the amplitude of EEG is inter- and intra-subject variability, statistical method is the best choice. Here we select 500 hours EEG data from 21 patients which contain epileptic slow-waves. For each patient, the result of marking slow-wave is censored by two experts. The method for determining threshold is identical with the artifacts removing threshold and the optimal threshold is decided to 0.403.
Finally, the slow-wave detection method is tested on 7 clinical epileptic EEGs. The results are very promising and the average false detection rate [3] is 15.67 %. The details are presented in section 4 (Table 1).
Fig. 5The wavelet applied: a) scale function of db6, b) wavelet function of db6
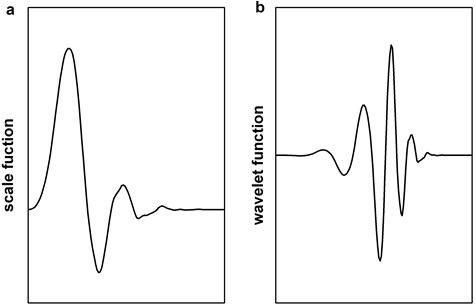
Fig. 6Decomposing of epileptic EEG signal that contains slow-wave by EMD: a) the original epileptic EEG signal which contains slow-wave at about 1 s, b) IMF2, c) IMF3, d) IMF2+IMF3
3.4. Performance of artifact removal method
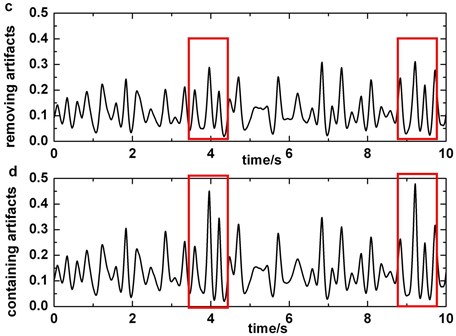
The artifact removing method we present should not disturb the detection of slow-wave (Fig. 6). We compare Fig. 2 with Fig. 6 and the result indicates that the similarity of original signal and IMF2 + IMF3 is greatly lower in Fig. 6, i.e., in the case of blinking artifacts contained, the signals of IMF2 + IMF3 are more similar with original signals. Consequently, the artifact removing method can’t generate misjudgment between slow-waves and artifacts. We also find that the proposed method of eliminating blinking artifacts in this paper can decrease the false detection rate of slow-waves (Fig. 7). It is more obvious in the boxes (Fig. 7(c)-(d)).
Fig. 7a) The original EEG signal which contains blinking artifacts in Fp2 (blinking which pollute P4 channel’s signals is circled), b) the original data which do not contain slow-waves in P4, c) third order of wavelet coefficients of the signal which is preprocessed by blinking cancelling method in P4, d) third order of wavelet coefficients of the original signal which do not have to be preprocessed in P4
4. Discussion and conclusion
4.1. Discussion
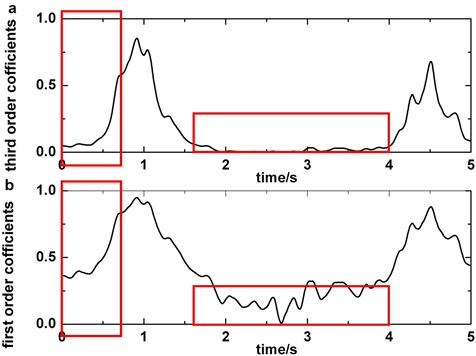
The advantage of third order of wavelet coefficients method comparing with traditional first order of wavelet coefficients method is depicted in Fig. 8. The original data are epileptic EEGs containing slow-waves in O2. This figure makes it clear that the difference between slow-wave and other waves expands when cubing the wavelet coefficient (it is more obvious in the boxes). Hence, the accuracy ratio of detecting slow-wave must rise up with third order of wavelet coefficients applying.
Fig. 8Comparison of third order of wavelet coefficients and first order of wavelet coefficients: a) third order of wavelet coefficients, b) first order of wavelet coefficients
Detailed results are displayed in Table 1. All the data we analyzed are reviewed by two experienced clinicians and they also determine the number and location of slow-waves in each clinical EEG segments. It is obvious that the false detection rate reduces by 53.5 % corresponding to the traditional on average.
Table 1Result of detecting slow-wave
Number | Number of slow-wave | False detection rate of third order of wavelet coefficient (%) | False detection rate of first order of wavelet coefficient (%) |
1 | 16 | 30.00 | 58.97 |
2 | 69 | 10.91 | 16.67 |
3 | 27 | 15.15 | 35.04 |
4 | 24 | 8.33 | 32.23 |
5 | 45 | 22.73 | 33.87 |
6 | 101 | 9.35 | 21.69 |
7 | 36 | 13.24 | 27.78 |
Total | 318 | 109.71 | 226.25 |
Average | 45.43 | 15.67 | 32.32 |
5. Conclusions
In this paper, we presented improved slow-wave detection algorithm that specially concerns on removal of BA. EMD and regression method are utilized to eliminate blinking artifacts and then third order of wavelet coefficients is employed to extract slow-waves. The results of applying the method to clinical epileptic EEGs demonstrate that this method can reduce the false detection rate of slow-wave. Future work will focus on new feature selection in IMF2 and IMF3 which can depict blinking artifacts more clearly. Furthermore, more wavelets will be tested for reducing false detection rate of slow-wave.
References
-
W. A. Hauser, J. F. Annegers, W. A. Rocca Descriptive epidemiology of epilepsy: contributions of population-based studies from Rochester. Mayo Clinic Proceedings, Vol. 71, Issue 6, 1996, p. 576-586.
-
Z. Vasickova, M. Augustynek New method for detection of epileptic seizure. Journal of Vibroengineering, Vol. 11, Issue 2, 2009, p. 279-282.
-
G. H. Xu, J. Wang, Q. Zhang, S. C. Zhang, J. M. Zhu A spike detection method in EEG based on improved morphological filter. Computers in Biology and Medicine, Vol. 37, Issue 11, 2007, p. 1647-1652.
-
R. Tetzlaff, V. Senger The seizure prediction problem in epilepsy: cellular nonlinear networks. IEEE Circuits and Systems Magazine, Vol. 13, Issue 1, 2013, p. 76-78.
-
Y. Z. Zhang, G. H. Xu, J. Wang, L. Liang An automatic patient-specific seizure onset detection method in intracranial EEG based on incremental nonlinear dimensionality reduction. Computers in Biology and Medicine, Vol. 40, Issue 11-12, 2010, p. 889-899.
-
T. Tzallas, M. G. Tsipouras, D. I. Fotiadis Epileptic Seizure Detection in EEGs Using Time-Frequency Analysis, IEEE Transactions on Informatiom Technology in Biomedicine, Vol. 13, Issue 5, 2009, p. 703-710.
-
N. Agata, K. Andrzej, N. Marcin Biomedical signal identification and analysis. Journal of Vibroengineering, Vol. 14, Issue 2, 2012, p. 546-552.
-
E. Kaniusas, A. Podlipskyte, A. Alonderis Relation in-between autonomic cardiovascular control and central nervous system activity during sleep using spectrum-weighted frequencies. Journal of Vibroengineering, Vol. 12, Issue 1, 2010, p. 106-112.
-
S. Romero, M. A. Mananas, M. J. Barbanoj Ocular reduction in EEG signals based on adaptive filtering, regression and blind source separation. Annals of Biomedical Engineering, Vol. 37, Issue 1, 2009, p. 176-191.
-
K. T. Sweeney, T. E. Ward, S. F. McLoone Artifact removal in physiological signals – practices and possibilities. IEEE Transactions on Informatiom Technology in Biomedicine, Vol. 16, Issue 3, 2012, p. 488-500.
-
V. Krishnaveni, S. Jayaraman, L. Anitha, K. Ramadoss Removal of ocular artifacts from EEG using adaptive thresholding of wavelet coefficients. Journal of Neural Engineering, Vol. 3, Issue 4, 2006, p. 338 346.
-
M. R. Arab, A. A. Suratgar, A. R. Ashtiani Electroencephalogram signals processing for topographic brain mapping and epilepsies classification. Computers in Biology and Medicine, Vol. 40, Issue 9, 2010, p. 733-739.
-
X. L. Li Temporal structure of neuronal population oscillations with empirical model decomposition. Physics Letters A, Vol. 356, Issue 3, 2006, p. 237-241.
-
T. Gandhi, B. K. Panigrahi, S. Anand A comparative study of wavelet families for EEG signal classification. Neurocomputing, Vol. 74, Issue 17, 2011, p. 3051-3057.
-
N. E. Huang, Z. Shen, S. R. Long, M. L. Wu, H. H. Shih, Q. Zheng et al. The empirical mode decomposition and Hilbert spectrum for nonlinear and nonstationary time series analysis. Proceedings of the Royal Society of London A, Vol. 454, Issue 1971, 1998, p. 903-995.
-
B. P. Ram, B. Varun Analysis of normal and epileptic seizure EEG signals using empirical mode decomposition. Computer Methods and Programs in Biomedicine, Vol. 104, Issue 3, 2011, p. 373-381.
-
H.-A. T. Nguyen, J. Musson, F. Li EOG artifact removal using a wavelet neural network. Neurocomputing, Vol. 97, Issue 15, 2012, p. 374-389.
-
G. L. Wallstrom, R. E. Kass, A. Miller, J. F. Cohn, N. A. Fox Automatic correction of ocular artifacts in the EEG: a comparison of regression-based and component-based methods. International Journal of Psychophysiology, Vol. 53, Issue 2, 2004, p. 105-119.
-
R. J. Croft, R. J. Barry Multi-channel EOG correction of the EEG: choosing an appropriate regression. International Journal of Psychophysiology, Vol. 30, Issue 1-2, 1998, p. 134-134.
-
S. Dua, U. R. Acharya, P. Chowriappa, S. V.Sree Wavelet-based energy features for glaucomatous image classification. IEEE Transactions on Informatiom Technology in Biomedicine, Vol. 16, Issue 1, 2012, p. 80-87.
-
Guler E., D. Ubeyli Multiclass support vector machines for EEG-signals classification. IEEE Transactions on Information Technology in Biomedicine, Vol. 11, Issue 2, 2007, p. 117-126.
About this article

This work is supported by the National Natural Science Foundation of China (Approval No. 51005176), Ph. D. Program Foundation of Ministry of Education of China (Approval No. 20100201120003) and the Young Scholar Funding of Xi’an Jiaotong University, China.
