Abstract
A single cylinder engine with ability to controlled auto-ignition (CAI) combustion was used in order to study cycle-by-cycle combustion variability. The engine was operated in negative valve overlap (NVO) mode resulting with an internal gas re-circulation. Direct gasoline injection was applied in a single dose during the NVO period. Various intake pressures were applied, ranging from atmospheric aspiration to 0.15 MPa boost pressure. The combustion timing was examined in terms of 5 % mass fraction burnt (MFB). Experimental results showed that cyclic variations of 5 % MFB demonstrate deterministic oscillations under boosted operation. Cycle-by-cycle variability was associated with NVO heat release feedback to the main combustion process. Moreover intermittent combustion behavior was demonstrated with the use of recurrence plots.
1. Introduction
The main advantage of controlled auto-ignition (CAI) combustion systems versus spark ignition and Diesel engines is substantial reduction of cylinder-out NOX emission. Additionally fast heat release rate allows for increase of thermal efficiency in comparison to spark ignition engines.
In order to obtain the auto-ignition of gasoline or other high octane number fuels, the temperature at the end of compression should be elevated above the level attainable in spark ignition or Diesel engines. Thus it is necessary to provide additional energy to the in-cylinder load. It can be achieved in several ways. In the early experiments on this combustion system intake air preheating was widely used, often combined with increased compression ratios. However this technique is not applicable in production automotive engines. Application of high compression ratio is limited due to the need of switching the engine combustion mode to traditional spark ignition at high load operation regime. The most production feasible solution for introducing additional energy into the cylinder is internal exhaust gas trapping via a negative valve overlap (NVO). In order to trap sufficient amount of exhaust in the cylinder, exhaust valve is closed before top dead centre (TDC) in an exhaust stroke and intake valve opening is delayed symmetrically.
Considering specific principles of CAI engine operation, approach to the cyclic variability should be verified as well. The amount of trapped residuals and their temperature are main factors determining combustion timing [1-3]. Also in-cylinder conditions during intake process affect amount of fresh air which enters the cylinder. As a result, thermal balance between trapped residuals and intake air determines compression temperature histories in individual cycles.
Application of fuel injection during the NVO period introduces further complexities into the cyclic variability mechanisms. Early NVO injection enables fuel reforming, which is an endothermic process and causes drop of in-cylinder temperature. However NVO injection into exhaust with some amount of oxygen, produced by lean mixture combustion, can lead to heat release during the NVO period, thus increasing in-cylinder temperature.
In general CAI engines reveal much lower cycle-by-cycle variability in terms of indicated mean effective pressure (IMEP) [4]. However this improvement results from short combustion period taking place at almost constant volume. In fact cyclic variations in start of combustion (SOC) timing are much higher than in Diesel or spark ignition engines where SOC is forced via fuel injection or spark discharge.
In recent years researchers put their attention to combustion stability in CAI engines. The variations between consecutive cycles seem to be a key process which allows for self-regulation of in cylinder mixture composition and its thermodynamic properties.
Daw et al. [5] and Sen et al. [2] demonstrated deterministic patterns of cyclic variations of heat release rate in CAI engine. It was assumed that cyclic variations result mainly from nonlinear internal EGR feedback.
Recently Ghazimirsaied and Koch [6] developed an algorithm enabling prediction of combustion timing one cycle ahead on the base of peak pressure crank angles from two previous cycles. They have also demonstrated peak pressure patterns at engine operation close to misfire limit.
The aim of the present study was analysis of start of combustion timing behaviour under constant fuelling and variable air excess ratio conditions. Variable excess ratio was achieved via boost application. The experimental engine was operated in the NVO mode and fuel was injected directly into the cylinder during exhaust re-compression. Such an experimental scheme enabled the authors to study the effects of NVO phenomena on auto-ignition timing in terms of cycle-by-cycle variability.
2. Experimental apparatus and measurement equipment
The main parameters of a single-cylinder research engine are presented in Table 1. The engine was installed on a test bed utilizing a direct current dynamometer. The engine was equipped with fully variable valve train with independent regulation of valve lifts and timings. Regulation of valve lifts was achieved with the use of hydraulic mechanism. Fully variable valve train allowed the authors to obtain internal EGR via the NVO technique.
Table 1Research engine specifications
Parameter | Value |
Displaced volume | 498.5 cm3 |
Bore | 84 mm |
Stroke | 90 mm |
Compression ratio | 11.7 |
No. of valves | 2 |
Intake cam profile | 9.4 mm, 235 °CA |
Intake valve lift | 2.4–9.4 mm |
Exhaust cam profile | 9.2 mm, 235 °CA |
Exhaust valve lift | 2.2–9.2 mm |
Fuel injector | Solenoid actuated, swirl type |
Supercharger | Electrically driven vane compressor |
Fuel was applied into the cylinder with the use of a single-stream swirl-type injector with fuel stream angle of approximately 70°. Injector was inclined by 38° in relation to the cylinder axis tangentially to the swirl generated by the shape of the intake port. Combustion chamber design and injector characteristics were extensively described in reference [7]. Intake pressure was elevated with the use of a vane compressor driven by electric motor. Fuel consumption was measured via a fuel balance. Indicated pressure was measured using piezoelectric transducer of type GH 12D from AVL cooperating with charge amplifier from the same manufacturer.
3. Experimental conditions and procedure
The examinations were carried out at constant rotational speed of 1500 rev/min and wide open throttle. The engine was fuelled with gasoline (95 research octane number) from a single batch. Fuel pressure, measured in the fuel rail, was set to 10 MPa. Valves lifts were reduced to 3.6 mm for inlet valve and 2.9 mm for exhaust valve in order to realize NVO. Valves timings were constant and specified in Table 2, where 0 °CA was at top dead centre during NVO.
Table 2Experimental engine configuration
Parameter | Value |
IVO | 85°CA |
IVC | 215°CA |
Intake valve lift | 3.6 mm |
EVO | 516°CA |
EVC | 635°CA |
Exhaust valve lift | 2.9 mm |
NVO | 190°CA |
Mass of fuel | 13 mg |
Injection timing | 40°CA BTDC |
The intake pressure was varied form atmospheric level to 0.15 MPa at constant fuel dose equal 13 mg. Fuel was injected during exhaust compression, where start of injection was set to 40 °CA before TDC.
Analysis of the results was based on the measured indicated pressure. At each engine operation point pressure was recorded for 100 consecutive cycles with constant crank angle resolution of 0.1 °CA. The values which characterized combustion process in crank angle domain were derived from heat release rate curves calculated using the first thermodynamic law:
where and are crankshaft resolved in-cylinder pressure and volume respectively. Specific heats ratio was calculated as a function of volume averaged in-cylinder temperature, which was derived from the ideal gas equation of state:
where is entire in-cylinder mass including aspirated fresh air, retained exhaust and fuel. Crankshaft resolved gas constant was calculated considering instantaneous in-cylinder air-exhaust-fuel mixture composition. The mass of trapped residuals was calculated using the ideal gas equation of state based on the in-cylinder pressure, volume above the piston and exhaust temperature measured close to the exhaust valve.
On the basis of cumulated heat released in the combustion chamber, mass fraction burnt (MFB) was estimated. A crank angle position at 5 % of MFB was used to refer the start of combustion.
4. Experimental results
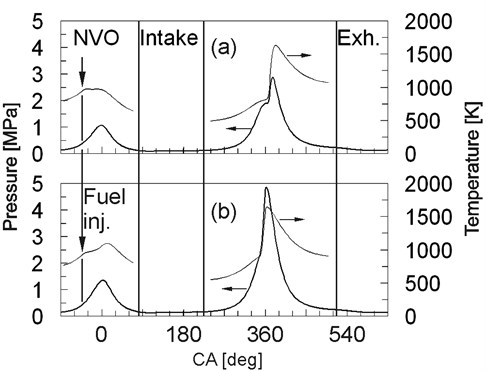
Figure 1 presents in-cylinder pressure and calculated temperature at two boost conditions, i.e. aspiration under ambient pressure and at boost pressure of 0.14 MPa. Pressure and temperature curves for the highest applied boost pressure could not be presented due to cycle-by-cycle variability for these conditions.
At the naturally aspirated operation stoichiometric mixture during the main combustion was achieved. As a result only limited quantity of oxygen was trapped during the NVO period. Fuel injection into soichiometric residuals resulted in drop of peak NVO temperature, as shown in Fig. 1a. The drop of temperature was an effect of fuel vaporization and steam reforming process. Contrarily, at boost pressure of 0.14 MPa an increase of exhaust-fuel mixture temperature after fuel injection can be observed (Fig. 1b). In this case air excess ratio was 1.4, thus there was oxygen availability during the NVO period. As a result heat release took place, which affected temperature during fresh air intake and, in consequence, compression temperature.
Fig. 1In cylinder pressure and temperature at ambient: a) intake pressure, b) 0.14 MPa boost pressure
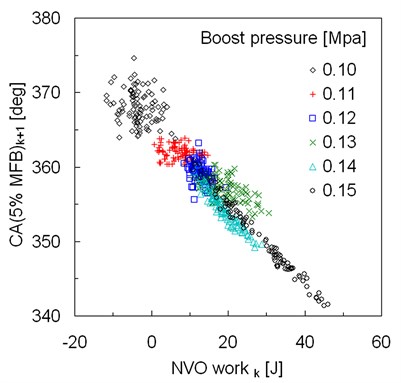
In order to depict how boost pressure and resulting air excess ratio affect cycle-by-cycle variability in auto-ignition timing data series of 5 % MFB were presented in Fig. 2. Figure 3 shows return maps for 5 % MFB to better exhibit correlations between consecutive cycles. In the case of atmospheric intake relatively high cycle-by-cycle variability can be observed. It is plausible that at atmospheric aspiration intake air mass is more variable than at boosted cases, even without excessive NVO heat release. At lower boost pressures auto-ignition exhibited very low level of cyclic variability. Standard deviation of 5 % MFB at boost pressure of 0.11 MPa was only 0.9 °CA. However increase of intake pressure resulted in an increase of cyclic variability. For intake pressure of 0.14 MPa oscillations of auto-ignition timing can be observed, however they are attenuated after some number of cycles. In the case of boost pressure of 0.15 MPa early and late auto-ignition angles appeared alternatively. In this case heat release during the NVO in consecutive cycles alternated between low and high values. As a result, auto-ignition followed by NVO was correlated with heat release during this event. The effect of NVO work on the subsequent main event auto-ignition angle was shown in Fig. 4. A plausible conclusion could be drawn that variability in NVO heat release resulted from variations in oxygen availability during the NVO period. High NVO heat release caused drop in intake air quantity, thus higher temperature accelerated auto-ignition. Also such a cycle was characterized by lower main event air excess and resulting higher combustion temperature. As a result higher exhaust temperature reduced mass of trapped residuals in the following cycle, additionally containing less oxygen. The straight forward consequence was higher volumetric efficiency of the next cycle, lower temperature and later auto-ignition.
Fig. 2Data series of crank angle at 5 % of MFB for different boost pressures indicated in the figures
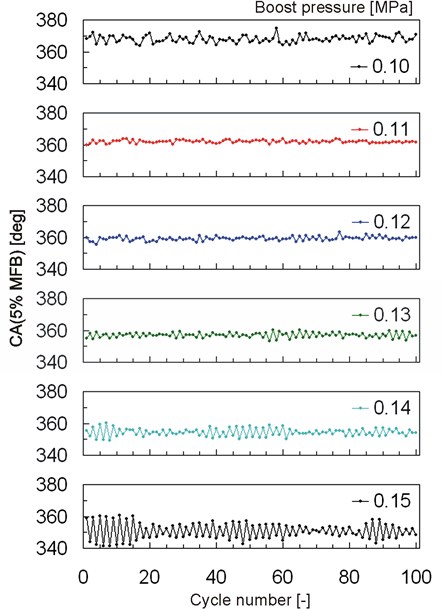
Fig. 3Return map of crank angle at 5 % of MFB for different boost pressures
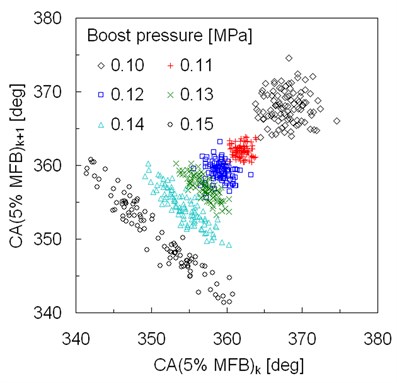
Fig. 4Crank angle at 5 % of MFB versus NVO indicated work for different boost pressures
5. Recurrence analysis
Recurrence plots analysis, introduced in 1987 by Eckmann et al. [8] is a simple and useful method based on the Takens embedding theorem [9], often utilized for examining short time series. This approach reconstructs multidimensional phase space from single dimensional time series. Considering -length time series in the form:
we get length time series of vectors:
where:
In our analysis we extend one dimensional time series into two dimensional phase space placing dimension 2 and time delay 1. Recurrence plots are graphical representation of matrices , calculated using the Heaviside function , as:
is a threshold value. Recurrence plots figures assign ”black” points to , for which 1 and “white” points otherwise. Indexes and number time steps of the series. Recurrence plot analysis is described in detail in Marwan et al. review article [10].
Fig. 5Recurrence rate RR versus the threshold e for various boost pressures indicated in the figure. Note that this plot can differentiate various cases with different boost pressure
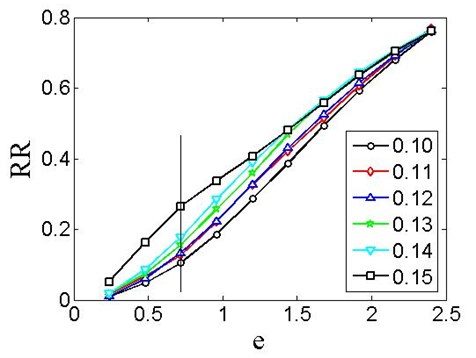
For all the data we calculated recurrence plots for several values of threshold parameter changing from 0.24 to 2.4 with step 0.24. is measured in units of standard deviation of pressure variation. Despite low number of data points in analyzed data series, recurrence plots differ one from the other comparing figures obtained for the same value (different series) and for different (the same series).
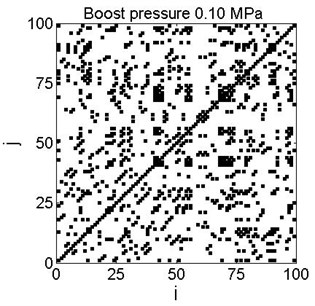
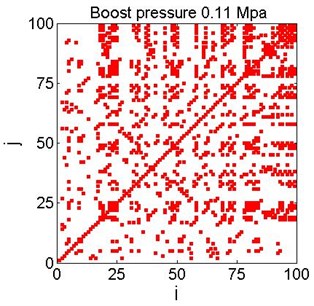
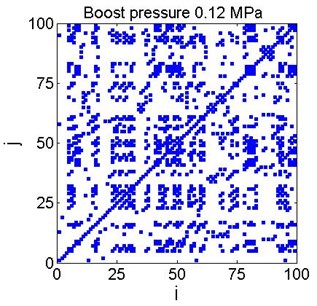
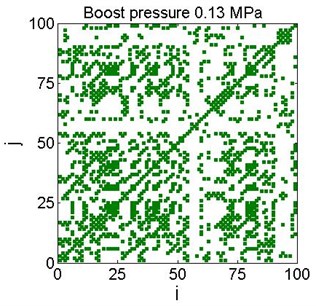
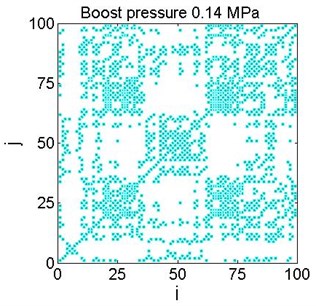
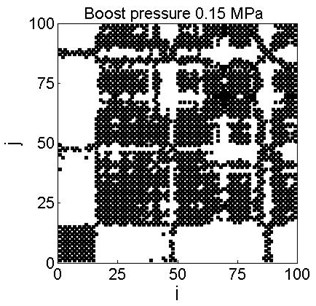
In the next figures recurrence plots are shown as obtained for each time series for the same parameter 0.72. Square-like and other characteristic shapes are visible on the plots indicating intermittencies existing in the investigated data series. For every recurrence plot coefficient was calculated according to the formula:
where denotes total number of black points in the recurrence plot. Dependencies for all data series are plotted in Fig. 6.
Fig. 6Examples of recurrence plots for different boost pressure for the chosen threshold value (Fig. 5)
a)
b)
c)
d)
e)
f)
As it can be seen, all curves are similar in shape and values. However in the selected regions the particular curves are shifted. This effect was investigated earlier in technical systems [11, 12] and suggested as a criterion for fault identification, reflected by process instabilities or intermittent behavior. The largest differences are at the 0.72 value, marked by the vertical line, as shown in Fig. 5.
Application of boost strongly influences cycle-to-cycle combustion variability, making more effective negative correlation of successive cycles (see Fig. 2). By increasing boost pressure we observe the transition from fairly stochastic distribution (Fig. 6, boost pressure of 0.10 and 0.11 MPa) to more deterministic features (Fig. 6, boost pressure of 0.14 and 0.15 MPa). Namely, in the last two cases the intermittency between two different combustion process evolutions with early and late auto-ignition angles is exhibited.
The observed variations in combustion process results from internal EGR feedback. In general high EGR rate deteriorates cycle-by-cycle stability due to mixture dilution and imperfect mixing of fresh air with residuals [13-22]. In the case of CAI engine cycle, internal EGR can be treated as a carrier of close loop relationships between consecutive cycles. The profound mechanism of cyclic variability consists of heat release process during the NVO period, thus boosts application and resulting increase of air excess ratio enhances deterministic behaviours.
Similar features under different conditions were studied for spark ignition engines, including natural gas and gasoline, and Diesel engines [19, 23-24]. Interestingly, intermittency distinguishes homogeneous charge compression ignition engines from spark ignition or Diesel engines [5]. A deterministic destabilization of a combustion process which could be detected by the recurrence rate parameter (Fig. 5) should be studied deeper, as it can be a key factor deteriorating combustion stability. It should be noted that elimination of cyclic variability in combustion engines could increase thermal efficiency up to 10 % [14].
6. Conclusions
We studied the cycle-by-cycle variations in boosted CAI engine in terms of auto-ignition timing variations for variable boost pressure. We observed that the evolution of auto-ignition dynamics reflects deterministic destabilization of the combustion process. The recurrences results show interesting formation of intermittency with increasing boost pressure. This means that two or more competing schema of combustion could be present in that system.
However, to fully describe the variability mechanism we should go to other standard nonlinear methods sensitive to nonstationarities and switching dynamics responses as wavelets and multifractals [2].
References
-
Koopmans L., Backlund O., Denbratt I. Cycle to cycle variations: their influence on cycle resolved gas temperature and unburned hydrocarbons from a camless gasoline compression ignition engine. SAE Technical Paper, 2002-01-0110, 2002.
-
Sen A. K., Litak G., Edwards K. D., Finney C. E. A., Daw C. S., Wagner R. M. Characteristics of a cyclic heat release variability in the transition from spark ignition to HCCI in a gasoline engine. Applied Energy, Vol. 88, 2011, p. 1649-1655.
-
Sjöberg M., Dec J. E. Comparing late-cycle auto-ignition stability for single- and two-stage ignition fuels in HCCI engines. Proceedings of the Combustion Institute, Vol. 31, 2007, p. 2895-2902.
-
Maurya R. K., Agarwal A. K. Statistical analysis of the cyclic variations of heat release parameters in HCCI combustion of methanol and gasoline. Applied Energy, Vol. 89, 2012, p. 228-236.
-
Daw C. S., Wagner R. M., Edwards K. D., Green J. B. Understanding the transition between conventional spark-ignited combustion and HCCI in a gasoline engine. Proceedings of the Combustion Institute, Vol. 31, 2007, p. 2887-2894.
-
Ghazimirsaied A., Koch C. R. Controlling cyclic combustion timing variations using a symbol-statistics predictive approach in an HCCI engine. Applied Energy, Vol. 92, 2012, p. 133-146.
-
Hunicz J., Kordos P. An experimental study of fuel injection strategies in CAI gasoline engine. Experimental Thermal and Fluid Science, Vol. 35, 2011, p. 243-252.
-
Eckmann J.-P., Kamphorst S. O., Ruelle D. Recurrence plots of dynamical systems. Europhys. Lett., Vol. 4, 1987, p. 973-977.
-
Takens F. Detecting strange attractors in fluid turbulence, in detecting strange attractors in turbulence. Dynamical Systems and Turbulence, Springer, Berlin, Vol. 898, 1981, p. 366-381.
-
Marwan N., Carmen Romano M., Thiel M., Kurths J. Recurrence plots for the analysis of complex systems. Physics Reports, Vol. 438, 2007, p. 237-329.
-
Litak G., Sawicki J. T., Kasperek R. Cracked rotor detection by recurrence plots. Nondestructive Testing and Evaluation, Vol. 24, 2009, p. 347-351.
-
Syta A., Jonak J., Jedlinski L., Litak G. Failure diagnosis of a gear box by recurrences. Journal of Vibration and Acoustics – Transactions of ASME, Vol. 134, 2012, p. 041006.
-
Hu Z. Nonlinear instabilities of combustion processes and cycle-to-cycle variations in spark-ignition engines. SAE, Paper No. 961197, 1996.
-
Ozdor N., Dulger M., Sher E. Cyclic variability in spark ignition engines – a literature survey. SAE, Paper No. 940987, 1994.
-
Daw C. S., Kennel M. B., Finney C. E. A., Connolly F. T. Observing and modeling dynamics in an internal combustion engine. Phys. Rev. E, Vol. 57, 1998, p. 2811-2819.
-
Daw C. S., Finney C. E. A., Tracy E. R. A review of symbolic analysis of experimental data. Rev. Sci. Instrum., Vol. 74, 2003, p. 915-930.
-
Curto-Risso P. L., Medina A., Hernández A. C., Guzmán-Vargas L., Angulo-Brown F. L. On cycle-to-cycle heat release variations in a simulated spark ignition heat engine. Applied Energy, Vol. 88, 2011, p. 1557-1567.
-
Curto-Risso P. L., Medina A., Hernández A. C., Guzmán-Vargas L., Angulo-Brown F. L. Monofractal and multifractal analysis of simulated heat release fluctuations in a spark ignition heat engine. Physica A, Vol. 389, 2010, p. 5662-5670.
-
Sen A. K., Litak G., Finney C. E. A., Daw C. S., Wagner R. M. Analysis of heat release dynamics in an internal combustion engine using multifractals and wavelets. Applied Energy, Vol. 87, 2010, p. 1736-1743.
-
Tily R., Brace C. J. Analysis of cyclic variability in combustion in internal combustion engines using wavelets. Proc. Inst. Mech. Engin., Part D: J. Autom. Engin., Vol. 225, 2011, p. 341-353.
-
Gęca M., Wendeker M., Litak G. Combustion variability and uniqueness in cylinders of a large power radial engine. Journal of Vibroengineering, Vol. 14, 2012, p. 582-590.
-
Litak G., Geca M., Yao B.-F., Li G.-X. Indicated mean effective pressure oscillations in a natural gas combustion engine. Zeitschrift Fuer Naturforschung, Vol. 64A, 2009, p. 393-398.
-
Litak G., Syta A., Yao B.-F., Li G.-X. Indicated mean effective pressure oscillations in a natural gas combustion engine by recurrence plots. Journal of Theoretical and Applied Mechanics, Vol. 47, 2009, p. 55-67.
-
Longwic R., Sen A. K., Górski K., Lotko W., Litak G. Cycle-to-cycle variations of the combustion process in a diesel engine powered by different fuels. Journal of Vibroengineering, Vol. 13, 2011, p. 120-127.
About this article

This research was funded by the Polish National Science Centre under Grant No. 2012/05/B/ST8/00077.
