Abstract
Application of power tillers are being increased as a main source of power supply for agricultural equipment due to their economic benefits. Beside on field applications, they are also engaged on transportation of agricultural products and human beings on rural roads. In spite of these advantages, power tillers are a big source of vibration generation too. Therefore, their operators have to work in a harsh environment. Single cylinder diesel engine used in power tillers and lack of suspension system are the main cause for generating high levels of vibration. The present research work was conducted on a 13-hp power tiller to determine the maximum and minimum vibration acceleration envelope curves on transportation mode. The power tiller vibration acceleration signals were measured for four transmission ratios and five engine speeds at positions of the power tiller handle and trailer seat to be pulled by the power tiller as well as wrist, arm, chest and head of the power tiller operator’s. The recorded time domain signals were converted to frequency domain signals using Fast Fourier Transform (FFT) algorithm. The 1/3rd octave frequency band was determined from the frequency domain signals. The maximum and minimum envelope curves were determined from the 1/3rd octave bands. The envelope curves at the handle position showed that the root mean square (RMS) values of vibration acceleration for frequencies of 8 to 80 Hz were exceeded 2 m/s2 (hand-arm exposure limit for 8 hours working per day) and at 31.5 Hz it reached to 11 m/s2. At the trailer seat position, the RMS values of vibration acceleration were exceeded the standard limits for comfortable operation in the frequency ranges of 3.15 to 6.3 and 25 to 40 Hz. Furthermore, the derived envelope curves seem to be suitable guidelines for designing and developing vibration control systems in the power tiller.
1. Introduction
Power tillers or two wheel tractors are the main sources of power supply in small and medium size farms. Due to their economic benefits and user capabilities in various conditions, they are also engaged on transportation of agricultural products and human beings on rural roads [1, 2]. Agricultural machineries, especially those controlled by operator’s hand, transmit high level of vibrations to operators hand and body. In spite of power tillers benefits, they generate high level of vibrations due to their single cylinder diesel engine and lack of vibration damping facilities. The operator of a power tiller has to endure various environmental stresses. The mechanical vibration is the most important parameter that affects sensitivity and reaction rates of the operator fatigue [3]. Besides, power tiller operators work in harsh environment and this is the reason for importance of ergonomic characteristics of the power tiller. Long term of continues working with power tillers, creates movement disorders, damage to various body organs including the ear, spine and gastrointestinal disorders and even neurological diseases [4, 5]. Aside from these cases, work quality loss was also observed [6]. Walking and riding control type power tillers are currently used. In the walking control type, vibrations are transmitted to the operator’s body through the hands i.e. hand-transmitted vibration (HTV). In the case of a riding control type, vibrations are transmitted to the operator’s body from two possible ways: one way is through the seat as whole body vibration (WBV) and the other through the hands as HTV. In order to reduce the risk of using such machines, there are some guidelines by international organizations to limit working hours and duration of vibration exposure, ISO 5349 [7] standard for HTV and ISO 2631 [8] standard for WBV are the examples. The objectives of these standard references are obligations in design and manufacturing of safe tools and machines, equipping them with adequate suspending systems, and preparing working schedules for operators. According to these standards, the severity of biological effects of vibration during operation is influenced by the frequency of vibration, its magnitude and duration of exposure, environmental conditions, and the direction of transmitted vibration to the hand and body of operators. The unevenness of road is also an excitation of the vibration, and it makes up about 20 % of the total HTV of a power tiller [9].
Mechanical vibration of a machine is caused by its moving components, which every part has a certain frequency related to its movement. The vibration transmitted to human body in contact with the machine consists of different frequencies, and this is important to consider because human body is not equally sensitive to all frequencies of vibration [10].
The vibration transmissibility with frequencies of 15 to 35 Hz to human hip and lumbar spine revealed that for subjects standing erect, the vibration transmissibility at the hip exceeded 100 % for frequencies less than 20 Hz, which might be attributed to resonance. For frequencies more than 25 Hz, the vibration transmissibility decreased to approximately 80 % at the hip and spine [11]. The transmissibility of whole body vibration in different standing postures showed that the transmissibility of vibration in head was much smaller than any other skeletal positions and there was a peak around 9 to 11 Hz in the transmissibility curves for knee joint and pelvis [12]. Evaluating transmission of vertical sinusoidal vibration to the human body with mounted tri-axial accelerometers at the ankle, knee, hip, and lumbar spine in four males standing on a vibration platform showed that there was substantial peak acceleration in the range of 10 to 40 Hz for the ankle, 10 to 25 Hz for the knee, 10 to 20 Hz for the hip and at 10 Hz for the spine. Beyond these frequencies, the transmitted vibration power declined dramatically. Also, the transmission of vibration to the body is known as a complicated phenomenon because of non-linearity in the human musculoskeletal system [13].
Human exposures to whole-body vibration usually involve excitation in more than one axis, and yet most experimental studies of human responses to vibration have been restricted to a single axis of excitation. The bio-dynamics responses to vertical and fore-and-aft vibration are coupled, so the response to vibration in one of these directions can be modified by excitation in the orthogonal direction. This coupling may influence effects of whole-body vibration on comfort, performance and health [14].
Effects of variation in engine speed on a 7.5-hp power tiller vibration were investigated in different conditions. The results showed that the RMS of vibration in all conditions and all directions were increased with increasing engine speed. The equivalent vibration transmitted to operator’s hand at tilling operation was reported 16.66 m/s2 for eight-hour working day [15]. Previous research works also showed that vibration transmitted to human body from power tiller was greater than ISO standards limits [2, 4, 5, 16].
In order to better and easier understanding the differences in the frequency spectrum of 1/3rd octave, the maximum and minimum envelope curves have been used as an effective method of controlling and reducing noise and vibration levels such as ear protectors [17].
Literature survey showed that there is not any published study concerning vibration envelope curves of a 13-hp power tiller on transportation mode so far. the objective of this paper was to determine the maximum and minimum envelope curves of a 13-hp power tiller vibration on 1/3rd octave frequency bands for different levels of engine speeds and gear ratios at the tractor handle grip and trailer seat as well as operator’s wrist, arm, chest and head positions on asphalt rural road. The obtained experimental data can be used for power tiller structure design in order to reduce the harmful effect of vibration on operator as well as designing vibration insulating and protecting systems.
2. Materials and methods
2.1. The power tiller specifications
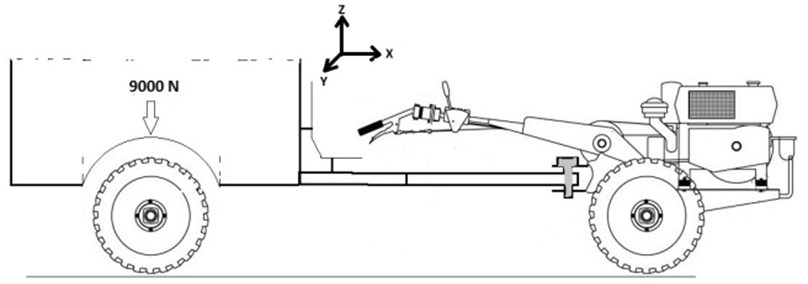
The power tiller (Mitsubishi CT-82) used for this research study was fitted with a single cylinder, four strokes, naturally aspirated, water-cooled, indirect injection diesel engine that was providing 13-hp power at rated engine speed of 2200 rpm. The travel speed of the power tiller was six stages forward and two stages reverse. In order to make practical use of the power tiller at transportation conditions, a load of 9000 N was placed inside a trailer, which was pulled by the power tiller (Fig. 1).
Fig. 1Power tiller and attached trailer
2.2. Test matrix and variables ranges
The selected variables were engine speeds, transmission gear ratios, measurement positions, and measurement directions. The ranges of variables considered to perform the test covered the normal and safe operating range of the power tiller during operation. Table 1 shows the test matrix for the power tiller under test.
Table 1Matrix of the experimentations
Parameters | Levels of parameters | |||||
1 | 2 | 3 | 4 | 5 | 6 | |
Engine speed (rpm) | 1400 | 1600 | 1800 | 2000 | 2200 | - |
Gear ratio | 2-light | 2-heavy | 3-light | 3-heavy | - | - |
Measurement positions | Handle grip | Trailer seat | Operator’s wrist | Operator’s arm | Operator’s chest | Operator’s head |
Measurement directions | Vertical | Longitudinal | Lateral | - | - | - |
2.3. Measuring and recording instrumentation
Instrumentations used in this study, were compiled with technical requirements and guidelines of ISO standards for measuring and analysis of WBV and HTV like ISO 5349 [7], ISO 2631 [8], and ISO 8041 [18]. The instruments consisted of three CTC-AC192 type accelerometers (100 mV/g sensitivity, 0.4-14000 Hz frequency response, ±50 g peak dynamic range, PZT ceramic shear mode sensing element), a 24-V battery power supply, a Lutron DT-2236 tachometer (measuring range of 0.5-19999 rpm with accuracy of 1 rpm over 1000 rpm), an Advantech 4711A type A/D converter (16 channels, 150 kHz sampling rate with 12 bits resolution), MATLAB and LABVIEW software programs, a lap-top computer and a few other devices.
2.4. Vibration measurement and signal processing
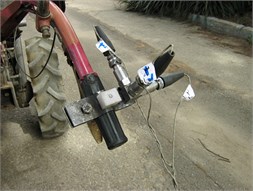
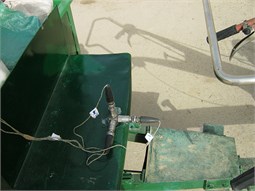
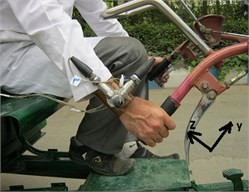
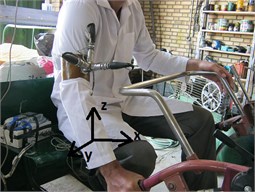
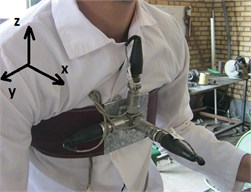
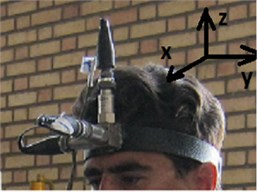
Using guidelines of ISO standard Nos. 5341 [7], 2631 [8] and 8041 [18], three accelerometers were used for vibration measurement at all positions. The standard orientations for human body vibration measurement are shown in Fig. 2. Using suitable adapter, the accelerometers were mounted on the right handle grip of power tiller (Fig. 3(a)), the trailer seat (Fig. 3(b)) as well as operator’s wrist (Fig. 3(c)), arm (Fig. 3(d)), chest (Fig. 3€) and head (Fig. 3(f)) while operator was seated on the trailer seat and holding the handle to control the power tiller. The required power for the set up was supplied from a 24-volt battery and an electronic circuit. Using an A/D converter which is recognized and controlled by LABVIEW software program, the accelerometer analog output voltage was converted to digital ones with 40000 Hz sampling rate and recorded on a lap-top computer hard drive. In order to assess the operator health, it is necessary to carry out the analysis of the vibration signals in the frequency domain. The recorded digital time domain signals were converted to frequency domain narrow band signals by Fast Fourier Transform (FFT) algorithm using MATLAB software program. Due to sudden change and uncertainty of the narrow band signals, the narrow band frequency domain signals were converted to 1/3rd octave frequency band signals by a subroutine computer program. Meanwhile the 1/3rd octave spectrum can reveal many details while having the stability [19].
Fig. 2a) Coordinate system for whole body vibration measurement: X axis, longitudinal (back to chest); Y axis, lateral (right side to left side); Z axis, vertical (foot or buttocks to head), b) coordinate system for the hand-arm vibrations measurement [7, 8]
![a) Coordinate system for whole body vibration measurement: X axis, longitudinal (back to chest); Y axis, lateral (right side to left side); Z axis, vertical (foot or buttocks to head), b) coordinate system for the hand-arm vibrations measurement [7, 8]](https://static-01.extrica.com/articles/14629/14629-img2.jpg)
a)
![a) Coordinate system for whole body vibration measurement: X axis, longitudinal (back to chest); Y axis, lateral (right side to left side); Z axis, vertical (foot or buttocks to head), b) coordinate system for the hand-arm vibrations measurement [7, 8]](https://static-01.extrica.com/articles/14629/14629-img3.jpg)
b)
Fig. 3Accelerometers mounting positions: a) handle grip, b) trailer seat, c) operator’s wrist, d) operator’s arm, e) operator’s chest, and f) operator’s head
a)
b)
c)
d)
e)
f)
The 1/3rd octave frequency spectrum was weighted in order to compare with standard values. The amount of vibration damage on operator's body and the exposure limits were calculated in accordance with the ISO standard No. 5349 [7] for hand-arm vibration and ISO standard No. 2631 [8] for whole body vibration. The amount of damage and exposure limits in terms of vibration acceleration root mean square (RMS) value for whole body vibration is given in Table 2.
Table 2The exposure limits based on human response to whole body vibration [8]
Human response | Exposure limit (RMS), m/s2 |
Comfortable | <0.315 |
A little uncomfortable | 0.315-0.63 |
Almost uncomfortable | 0.5-1 |
Uncomfortable | 0.8-1 |
Very uncomfortable | 1.5-2.25 |
Extremely uncomfortable | >2.25 |
Fig. 4The power tiller total vibration acceleration signals in 1/3rd octave frequency band for different gear ratios on 2200 rpm engine speed at trailer seat, handle grip, operator’s chest, operator’s wrist, operator’s head, and operator’s arm positions
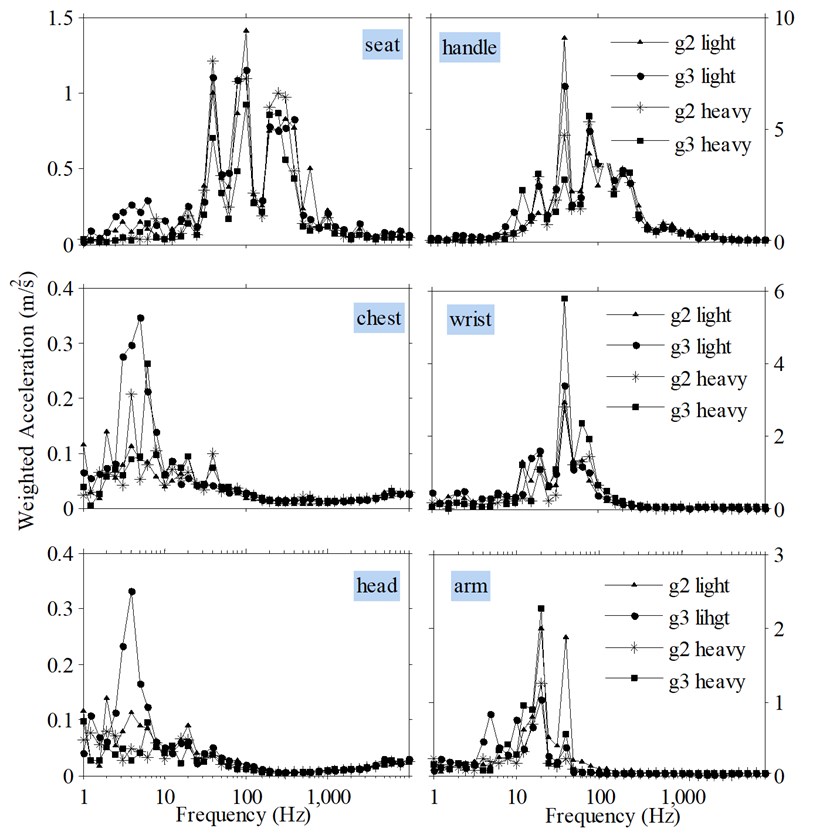
Figure 4 shows the total weighted acceleration signals (sum of three directions) in 1/3rd octave frequency band for the different gear ratios at 2200 rpm engine speed for the different measurement positions. To do vibration assessment at each measurement position, the power tiller acceleration signal should be drawn for the other levels of engine speeds like Fig. 4. Since study and evaluation of such figures is a difficult and time consuming process, the maximum and minimum envelope curves of total un-weighted and weighted accelerations were determined using Grapher software from the corresponding 1/3rd octave frequency band spectra of vibration acceleration for the different levels of engine speeds and gear ratios by the least and most acceleration values in each center of frequency bands.
3. Results and discussion
3.1. The maximum and minimum un-weighted vibration acceleration envelope curves
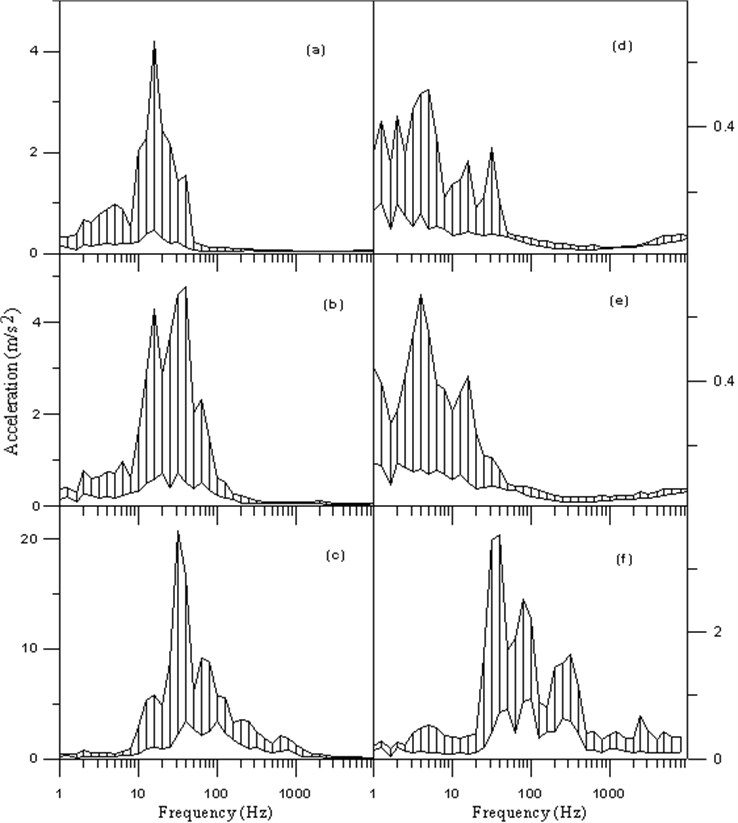
Figure 5 shows the maximum and minimum envelope curves of total un-weighted vibration (sum of three directions , , ) for the different engine speeds and gear ratios at the operators’ arm, wrist, head and chest as well as the power tiller handle grip and the trailer seat positions. At operator’s arm position (Fig. 5(a)), the amplitude of vibration acceleration for frequencies greater than 50 Hz was less than 0.1 m/s2. The vibration amplitude in center frequencies of 10, 12.5, 16, 20 and 25 Hz were more than 2 m/s2 with the maximum peak value of 4.2 m/s2 at 16 Hz. At operator’s wrist position (Fig. 5(b)), the vibration amplitude for frequencies greater than 200 Hz was less than 0.1 m/s2. The vibration amplitude in the range of 12.5 to 63 Hz was more than 2 m/s2 with the maximum of 4.85 m/s2 at 40 Hz. At the power tiller handle grip position, the vibration amplitude for frequency less than 8 Hz and greater than 1600 Hz was less than 0.1 m/s2 (Fig. 5(c)). At this position, the maximum peak value was 21 m/s2 and occurred in frequency of 31.5 Hz. The peaks at the center frequencies of 25, 31.5 and 40 Hz are related to the power tiller engine rotational speeds. At operator’s head position (Fig. 5(d)), the vibration amplitude for frequencies greater than 50 Hz was less than 0.1 m/s2 while the vibration amplitude in center frequencies of 1.25, 2, 3.15, 4 and 5 Hz were more than 0.4 m/s2 with the maximum peak value of 0.52 m/s2 at 5 Hz. At operator’s chest position (Fig. 5(e)), the vibration amplitude in frequencies greater than 50 Hz was less than 0.1 m/s2. At this position, the vibration amplitude in center frequencies of 1, 3.15, 4, 5 and 5 Hz were more than 0.4 m/s2 with the maximum peak value of 0.69 m/s2 at 4 Hz. At trailer seat position (Fig. 5f), the vibration amplitude for frequencies less than 3.15 Hz was less than 0.1 m/s2. At this position the maximum peak values were occurred at frequency of 40 with amplitudes of 2.75 m/s2 and at 31.5 Hz with amplitudes of 2.65 m/s2. There were also two other peaks at 80 and 315 Hz, respectively with amplitudes of 1.8 and 1.2 m/s2. The existence of vibration acceleration amplitude peaks at the center frequencies of 25, 31.5 and 40 Hz is related to variations of the power tiller engine rotational speeds in the range of 1400 to 2200 rpm.
Comparing the different parts of Fig. 5, revealed that the maximum and minimum vibration acceleration amplitudes are occurred at the handle and operator head positions, respectively. The power tiller engine vibration was transmitted to the tractor chassis and from the chassis to the power tiller handle as well as drawbar of the trailer seat to be pulled by the power tiller. The vibration magnitude at the handle position was not considerable for frequencies more than 1000 Hz, which was attributed to structural damping of the handle as well as free vibration of the handle end because the power tiller handle acts as a cantilever beam with base excitation and free end vibration [4]. The vibration amplitude at the trailer seat position was less than the handle of power tiller which was attributed to more structural damping during transmission of the power tiller engine vibration to the trailer seat. The vibration frequency at the seat position had a few components in the range of 1000 to 10000 Hz with the maximum amplitude of 0.5 m/s2 at 2500 Hz, which was attributed to the fact that there was not any visco-elastic damping at the trailer seat and it was just provide a metal surface. The amplitudes of vibration at operator’s arm, wrist, chest and head positions were less than the handle due to vibration damping effect of operator’s hand and body. The amplitudes of vibration at operator’s wrist and arm positions were more than the operator’s chest and head positions, which was attributed to more vibration energy entered to wrist and arm of operator from the tractor handle. The vibration frequency at the operator’s wrist, arm, chest and head positions (Fig. 5(a), (b), (d) and (f)) had amplitude in the range of 1 to 80 Hz because the greater frequencies were damped by operator’s body [2, 20].
As illustrated from different parts of Fig. 5, the vibration amplitude was reduced when vibration energy was transmitted within the operator’s body, for example at the center frequency of 31.5 Hz, the amount of reduction in acceleration value was 78 % (21 to 4.7 m/s2) form the tractor handle to operator’s wrist and 68 % (4.7 to 1.5 m/s2) from operator’s wrist to arm. At the center frequency of 16 Hz, the reduction values were 30 % (6 to 4.2 m/s2) and 3 % (4.2 to 4.1 m/s2), respectively form the tractor handle to operator’s wrist and wrist to arm. Different amount of reduction is related to the fact that the human body response to vibration is dependent on vibration frequency.
Fig. 5The maximum and minimum envelope curves of total un-weighted vibration (sum of three directions x, y, z), for different engine speeds and gear ratios at positions of: a) operator’s arm, b) operator’s wrist, c) power tiller handle grip, d) operator’s head, e) operator’s chest and f) trailer seat
3.2. Vibration transmitted from the power tiller to operator and exposure limits
3.2.1. Whole body vibration (WBV) transmitted from the trailer seat
Figure 6 shows the minimum and maximum envelope curves of total weighted vibration (sum of three directions , , ), at the seat position for different combinations of the engine speeds and gear ratios. Comparing the data extracted from this figure with the standard exposure limits (Table 2), revealed that the amount of vibration in frequency range of 3.15 to 6.3 Hz was varied from 0.3 to 0.4 m/s2, which was in the little uncomfortable range. The vibration amplitude for frequency range of 25 to 40 Hz was varied from 0.5 to 0.67 m/s2, which is in the almost uncomfortable range. The maximum amplitude of vibration at frequency range of 25 to 40 Hz could be attributed to frequencies corresponding to the power tiller engine in this frequency range, because the power tiller engine is a vertical single cylinder diesel engine, and generates unbalanced forces that lead to high levels of vibration.
The maximum and minimum envelope curves of weighted vibration for the vertical direction () at the seat position is shown in Fig. 7. As depicted from this Figure, the amount of vibration in frequency ranges of 3.15 to 6.3 and 25 to 40 Hz was more than the standard limit for 8-hour per day exposure for this power tiller. Sam and Kathirvel [16] reported that the vibration exposure limit was 8-hour per day for power tiller during pulling an empty trailer on the asphalt road and the exposure limit was 4-hour per day for power tiller during tilling operation.
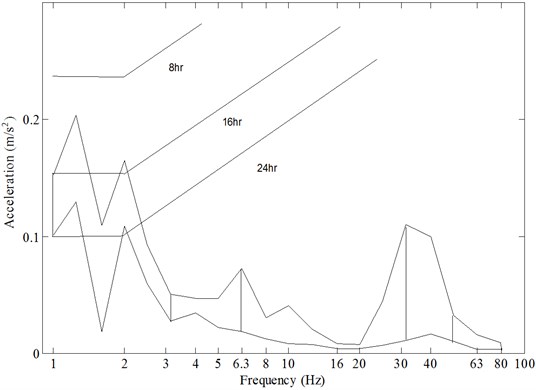
The amount of weighted vibration for the longitudinal direction () did not exceed the standard exposure limit for 8-hour working per day at any center frequency. The weighted vibration at this direction was varied in the range of 0.05 to 0.2 m/s2 and the maximum values were occurred at the frequencies less than 2.5 Hz (Fig. 8). For the lateral direction (), the amount of weighted vibration was less than 0.1 m/s2 at all frequencies. It could be due to vertical alignment of the power tiller engine. The combustion and moving parts inertia forces are transmitted to the engine block and then transmitted to the power tiller chassis as vibrations due to lack of isolators between the power tiller engine and chassis. Therefore, the vibration acceleration in the vertical direction was greater than the longitudinal and lateral directions. Also, the drawbar joint and its alignment was the reason for vibration transmissibility to the trailer seat. Other researchers who studied vibration characteristics of different types of power tillers with different engine powers reported that the vertical vibration was more than the other directions but for longitudinal and lateral directions, they reported different results [2, 15, 21].
Fig. 6The maximum and minimum envelope curves of total weighted vibration (sum of three directions x, y, z), at the seat position for different engine speeds and gear ratios
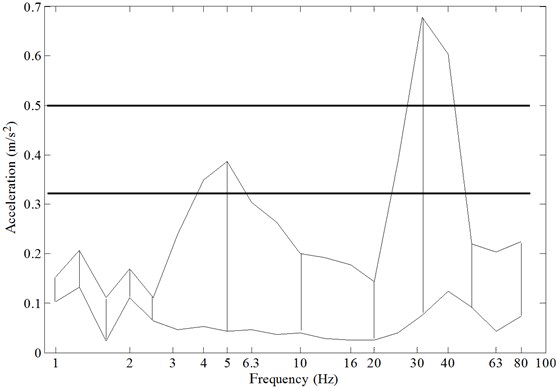
Fig. 7The maximum and minimum envelope curves of weighted vibration acceleration, vertical direction (z), at the seat position for different engine speeds and gear ratios
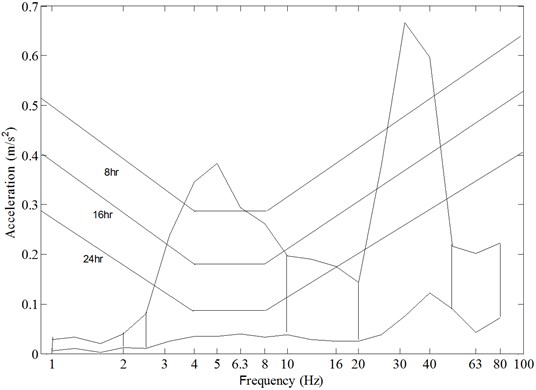
Fig. 8The maximum and minimum envelope curves of weighted vibration acceleration, longitudinal direction (x), at the seat position for different engine speeds and gear ratios
3.2.2. Hand-arm transmitted vibration (HTV) from the power tiller handle
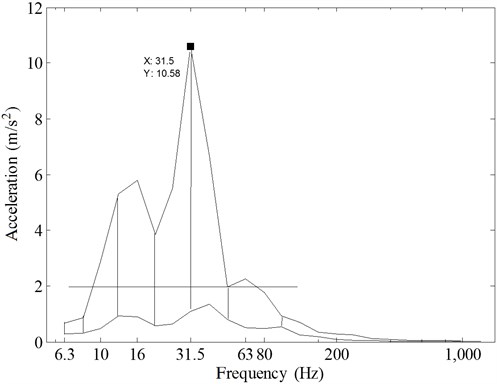
Figure 9 shows the minimum and maximum envelope curves of total weighted vibration (sum of three directions , , ), at the handle position for the different engine speeds and gear ratios. As it is evident from this Figure, the vibration acceleration value in frequency range of 8 to 80 Hz was more than the standard exposure limit for 8-hour working per day and the maximum value was occurred at 31.5 Hz (10.58 m/s2). In this study the power tiller engine speed was varied between 1400 to 2200 rpm, as a result the greater amplitude of vibration acceleration observed in the frequency range 25 to 40 Hz. At frequencies less than 10 Hz and more than 100 Hz, the amount of acceleration value was decreased considerably and the value was less than 1 m/s2. The reason for decreasing vibration amplitude for the mentioned ranges could be attributed to structural damping as well as free vibration of the handle end. The allowable exposure time for exposing hand-arm to the power tiller vibration for 8-hour working per day was in the range of 2.32 to 5.7 years for the different gear ratios and engine speeds. Therefore, after 2.32 years in 10 % of operators who are exposed to this power tiller handle vibrations, various diseases, disorders and fingers worn may occur. Researchers reported that the allowable exposure time was varied between 1.2 years for walking type power tiller at tillage operation to 12 years for power tiller during pulling an empty trailer [5, 15, 16].
Fig. 9The maximum and minimum envelope curves of total weighted vibration (sum of three directions x, y, z), at handle position for different engine speeds and gear ratios
4. Conclusions
The conclusions drawn from the present investigation are summarized as follows:
1. The maximum and minimum envelope curves of the power tiller vibration accelerations were used as suitable guidelines in order to evaluate the power tiller vibration.
2. Power tiller engine was recognized as the main source for vibrations because in all of the experiments, the vibration acceleration peak values were occurred in the range of frequencies corresponding to the engine rotational speed.
3. The maximum values of un-weighted vibration acceleration in 1/3rd spectra were at the frequency band with the center frequency of 31.5 Hz and then was observed in the center frequencies of 40, 25, 20, 16, 12.5, 6.3 and 5 Hz, respectively.
4. Evaluation of the seat vibration exposure (WBV) revealed that the allowable exposure time was less than 8-hour per day for vertical direction, but for the lateral and longitudinal directions was more than 8-hour. The amount of vibration in the frequency ranges from 3.15 to 6.3 and from 25 to 40 Hz exceeded the standard limits for comfortable operation.
5. Evaluation of the handle vibration exposure (HTV) revealed that the amount of vibration reached up to 11 m/s2 at the frequency of 31.5 Hz, and in the frequency ranges from 8 to 80 Hz was more than the standard limit for exposure of hand-arm to vibration. The allowable exposure time for exposing hand-arm to the power tiller vibration for 8-hour working per day was between 2.32 to 5.7 years for the different gear ratios and engine speeds.
6. It is necessary to reduce the vibrations transmitted to the user’s hand and body by designing and developing adequate insulating systems or isolators which could effectively reduce the amount of vibration in the frequency ranges from 8 to 80 Hz for HTV as well as from 3.15 to 6.3 Hz and 25 to 40 Hz for WBV.
References
-
Hassan-Beygi S. R. Investigating and Analyzing the Power Tiller Noise. Ph.D. Thesis, Tarbiat Modarres University, Tehran, Iran, 2004, (in Persian).
-
Dewangan K. N., Tewari V. K. Characteristics of hand transmitted vibration of a hand tractor used in three operational modes. International Journal of Industrial Ergonomics, Vol. 39, 2009, p. 239-245.
-
Mehta C. R., Shyam M., Paratap S., Verma R. N. Ride vibration on tractor implements system. Applied Ergonomics, Vol. 31, 2000, p. 323-328.
-
Salokhe V. M., Majumder B., Islam M. S. Vibration characteristics of a power tiller. Journal of Terramechanics, Vol. 32, 1995, p. 181-196.
-
Tewari V. K., Dewangan K. N., Subrata K. Operator’s fatigue in field operation of hand tractors. Biosystems Engineering, Vol. 89, 2004, p. 1-11.
-
Tiwari P. S., Gite L. P. Physiological responses during operation of a rotary power tiller. Biosystems Engineering, Vol. 82, 2002, p. 161-168.
-
ISO 5349. Mechanical Vibration – Guidelines for the Measurement and the Assessment of Human Exposure to Hand Transmitted Vibration. ISO International Standard, 2001.
-
ISO 2631. Mechanical Vibration and Shock Evaluation of Human Exposure to Whole-Body Vibration. ISO International Standard, 1997.
-
Qunying J., Qianhua W., Kuifu C., Daxing Z. The excitations and characteristics of the vibration of walking tractors handle using isolators. Transactions of the Chinese Society of Agricultural Machinery, Vol. 24, Issue 4, 1993, p. 74-79.
-
Futatsuka M., Maeda S., Inaoka T., Nagano M., Shono M., Miyakita T. Whole body vibration and health effects in the agricultural machinery drivers. Industrial Health, Vol. 36, 1998, p. 127-132.
-
Rubin C., Pope M., Fritton J. C., Magnusson M., Hansson T., Mc Leod K. Transmissibility of 15-Hertz to 35-Hertz vibrations to the human hip and lumbar spine: determining the physiologic feasibility of delivering low-level anabolic mechanical stimuli to skeletal regions at greatest risk of fracture because of osteoporosis. Spine, Vol. 28, 2003, p. 2621-2627.
-
Yang L., Gong H., Zhang M. Transmissibility of whole body vibration stimuli through human body in different standing postures. Journal of Mechanics in Medicine and Biology, Vol. 12, 2012, p. 12-25.
-
Kiiski J., Heinonen A., Järvinen T. L., Kannus P., Sievänen H. Transmission of vertical whole body vibration to the human body. Journal of Bone and Mineral Research, Vol. 23, 2008, p. 1318-1325.
-
Zheng G., Qiu Y., Griffin M. J. Vertical and dual-axis vibration of the seated human body: nonlinearity, cross-axis coupling, and associations between resonances in transmissibility and apparent mass. Journal of Sound and Vibration, Vol. 331, 2012, p. 5880-5894.
-
Taghizadeh-Alisaraei A. Experimental Investigation of a Power Tiller Vibration. M. Sc. Thesis, Tarbiat Modarres University, Tehran, Iran, 2007, (in Persian).
-
Sam B., Kathirvel K. Vibration characteristics of walking and riding type power tillers. Biosystems Engineering, Vol. 95, 2006, p. 517-528.
-
Hassan-Beygi S. R., Ghobadian B. Determination the maximum and minimum envelope curves of 1/3rd octave sound pressure level of a power tiller on transportation conditions. Third National Conference on Agricultural Machinery and Mechanization, 1-2 Sep., 2004, Kerman, Iran, (in Persian).
-
ISO 8041-E. Human Response to Vibration – Measuring Instrumentation. ISO International Standard, 2005.
-
Crocker M. J. Handbook of Acoustics. First Edition, John Wiley & Sons, New York, 1998.
-
Ahmadian H., Hassan-Beygi S. R., Ghobadian B. Ergonomic Characteristic of a Power Tiller Vibration on Transportation Mode. ISAV, 2012, Tehran, Iran.
-
Goglia V., Gospodaric Z., Filipovic D., Djukic I. Influence on operator's health of hand-transmitted vibrations from handles of a single-axle tractor. Annals of Agricultural Environment Medicine, Vol. 13, 2006, p. 33-38.
About this article

The authors would like to express their appreciation to University of Tehran and Tarbiat Modarres University for full support to carry out this research work.
