Abstract
This paper aims to propose an iterative mathematical morphology (IMM) filter methodology to de-noise the acoustic emission (AE) signal with impulsive noise. To develop the principle of IMM filter, a simulation signal is used to be de-noised by the conventional MM filter. Moreover, a novel approach is introduced to eliminate the end effect of MM filter by connecting the initial point with the end point of the time series. Therefore, the IMM filter can be realized based on the operations of MM filter and the elimination method of end effect. The noise elimination of a simulation signal indicates that the IMM filter can remove the impulsive noise more effectively than the MM filter and maintain useful information as much as possible. Two AE signals acquired from rock compression experiment, which are polluted by electromagnetic impulsive noise, are de-noised by the IMM filter, the conventional digital filter and the wavelet filter respectively. Compared with the other two methods, the IMM filter can preserve the essential information contained in AE signal better, especially the arrival time. These two experiments manifest the effectiveness of the IMM filter in de-noising issues of AE signals polluted by impulsive noise.
1. Introduction
Acoustic emission (AE) is defined as transient elastic waves generated from a rapid release of strain energy caused by a deformation or damage within a material [1], or generated by the interaction of two surfaces in relative motion [2]. Conventionally AE has been employed to detect structure crack, material characteristics and liquid or gas leakage [3], but currently it is being advanced to apply to many fields, such as to diagnose faults in rotating machinery [4-5], to monitor complex machining processes [6], to localize large structural impact [7] and to advance medical technology [8]. Among the applications, AE technique (AET) is mainly used as a non-destructive testing tool to evaluate structural damage [9, 10], since AE signals usually arise from internal changes of a structure like crack growth dislocation movement in materials [11]. AET is unlike most other nondestructive testing (NDT) techniques in two regards: (1) instead of supplying energy to the object under examination, AET simply listens for the energy released by the object; (2) AET deals with dynamic processes or changes in a material. So the benefits of AET include the ability to directly detect crack/damage extension by distinguishing active cracks/damage from stable cracks/damage and operation in a passive or listening mode with low power requirements [12].
The main drawback with the application of the AET is the pollution of the signal so that the de-nosing of AE must be implemented before AE parameters extraction. When the AE waves arrive at the structure surface, they cause a mechanical disturbance and can be captured by the AE sensors. In a typical AE test the sensor mounted on the structure converts the surface motion into an electronic signal that can be recorded and then be processed later. The AE signals are polluted by the noises along the propagation path of the wave before they are collected. There are two main sources of the AE noise: environmental noise and internal noise. The environmental noise emanates from external factors, such as load train, electrical instrumentation and other unknown sources generated outside the test materials. The internal noise originates from reflected and retracted waves, such as direct flexural waves and extension waves in plate-like structure.
Noise often affects the reliability of AE parameters and the locating accuracy of AET as well. To compensate for the influence of background noise, various procedures are implemented during the AE test. For example, taking precautions to place sensors as far away as possible from noise sources, or/and filtering. But the experiment environment may be noisy, which makes the noise reduction difficult [13]. The de-noising of AE signals has been investigated by different signal processing methods in many literatures. Feng [14] studied the threshold methods based on the discrete wavelet transform, which was verified to be suitable for AE signals to detect bearing defect of rotating machines. Chen [15] proposed an EMR signal morphological filter to restrain the random noise which distributed uniformly and white Gaussian noise mixed in electromagnetic radiation signal. Chen [16] also de-noised the AE signals of the fluidized bed through a sym8 wavelet filter combined with the rigrsure threshold method before extracting AE parameters. Zvokelj [17] presented a signal de-noising method, combined the abilities of the kernel principal component analysis (KPCA) with the benefits of ensemble empirical mode decomposition (EEMD) to pre-process vibration and AE signals. Chiementin [3] investigated the effectiveness of various de-noising techniques in improving sensitivity to early defect detection. The research results indicated that the de-noising methods, especially the self-adaptive noise cancellation method, could offer significant improvements in identifying defects with AE.
Recently various de-noising techniques have been applied to process AE data which mixed with random noise, such as the conventional digital filter technique and the wavelet transform (WT), etc. And these de-noising methods are effective. Since the random noises usually have higher frequency and lower energy than the useful signals, the noises and the signals can be easily separated by setting a threshold [18]. However, the tested AE signals may be polluted by some impulsive, such as the strong electromagnetic noise. In order to obtain the important AE parameters such as accurate first arrival time, manual selection is necessary. But sometimes manual operations are time-consuming and subjective, because the number of recorded AE signals can be up to several thousands during one test [19]. The impulsive noise, just like the typical transient AE signal, has a wide frequency range. It is more difficult to reduce the impulsive noise by the de-noising technologies as mentioned above since in the AE signal remain the intrinsic characteristics, such as no distinct malformation or/and time delay. Some scholars have developed tools to extract the impulsive features from the test signals by introducing the mathematical morphology (MM) filter [20-22]. It has unique advantages as follows: 1) simple algorithm and high efficiency, which is adapted to handle the AE signal with high sampling frequency; 2) it is a zero-phase filter that can remain in the accuracy of arrival time of AE signal.
In this article a novel IMM filter based on the MM theory is proposed to de-noise impulsive noise effectively and retain the real AE signal parameters satisfactorily. Compared with some conventional method, such as digital filter and WT, this proposed de-noising approach is more powerful for processing AE signals. The rest of this paper is organized as follows. In section 2, the principle of MM filter is simply introduced. Then section 3 presents the IMM filter scheme and it is verified by processing a simulation signal. Moreover, the AE signals obtained from two different tests are employed to evaluate the IMM technique by being compared with the WT and digital filter respectively in section 4. Last, the conclusions of this investigation are summarized in section 5.
2. Principle of MM filter
The MM filter has been developed and widely applied to various fields of image processing and analysis as a typical nonlinear filter. Piles of literatures indicate that the research of MM filter analysis in one-dimensional (1-D) signals is advanced, especially in machine fault diagnosis [20] and power-quality monitoring [21]. Theoretically the basic idea of MM filter is to investigate the relationship between parts of signal and extract the main features of signal, by using a “probe” structural element in the signal in a continuous movement [23].
In binary morphological transformation the most common operations are dilation, erosion, opening and closing. When extended to the function field, the binary morphological transformation becomes a gray-scale transformation [23]. By assuming a 1-D original signal , the corresponding dilation and erosion morphology process is expressed as follows:
where denotes the operator of erosion and denotes the operator of dilation. The length of the signal is and . The structure element is , .
The dilation operation increases the valleys and enlarges the maxima of the function, while the erosion operation reduces the peaks but enlarges the minima of the function. With erosion and dilation, two important morphology operators, opening and closing operations, are defined as below:
where denotes the operator of opening operation and denotes the closing operation.
When a signal is corrupted by impulses, very large positive or negative values of short duration, the impulsive noises in signals can be suppressed effectively through the opening and closing operations. The peak noise above signal is filtered out through the opening operation, and the burr and the litter bridge structure in the signal is also removed. Moreover, the closing operation is able to smooth or inhibit the trough noise behind signal by filing up the valleys. Because these two operators smooth different portions of the signals, they are always combined together, usually in the form of a cascade.
The MM filter is an effective means for de-noising, which can construct many different filters just by a few simple basic operations. Since those complicated operations like multiplication and division are not involved in MM, the time and space needed for MM operation is very small. All those four morphological operators mentioned above can be applied to extract the morphological features of signals. However some scholars verified that different operators could extract different morphological features, such as Zhang [24]. In engineering applications the four basic operators often fail to achieve satisfactory results. Therefore it is necessary to modify the algorithm based on the four basic operators mentioned above according to the analyzed objects.
3. Elimination of AE impulsive noise based on IMM filter
3.1. Elimination of AE impulsive noise based on conventional MM filter
MM filter is widely used in the noise reduction. The common morphology de-noising scheme is defined as Fig. 1 [25, 26].
A simulation AE signal , which consist of meaningful signal and impulsive noise , is adopted as the de-noised object:
The conventional noise reduction method can effectively reduce the magnitude of the impulsive noise. is the simulation AE signal; is a cycle sinusoidal modulated Gaussian pulse, which is used to simulate the electromagnetic noise. The time-domain waveform of is shown in Fig. 2(a).
Fig. 1Scheme of the conventional MM filter
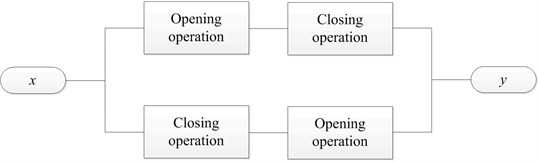
Fig. 2Signals filtered by conventional MM filter: a) time-domain waveform of x(t), b) filtered signal when the length of structural element is 5, c) filtered signal when the length of structural element is 9
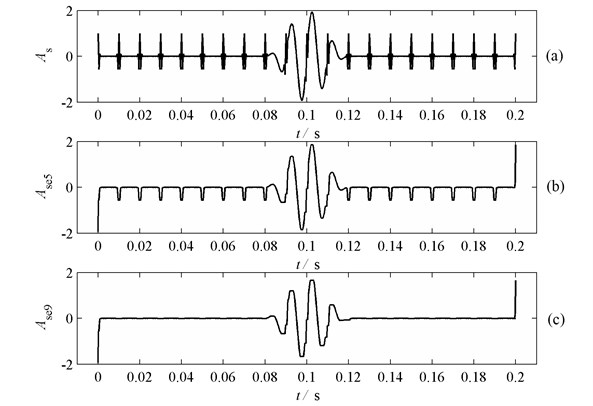
The structural element is used to eliminate the impulsive noise . A series of experiments indicate that it is difficult to eliminate the influence of the Gaussian pulse for the conventional de-noising method, unless the length of the structural element is larger than or equal to the width of Gaussian pulse, which is shown in Fig. 2(b). When the length of structural element is 9, the can be effectively eliminated. But a large distortion to the waveform of will be generated when the length of the structural element is long, as shown in Fig. 2(c). The width of the real electromagnetic pulse noise may be wide, causing great influence on the extraction of AE characteristic parameters subsequently. Moreover, from Fig. 2(b) and Fig. 2(c) it can be found that due to the end effect of the MM filter it is easy to generate oscillation at the endpoint of the signal after the noise elimination since lack of data points. The end effect also causes strong influence on the extraction of AE characteristic parameters.
3.2. Elimination of end effect
Since the length of structural element is a constant, the boundary or endpoint cannot be located in the center of the probe. Therefore the end effect is generated because of the incomplete corrosion or dilation. The signals filtered by the conventional MM filter in Fig. 2(b) and Fig. 2(c) describe the serious end effect obviously. To eliminate the end effect, this paper presents a novel treatment. The authors think that when the time history of the data is infinite, the end effect will vanish. Therefore before morphological filtering we can connect the starting element with the endpoint of the data and then conduct morphological filtering. When the filtering work is finished, the connection is broken up.
The detailed operation is conducted as follows. Firstly a part of data selected from the end of the series is added in the front of the series. The length of this data set is the same as that of the structural element. What’s more, a part of data with the same length of structural element is chosen from the beginning of the series and then put at the end of the series. For example before the morphological filter schedule, the time series with the length of , , is transformed as a new time series is the length of structural element used in processing, which is far less than . After filtering it’s necessary to delete the data with the length of from the beginning and the end of the new time series.
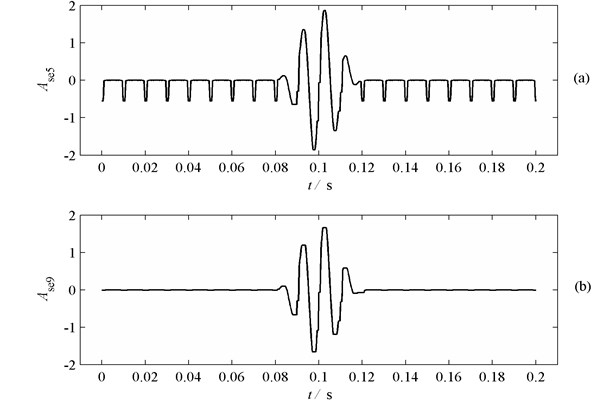
The simulated AE signal in section 3.1 is de-noised by using the novel approach to verify the elimination of end effect. Fig. 3(a) and Fig. 3(b) display the waveforms of the filtered signal when the length of structural element is 5 and 9 respectively. It can be clearly seen that the end effect is eliminated completely, which manifests the effectiveness of the proposed method.
Fig. 3Elimination of end effect: a) filtered signal when the length of structural element is 5, b) filtered signal when the length of structural element is 9
3.3. IMM filter
For the MM filter the opening operation eliminates the positive pulse, while the closing operation removes the negative pulse. Therefore an IMM filter method is proposed based on the combination of the opening operation and closing operation. At the beginning the noise reduction is conducted by the opening operation and closing operation respectively, and then the results are added and averaged. The whole process is shown in Fig. 4.
The de-nosing process can be briefly summarized as follows.
Step 1, conduct the elimination of the end effect based on the methodology proposed in section 3.2.
Step 2, assign the structural element with appropriate length according to the width of impulsive noise.
Step 3, carry out the opening operation and closing operation respectively.
Step 4, average the de-noising results of the two operations in step 3.
Step 5, check whether the de-noising results are meeting the requirements or not. If satisfied, to finish the iteration; otherwise, to return to the origin.
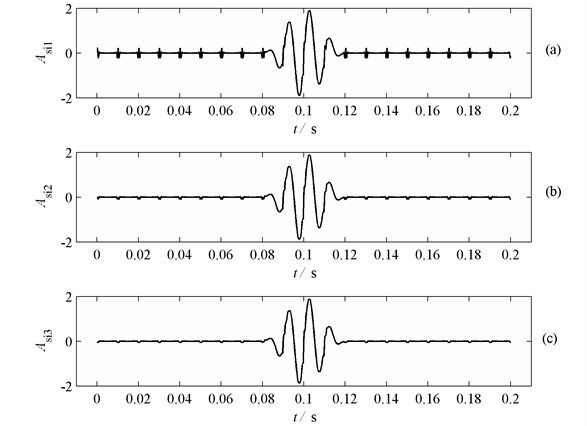
In order to test the performance of this proposed method, a simulation signal with pulse noise is used. The length of structural element is 5. Fig. 5 shows the de-noising process of the simulation signal with three iterations. Fig. 5(a), Fig. 5(b) and Fig. 5(c) present the de-noising results of the first three iterations respectively. From the noise de-noising results it can be found that although the length of structural element is short, a good noise-reduction result is obtained. Therefore the corrosion effect to the useful signal can be reduced. Moreover, the decrease of the maximum amplitude of the noise is obvious. When the third iteration is completed, the amplitude of the noise is much lower than that of the first iteration. Therefore the IMM filter can be well used for noise reduction of AE signal.
Fig. 4Flowchart of the IMM filter
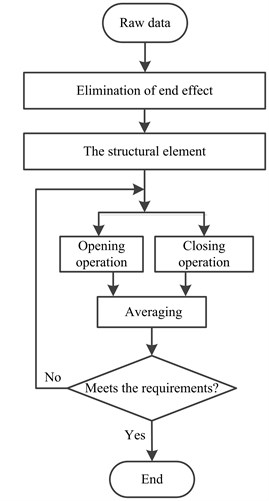
Fig. 5De-noising result of the simulation signal after three iterations when the length of structural element is 5: a) filtered signal after the first iteration, b) filtered signal after the second iteration, c) filtered signal after the third iteration
4. Test verification
4.1. Experiments
In this section the real AE signal is used to verify the function of the proposed IMM. The real AE signal is recorded during a rock compression experiment. The loading equipment is a universal electronic-test machine of type WDW-600E, which is provided by Jinan Time-Test Instrument Co., Ltd. Signals are recorded by full-waveform acoustic emission apparatus of type Ds2, provided by Beijing Softland Technology Co., Ltd. Fig. 6 shows the experimental setup.
The AE signals in time domain are displayed in Fig. 7. Fig. 7(a) is the overall view of the waveforms. The -coordinate and -coordinate stand for the time and voltage respectively, and the corresponding units are ms and mV. The sampling frequency is 3 MHz. The whole length of the signal is 133.28 s. To see more clearly about the detailed information of the AE signals, a small section of the signals marked by the black rectangle frame in Fig. 7(a) is selected and zoomed out. It is shown in Fig. 7(b) that the time of the selected signal starts at 89.05 s and the whole length of the signal is 8.71 ms. It is very obvious that the electromagnetic pulse noise with large amplitude is contained in the raw AE signals.
There are some reasons that can be taken to explain the phenomenon of the electromagnetic pulse noise. The housing of AE transducer is generally made of stainless steel and it plays an important role on the magnetic shield besides protecting the internal components. But the electromagnetic effect is very strong, the magnetic shielding function is failed. Therefore the electromagnetic pulse noise will be generated in the obtained AE signals, which brings difficulties to the analysis. Thus it is necessary to conduct the noise reduction.
4.2. AE signal with high signal-noise ratio
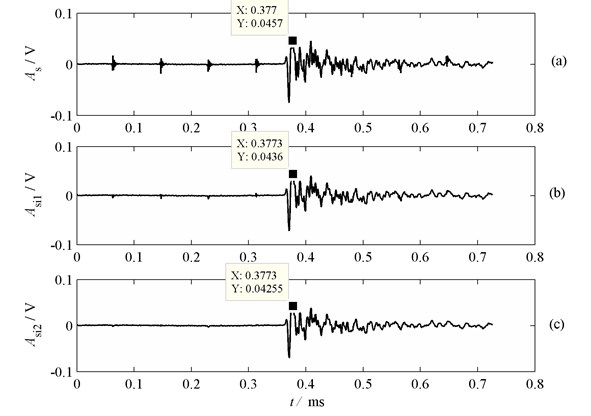
To test the de-noising effect of the IMM, a small section of the recorded AE signals displayed in Fig. 7(b) is chosen, which is shown in Fig. 8(a). The -coordinate and -coordinate stand for the time and voltage respectively, and the corresponding units are ms and V. From the waveform of the raw AE signal presented in Fig. 8(a) it can be seen clearly that the amplitude of the AE signal is relatively large. The electromagnetic impulsive noise occurs in a certain frequency region and its amplitude is about 20 mV, which seriously interferes with the parameter analysis of the AE characteristics. With the proposed IMM filter the multiple iterative filtering is conducted with two iterations. The time-domain waveforms of the AE signals after the first and the second iteration are shown in Fig. 8(b) and in Fig. 8(c) respectively. Actually it can be seen from the waveforms in Fig. 8(a) and Fig. 8(b) that the noise level is decreased a lot, although there is still some noise residue contained in the AE signal after the first iteration. However, when the second iteration is completed, the pulse noise is substantially eliminated, as shown in Fig. 8(c).
In addition, the useful characteristics of AE signal are mainly retained, such as the arrival time information noted in Fig. 8. The arrival time of the maximum points in the raw AE signal is 0.377 ms, while that of the AE signal after the first iteration and the second iteration are all 0.3773 ms. Therefore there is nearly no influence on the arrival time information of AE signal caused by the IMM filter.
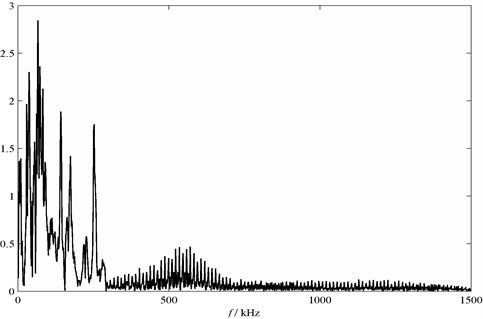
To test the de-noising performance of the IMM filter comprehensively, the conventional digital filter and wavelet filter are applied. The digital filter used in this paper is designed by the window function method, where the Blackman window is introduced to design the lowpass FIR digital filter with 101th order. The spectrum of the AE signal is shown in Fig. 9. The pulse noise component can be roughly distinguished through the spectrum result. The frequencies of the impulsive noise are larger than 250 kHz, so that this filter is designed as a low pass filter with the frequency region of 0~250 kHz. Fig. 10(b) shows the time-domain waveform of the obtained signal passing through this digital filter. It can be found that the digital filter introduces a significant delay (0.377 ms to 0.392 ms) of the arrival time of the maximum point although the pulse noise is eliminated. This change of the AE signal has a great influence on the extraction of the AE characteristic parameters and the accuracy of AE source location. What’s more, a wavelet filter based on minimax principle is introduced. The mother wavelet is sym8, which was used to filter AE signals [16]. Fig. 10(c) shows the filtering result of the initial AE signal. It can be clearly seen that the pulse noise is eliminated, but the arrival time of the maximum point moves forward a little bit (0.377 ms to 0.3753 ms).
Fig. 6Rock compression experiment: a) experimental setup, b) AE sensors arrangement, c) after the destruction of the rock
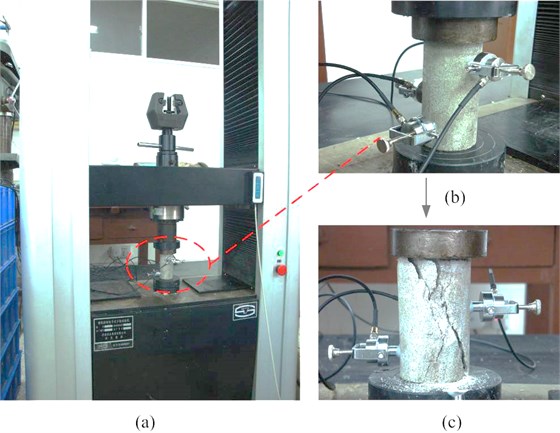
Fig. 7Waveforms of the AE signal: a) overall view of the tested AE signal with electromagnetic noise, b) AE signal after zooming
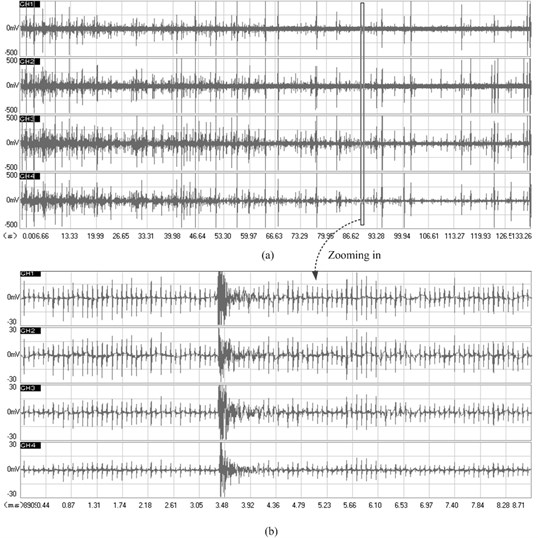
Fig. 8Waveforms of the AE signal with the proposed method: a) original AE signal with electromagnetic noise, b) AE signal after the first iteration, c) AE signal after the second iteration
Taking these two de-noising operations into consideration, it can be concluded that although the conventional digital filter and the wavelet filter can eliminate the pulse noise, some important information contained in AE signal is changed. When the arrival time of the maximum point is changed, the arrival time information of AE signal is also changed. The arrival time is the most important parameter which is predominantly used for source location of TDOA [27, 28]. The ability to locate the AE source is a vital step in the whole damage identification process, by which the accurate source location can indicate the characteristics of the damage and even the size of the crack. Currently the localization of AE sources is normally performed by using the time difference of arrival (TDOA) technique, which depends on the propagation velocity in material, to derive the source location in one, two or three dimensions from the arrival delay between sensors based on first threshold crossing. Therefore this improved method can preserve the arrival time information better, compared with the conventional digital filter, wavelet and other noise reduction methods. It also causes little influence on the AE source localization.
Fig. 9Spectrum of AE signal
4.3. AE signal with low signal-noise ratio
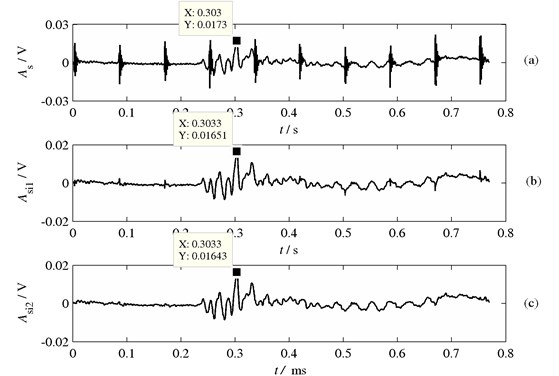
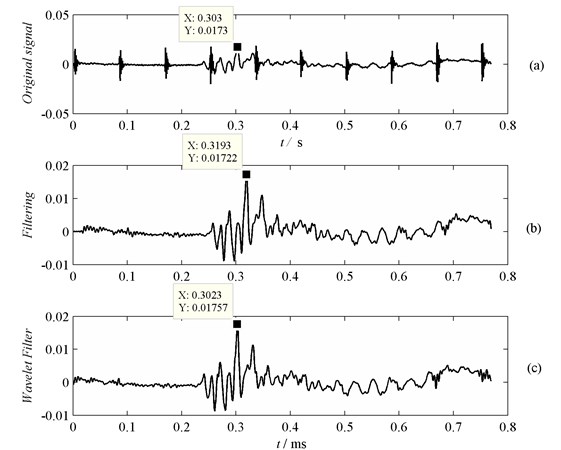
In this section the AE signal with low amplitude is used to test the effect of the proposed method. Fig. 11(a) displays the waveforms of the AE signal with the IMM filter. It is obvious that the amplitude of the AE signal is too small to be distinguished from the noise pulse. Apparently the noise reduction should be carried out first. With the IMM filter the multiple iterative filtering is conducted with two iteration operations. The time-domain waveforms of the AE signals after the first and the second iterations are shown in Fig. 11(b) and Fig. 11(c) respectively. From Fig. 11 it can be found that there is still some noise residue in AE signal after the first iteration, while the noise pulse can be substantially eliminated after two iterations. The arrival time of the maximum point in the raw AE signal is 0.303 ms, while that of the AE signal after the first iteration and the second iteration are both 0.3033 ms. Therefore there is nearly no influence on the arrival time information of AE signal caused by the IMM filter. The useful characteristics of AE signal are mainly retained. The conventional digital filter and wavelet filter are applied to de-noise the AE signal. The spectrum of the initial AE signal is shown in Fig. 12. The pulse noise can be roughly distinguished from the spectrum result, whose frequencies are larger than 200 kHz.
Fig. 10Influence of different de-noising methods on the arrival time information of AE signal: a) original AE signal with electromagnetic noise, b) AE signal filtered by lowpass FIR digital filter, c) AE signal filtered by wavelet
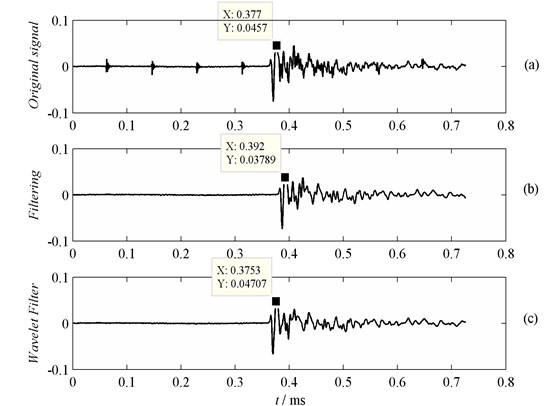
Fig. 11Waveforms of the AE signal with the proposed method: a) original AE signal with electromagnetic noise, b) AE signal after the first iteration, c) AE signal after the second iteration
Therefore the filter is used as a low pass filter with the frequency region of 0~200 kHz. Fig. 13(b) shows the time-domain waveform of the obtained signal through this digital filter. It can be found that the digital filter brings a significant delay (0.303 ms to 0.3193 ms) of the arrival time of the maximum point although the pulse noise is eliminated. This change of the AE signal will have a great influence on the extraction of the AE characteristic parameters and AE source location. What’s more, a wavelet filter based on minimax principle is introduced. The mother wavelet is sym8. Fig. 13(c) is the time-domain waveform of the signal filtered by wavelet based on minimax principle. It can be found that the pulse noise is eliminated, but the arrival time of the maximum point moves forward a little bit (0.303 ms to 0.3023 ms). Therefore it also indicates that this method can preserve the arrival time information better than filtering, wavelet and other noise reduction methods.
Fig. 12Spectrum of AE signal
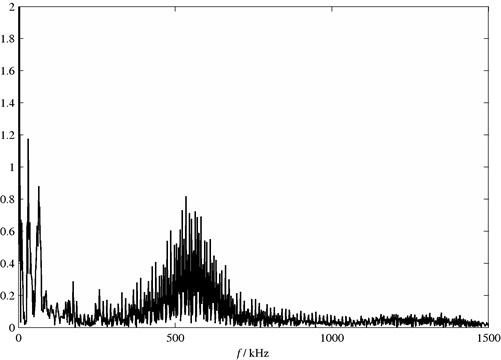
Fig. 13Influence of different de-noising methods on the arrival time information of AE signal: a) original AE signal with electromagnetic noise, b) the AE signal filtered by lowpass FIR digital filter, c) the AE signal filtered by wavelet
5. Conclusions
An IMM filter methodology is presented to solve the noise reduction problem of AE signal with impulsive noise. To verify the effect of the IMM filter, the narrow-band filter and wavelet filter are introduced to compare the de-noising effect. Some conclusions based on the analysis of the noise reduction results are drawn as follows:
(1) Due to the boundary effect of MM filter and the lack of data in the end part, it is easy to generate oscillation at the endpoint of the signal after the noise elimination. These drawbacks also cause serious effect on the follow-up feature extraction of AE characteristic parameters. This paper presents the idea that a part of data is selected from the end section of the signal to be added in the front of the series. The length of the selected data section is the same as the structural element. Also a data section with the length of structural element is selected from the beginning of the raw signal and then added behind the series. Therefore the data series is changed as a ring-shaped one to eliminate the end effect.
(2) AET is probably the most sensitive non-destructive technique since lots of the damage information is contained in the AE signal. The proposed IMM filter can effectively reduce the impulsive noise by structural element with short length. Moreover, the useful information contained in AE signal can be preserved very well.
(3) The ability to locate the AE source is a vital step in the whole damage identification process. The accurate source location can indicate the characteristic of the damage and even the size of the crack. Compared with conventional digital filter, wavelet filter and other noise reduction methods, this proposed IMM method can preserve the arrival time information better, which is predominantly used for AE source location by using the TDOA technique.
References
-
Omkar S. N., Raghavendra K. U. Rule extraction for classification of acoustic emission signals using ant colony optimization. Engineering Applications of Artificial Intelligence, Vol. 21, Issue 8, 2009, p. 1381-1388.
-
Al-Ghamd A. M., Mba D. A comparative experimental study on the use of acoustic emission and vibration analysis for bearing defect identification and estimation of defect size. Mechanical Systems and Signal Processing, Vol. 20, Issue 7, 2009, p. 1537-1571.
-
Chiementin X., Mba D., Charnley B., et al. Effect of the denoising on acoustic emission signals. Journal of Vibration and Acoustics – Transactions of the ASME, Vol. 132, Issue 3, 2009, p. 031009.
-
Mba D., Raj B. K., Rao N. Development of acoustic emission technology for condition monitoring and diagnosis of rotating machines, bearings, pumps, gearboxes, engines and rotating structures. Shock and Vibration Digest, Vol. 38, Issue 1, 2006, p. 3-16.
-
He Y., Zhang X. Approximate entropy analysis of the acoustic emission from defects in rolling element bearings. Journal of Vibration and Acoustics – Transactions of the ASME, Vol. 134, Issue 6, 2006, p. 061012.
-
Marinescu I., Axinte D. A time-frequency acoustic emission-based monitoring technique to identify workpiece surface malfunctions in milling with multiple teeth cutting simultaneously. International Journal of Machine Tools and Manufacture, Vol. 49, Issue 1, 2009, p. 53-65.
-
Liang D., Yuan S. F., Qiu L., et al. Large structural impact localization based on multi-agent system. Journal of Vibroengineering, Vol. 14, Issue 4, 2012, p. 1638-1655.
-
Samuel S., Cooper M. A., Bull J. L. An ex vivo study of the correlation between acoustic emission and microvascular damage. Ultrasound in Medicine & Biology, Vol. 35, Issue 9, 2009, p. 1574-1586.
-
Papamichos E., Tronvoll J., Skjærstein A., et al. Hole stability of red wildmoor sandstone under anisotropic stresses and sand production criterion. Journal of Petroleum Science and Engineering, Vol. 72, Issue 1-2, 2010, p. 78-92.
-
Hensman J., Mills R., Pierce S. G., et al. Locating acoustic emission sources in complex structures using Gaussian processes. Mechanical Systems and Signal Processing, Vol. 24, Issue 1, 2010, p. 211-223.
-
Kundu T., Das S., Martin S. A., et al. Locating point of impact in anisotropic fiber reinforced composite plates. Ultrasonics, Vol. 48, Issue 3, 2008, p. 193-201.
-
Miller R. K., Kill E. V., Moore P. O. Acoustic Emmision Testing (Nondestructive Testing Handbook). Columbus, OH: American Society for Nondestructive Testing, Issue 6, 2005, p. 446.
-
Naus D. J. Inspection of Nuclear Power Plant Structures – Overview of Methods and Related Applications. ORNL/TM-2007/191, 2007, p. 45.
-
Feng Y., Thanagasundram S., Schlindwein F. S. Discrete wavelet-based thresholding study on acoustic emission signals to detect bearing defect on a rotating machine. ICSV13, Vienna, Austria, 2006.
-
Chen S., Wang E. Electromagnetic radiation signals of coal or rock denoising based on morphological filter. Procedia Engineering, Vol. 26, 2011, p. 588-594.
-
Chen X., Chen D. Measuring average particle size for fluidized bed reactors by employing acoustic emission signals and neural networks. Chemical Engineering & Technology, Vol. 31, Issue 1, 2008, p. 95-102.
-
Zvokelj M., Zupan S., Prebil I. Non-linear multivariate and multiscale monitoring and signal denoising strategy using kernel principal component analysis combined with ensemble empirical mode decomposition method. Mechanical Systems and Signal Processing, Vol. 25, Issue 7, 2011, p. 2631-2653.
-
Park C., Tang J., Ding Y. Aggressive data reduction for damage detection in structural health monitoring. Structural Health Monitoring, Vol. 9, Issue 1, 2010, p. 59-74.
-
Sedlak P., Hirose Y., Khan S. A., et al. New automatic localization technique of acoustic emission signals in thin metal plates. Ultrasonics, Vol. 49, Issue 2, 2009, p. 254-262.
-
Hao R., Chu F. Morphological undecimated wavelet decomposition for fault diagnostics of rolling element bearings. Journal of Sound and Vibration, Vol. 320, Issue 4-5, 2009, p. 1164-1177.
-
Ouyang S., Wang J. A new morphology method for enhancing power quality monitoring system. International Journal of Electrical Power & Energy Systems, Vol. 29, Issue 2, 2007, p. 121-128.
-
Wang J., Zhang Q., Xu G. Extraction of operation characteristics in mechanical systems using genetic morphological filter. Journal of Vibroengineering, Vol. 15, Issue 1, 2013, p. 185-195.
-
Hua O., Bu L., Yang Z. Voltage sag detection based on DQ transform and mathematical morphology filter. Procedia Engineering, Vol. 23, 2011, p. 775-779.
-
Zhang L., Xu J., Yang J. Multiscale morphology analysis and its application to fault diagnosis. Mechanical Systems and Signal Processing, Vol. 22, Issue 3, 2008, p. 597-610.
-
Song J., Delp E. A study of the generalized morphological filter. Circuits, Systems and Signal Processing, Vol. 11, Issue 1, 1992, p. 229-252.
-
Chen S., Wang E. Electromagnetic radiation signals of coal or rock denoising based on morphological filter. Procedia Engineering, Vol. 26, 2001, p. 588-594.
-
He T., Pan Q., Liu X., et al. Near-field beamforming analysis for acoustic emission source localization. Ultrasonics, Vol. 52, Issue 5, 2012, p. 587-592.
-
Sedlak P., Yuichiro H., Manabu E. Acoustic emission localization in thin multi-layer plates using first-arrival determination. Mechanical Systems and Signal Processing, Vol. 36, Issue 2, 2013, p. 636-649.
About this article

This work was finically supported by the National Science Foundation of China (Grant No. 51105018), Aeronautical Science Foundation of China (Grant No. 2011ZB51039) and the Innovation Foundation of BUAA for Ph. D. Graduates.
