Abstract
The classical time domain and frequency domain methods of damping identification are not be suitable to the structures with nonlinear stiffness. Therefore, on the basis of modifying the classical half-power bandwidth method, this study presented a method to identify the damping of nonlinear stiffness structure. Based on the movement equation of structure, the identifying damping formulas were derived respectively for the structure with weak and strong stiffness nonlinearity. Furthermore, the correctness of the proposed formulas was verified with a numerical simulation example. Then, the test damping procedure was proposed for the above mentioned nonlinear stiffness system. At last, this procedure has been demonstrated using a hard coating specimen with soft nonlinearity and the damping parameters of structure were obtained under different exciting levels.
1. Introduction
The damping parameters not only can be used to create the model of structural dynamics, but also to evaluate and verify the effect of vibration reduction. So the damping measurement is very important in the structure dynamics and become more essential with the wide application of the damping technology [1-2].
There are a large number of mechanical structures, whose natural frequency will vary with the exciting levels and the frequency response function of these structures will not be symmetric about the resonant frequency. These structures can be named as the nonlinear stiffness structure, such as the bolted joint structure [3], the linear guideway system [4], the bonded single lap-joints structure in vehicle bodies [5] and some composite laminated plate structure [6], etc. For these nonlinear stiffness structures, the classical time and frequency domain methods will not be suitable for identifying damping, because these methods assume a linear energy dissipation mechanism and a constant resonant frequency. For the half-power bandwidth method, it also cannot be applied because the nonlinear jump phenomenon in the frequency response function can lead to erroneous observations of bandwidth frequencies. Thus, a new method should be proposed to identify the damping of the nonlinear stiffness structures.
Some researchers have paid considerable attention to this problem and presented the modified time domain method to identify the damping of nonlinear stiffness structures. Reed [7] offered a method based upon further processing of the free decay response. The free decay response signal was divided into several segments and each signal segment includes a certain amount of oscillation peaks. Then, the damping ratio and the system stiffness corresponding to the different vibration amplitude can be extracted simultaneously from all these signal segments. Patsias [8] and Pearson [9] also adopted the similar approach to identify the damping for the coating structure with nonlinear stiffness. But, usually, a high signal-to-noise ratio signal is needed for identifying the system damping by time domain method, so, the identified damping is often not accurate due to the noise interference.
Therefore, this study focuses on the development of the frequency domain method of identifying damping for the nonlinear stiffness structure. In section 2, the stiffness nonlinear system was divided into the weak nonlinear stiffness system and strong nonlinear stiffness system, and the relative damping identification formulas were derived respectively. In section 3, the correctness of the proposed formulas was verified with a numerical simulation example. In section 4, the test procedure of the proposed method was presented for the above mentioned nonlinear structures. Because the frequency sweep is the kernel of the test, the effects of the sweep direction and sweep speed to the test results were also discussed. At last, the method has been demonstrated by using a hard-coating specimen with soft nonlinearity. The damping parameters of the structure were identified under different exciting levels. Vibration reduction used the hard coating has received more and more attention in recent years [8-11], and the hard-coating composite structure usually display nonlinear stiffness behavior [8, 9, 12], so the proposed damping identification method can provide the reference for the study of vibration reduction used the hard coating.
2. Damping identification theory for the nonlinear stiffness structure
Fig. 1 shows the frequency response curves for systems with weak and strong nonlinear stiffness. For the weak nonlinear stiffness system shown in Fig. 1(a), there is a steeper slop in one side of the response curve. With the increase of exciting level, the steeper slope will become the vertical line shown in Fig. 1(b), and then the system is called strong stiffness nonlinear system. Corresponding to the different nonlinear type, the identifying damping formulas will be derived in this section.
Fig. 1Frequency response curves of weak and strong nonlinear stiffness system
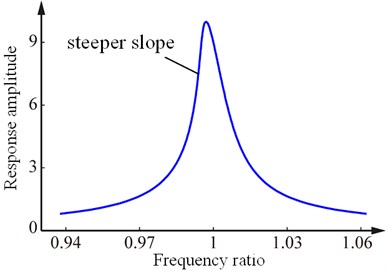
a) The weak nonlinear stiffness system
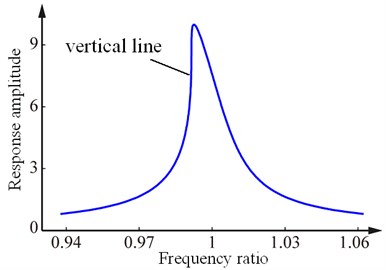
b) The strong nonlinear stiffness system
2.1. Derivation of damping identification formula for the weak nonlinear stiffness system
For the nonlinear stiffness structure, the movement equation can be expressed as:
where is the mass, is the equivalent viscous damping coefficient, is the linear stiffness, is a small parameter, is exciting level, is exciting angular frequency. is a monotonic function of the response amplitude and when is equal to 0, .
Eq. (1) can be converted into:
In this equation, is the resonant frequency at infinitesimal exciting level, is damping ratio and expressed as .
The linear system corresponding to the Eq. (2) can be expressed as:
And the response amplitude of the linear system is:
Referring to the linear system, the response amplitude of the nonlinear system of Eq. (2) can be expressed as:
It is assumed that the response amplitude reaches the maximum when the sweep frequency is under the exciting level . For the light damping system, the can be shown as:
where is the maximum response amplitude.
From the Eq. (6), the monotonic function can be determined by testing the maximum response amplitude and the relative resonance frequency under different exiting levels . The identifying formula is:
According to the Eq. (7), inputting a maximum response amplitude , a value of function can be obtained. Using these data points, the expression of function can be fitted by polynomial.
Furthermore, from the Eq. (5), a dimensionless response amplitude can be gotten:
Substituting the Eq. (6) into the Eq. (8), the maximum dimensionless response amplitude can be yielded:
For the weak nonlinear structure system, there exist two exciting frequencies and () on the both sides of the resonant frequency, at which the response is some fraction () of the dimensionless response amplitude, that is . Accordingly, for the real response amplitudes corresponding to the two exciting frequencies and , there also exist the expression . Then the and can be regarded as the solutions of the Eq. (8), solving Eq. (8), can yield:
Eq. (10) subtracting Eq. (11) can yield:
Conversely, Eq. (10) adding Eq. (11) can yield:
Eq. (12) can be considered as the formula of identifying damping. However, is the resonant frequency at infinitesimal exciting amplitude, it can not be determined exactly by experiment. Thus, needs to be substituted by Eq. (13). So, for the weak nonlinear stiffness system, the final damping identification formula is:
It is noted that, in the Eq. (14), if the values of two exciting frequencies and can be found from the frequency response data and the weak nonlinear stiffness can be described, that is the expression can be determined exactly, then the damping of weak nonlinear stiffness system can be obtained accurately.
2.2. Derivation of damping identification formula for the strong nonlinear stiffness system
Due to a sufficient strength of nonlinearity, the response function of Eq. (8) will not be a single-valued function of frequency . Then, the specific frequency or used to identify the damping of the system may cannot be found from the frequency response function obtained from the experiment simultaneously. For the strong soft nonlinear system shown in Fig. 2(a), the frequency can not be determined, and the frequency can not be gotten for the strong hard nonlinear system shown in Fig. 2(b). Thus, new damping identification formulas need be derived for these strong nonlinear stiffness systems.
For the strong soft nonlinear system, from the Eq. (6) and Eq. (13), can be solved and expressed by and :
Substituting Eq. (15) into Eq. (14), the formula can be obtained for the strong soft nonlinear system and shown as:
Fig. 2Frequency response curves of the strong nonlinear stiffness system
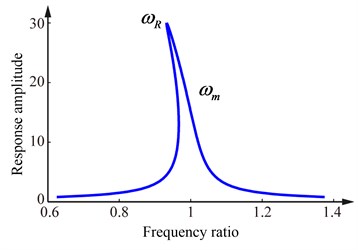
a) The strong soft nonlinear system
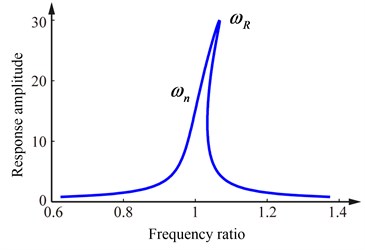
b) The strong hard nonlinear system
With the similar method, the identifying damping formula can also be obtained for the strong hard nonlinear system:
The Eq. (14), Eq. (16) and Eq. (17) are the damping identification formulas for the nonlinear stiffness system proposed in this study. Although based on the single-degree-of-freedom system, the proposed method is also suitable to the multiple-degree-of-freedom systems if the resonant peaks are so sufficiently well separated that the observed response is that of a single mode.
3. A numerical case
In this section, a Duffing system was chosen to illustrate the method presented in this work. The movement equation of Duffing system can be expressed as:
where is the cubic stiffness coefficient. The relevant parameter values of Eq. (18) are set and listed in Table 1.
Table 1Parameter values of Duffing system
0.05 | 1 | –0.001 | 0.5, 1, 2, 3 |
According to the multiple scale method, the frequency response under exciting levels from 0.5 to 3 can be obtained and shown in the Fig. 3.
It can be seen from the Fig. 3 that when the exciting level or 1, the Duffing system is weakly nonlinear. The exciting frequencies and can be got from the sweeping test. Then, the damping ratio can be calculated by the Eq. (14) or the classical half-power bandwidth method. However, as is shown in the Fig. 3, when the exciting level or 3, the Duffing system becomes a strong nonlinear system. Because of the strong soft nonlinearity of the system, the smaller exciting frequency used to identify damping can not be obtained from the real vibration test, then the formula Eq. (16) should be adopted.
If set , the resonance frequency , the maximum response amplitude and the specific exciting frequencies and under the different exciting levels can be determined from the frequency response curve. These values are listed in Table 2.
Fig. 3Frequency response curves of the Duffing system
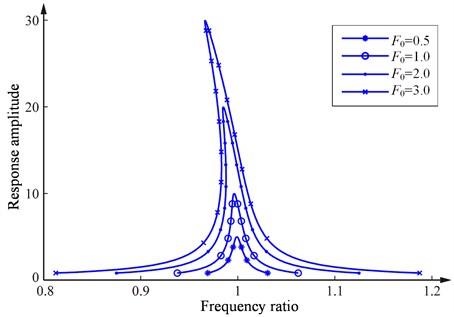
Table 2The relevant parameters of the system under different exciting levels
0.5 | 0.9991 | 5 | 1.0046 | 0.9944 |
1 | 0.9963 | 10 | 1.0033 | 0.9931 |
2 | 0.9850 | 20 | 0.9976 | – |
3 | 0.9662 | 30 | 0.9882 | – |
Substituting the resonance frequency and the maximum response amplitude into the Eq. (7), the corresponding values of monotonic function under different exciting levels can be solved. Further, by polynomial fitting, the expression of can be determined as:
Finally, the damping ratios of the system under different exciting levels are identified by the method in section 2. Besides, the classical half-power bandwidths method is also adopted to compare. The results are listed in Table 3.
Table 3The identifying damping ratios under different exciting levels
Exciting level | Half-power bandwidths method | Identifying damping formula for the weak stiffness nonlinear system | Identifying damping formula for the strong stiffness nonlinear system | |||
Identifying value | Difference | Identifying value | Difference | Identifying value | Difference | |
0.5 | 0.05105 | 2.10 % | 0.05097 | 1.94 % | 0.05047 | 0.94 % |
1 | 0.05118 | 2.36 % | 0.05090 | 1.8 % | 0.05148 | 2.96 % |
2 | – | – | – | – | 0.05092 | 1.84 % |
3 | – | – | – | – | 0.04945 | 1.1 % |
When the exciting level is 0.5 or 1, the system is a weakly nonlinear system. The identification results of the proposed method in this work are more accurate than that of the half-power bandwidths method. When the exciting level is 2 or 3, the system is a strong nonlinear system. The classical half-power bandwidths method cannot be used any more. But the method proposed above can identify the damping ratio well and maintain higher accuracy. So, it can be known from the Table 3 that the presented damping identification formulas is suitable for the system with weakly nonlinear stiffness and strong nonlinear stiffness, and is better than the classical half-power bandwidth method.
4. Test procedure and method
Using the proposed method in this work, the damping of nonlinear stiffness system can be obtained according to the procedure listed in Table 4.
Table 4The procedure of identifying the damping of nonlinear stiffness system
1. Testing the nature frequencies of system, |
2. Detemining the sine sweep intervals corresponding to each order nature frequency |
3. Determining the nonlinear type of system, soften or hard nonlinear stiffness system |
4. Determining the sweeping direction and rate, |
5. Obtaining the frequency domain response curves under diffrent exciting levels and recording the maximum response amplitude and resonant frequency, , |
6. Fitting the expression of monotonic function according to Eq. (7) |
7. Identifying the damping of nonlinear stiffness system used the Eq. (14), Eq. (16) or Eq. (17) |
Some of the key steps need be illustrated as follow:
Dynamic ping test is an easy and applied method to get the nature frequencies of structure system. Furthermore, a small frequency range which consist a certain order nature frequency value can be chosen as a sine sweep interval. For the light damping system, dozens of Hz will be enough to satisfy the need of damping identification.
Sweeping can be done by electromagnetic shaker. Sweeping direction is an important influencing factor to identify the damping of system. For the different nonlinear type of system, the sweeping direction is also distinct. It will be demonstrated by another example of soften nonlinear stiffness system shown in Fig. 4.
Fig. 4Frequency response of a strong soften stiffness nonlinear system
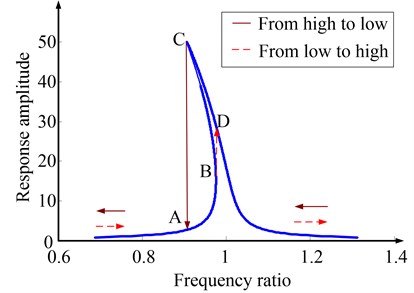
It can be seen, if frequency is swept from low to high, the observed values of response amplitude will jump from point B to point D, then the actual maximum response amplitude and the resonant frequency will not be observed and the damping of system can not be identified accurately. On the contrary, if the sweeping is performed from high frequency to low frequency, both the actual maximum response amplitude and the resonant frequency can be observed, the specific frequency used to identify damping can also be obtained, but the other frequency can not be determined because of the jump of the observed values of response amplitude from point C to point A. In spite of this, the Eq. (16) shows that as long as the , and are obtained, the damping can be identified accurately for the strong soft nonlinear system. So, to test damping effectively, the sweeping direction should be from high to low for the soft nonlinear system and from low to high for the hard nonlinear system.
Sweeping rate is also important for damping identification. Because the damping identification method is based on the steady state response of system, and the decay of transient response is affected by the sweep rate directly, so an appropriate sweep rate should be determined. According to the literature [13], the constraint condition of sweep rate is:
where is the permitted sweep rate and the unit is Hz/s, is the maximum sweep rate, is the -order nature frequency of structure and unit is Hz. By limiting the sweep rate, the transient response has an opportunity to decay and only the force response used to identify damping is left.
5. A study case
To illustrate the effectiveness of damping identification method proposed in this paper, the 4-order and 5-order modal damping ratios of cantilever thin plate coated are identified accordance to the key steps described in section 4. This kind of composite structure has stiffness nonlinear characteristics [8, 9, 12]. It is necessary to determine the damping parameters of such structures for the study of vibration used hard coating.
5.1. Test specimen and test system
A titanium alloy thin plate was chosen as test specimen in this work and the finished dimensions of the plate are . The plate was in cantilevered state during testing and a 40 mm section to be mounted in the clamping device. The coating was prepared by air plasma spraying (APS ) and fully covered the plate with a uniform thickness 84 . To test the damping characteristic of the cantilever composite structure, the test system was set up and shown in the Fig. 5. The main equipments include the data acquisition, exciter and vibration sensor, etc. and Table 5 lists the instruments used in this test in detail. Among the instruments, the hammer excitation was used to obtain the linear nature frequencies which are independent with exciting levels for the composite system. While, the shaker excitation was used to get the resonance frequencies and frequency responses under different exciting levels and these data can be used to identify the damping of composite structure. Here, LMS SCADAS mobile front-end is chosen as the data acquisition and Polytec PDV-100 laser vibrometer is chosen as pick-up vibration sensor.
Fig. 5Test system
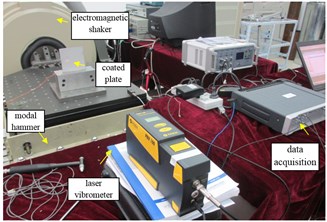
Table 5The instruments used in this test
No. | Name |
1 | LMS SCADAS mobile front-end |
2 | PCB 8206-001 54627 modal hammer |
3 | KINGDESIGN EM-1000F shaker |
4 | Polytec PDV-100 laser vibrometer |
5 | High-performance notebook computers |
5.2. Test process and results
The natural frequencies of cantilever composite thin plate were test by hammer. The values of natural frequencies were determined by the obtained frequency response function and shown in Table 5. From the Table 5, the frequency range of sweeping used to test each order modal damping ratio can be determined. Here, only the 4-order and 5-order modal damping ratios were considered and were tested and shown as a study case. The sweeping range used to identify the 4-order modal damping ratio is from 830 Hz to 845 Hz (total 15 Hz of frequency bandwidth), and for the 5-order, the sweeping range is 1685 Hz to 1705 Hz (total 20 Hz of frequency bandwidth). In additional, each frequency value listed in Table 6 was also regarded as the value of relative order resonance frequency corresponding to infinitesimal exciting level in this study, then the frequency values can be used to solve the function value of .
Table 6Nature frequencies of cantilever composite thin plate
Order | 1 | 2 | 3 | 4 | 5 | 6 |
Nature frequency / Hz | 91.9 | 198.7 | 559.6 | 838.1 | 1695.0 | 1811.8 |
Here, a few sweeping excitation measurements were performed by shaker under the determined sweeping intervals. The exciting levels are set as acceleration values of 1 g, 2 g, 3 g, 4 g, 5 g respectively. From the control soft DACTRON of the shaker, the resonance frequency corresponding to different exciting level can be obtained. It can be found from the test, the value of resonance frequency (listed in Table 7) of cantilever composite plate reduced with the increase of exciting level, no matter forward or backward sweep. This shows that the composite cantilever plate has soft nonlinear characteristic. In fact, this phenomenon has been found by many experiment studies [8, 9, 12].
Table 7The resonance frequencies of composite cantilever thin plate under different exciting levels / Hz
Exciting levels | 1 g | 2 g | 3 g | 4 g | 5 g |
The 4-order resonance frequency | 837.6 | 836.4 | 835.3 | 834.2 | 833.1 |
The 5-order resonance frequency | 1694.8 | 1692.8 | 1691.8 | 1691.1 | 1690.7 |
For soft nonlinear system, the sweeping should be done from high to low frequency, which has been explained in section 4. In this test, the rates of all the sweeps were all set as 0.1 Hz/s. If the modal damping ratios of both the 4-order and the 5-order are 0.0005, it is a very small value of damping and the actual value of damping should be greater than this. According to the Eq. (20), the permitted maximum sweep rate of the measurement 4-order modal damping ratio is 0.19 Hz/s and the sweep rate of the 5-order is 0.64 Hz/s. Then, it can be confirmed that the selected sweeping rate satisfies the requirement of damping measurement.
Then, series sweeping measurement were done according to the determined exciting levels and sweeping intervals. Because the data obtained by the laser vibrometer are time-domain signals. To identify damping by frequency bandwidth method, it is necessary to convert these time-domain signals into frequency domain. Here FFT transform based on time division was adopted to process the time-dependent data and produce the frequency responses. The procedure of data processing is: dividing a time domain signal into several parts, converting each part of the time domain signal into frequency domain by FFT and combining each frequency domain signal into the whole frequency response. Since the identifying damping formula need the displacement frequency response, the velocity measurements by laser vibrometer also need be converted into displacements. Fig. 6 is the final frequency response used to identify the 4-order and 5-order modal damping ratio.
From the Fig. 6, both the resonance frequencies and the maximum response amplitudes under different exciting levels can be obtained. The resonance frequencies have been listed in Table 7 and the maximum response amplitudes are listed in Table 8. Furthermore, substituting the resonance frequency and the frequency corresponding to infinitesimal exciting level into Eq. (8), then the function value of can be got and were also listed in Table 8.
Table 8Response amplitudes and function values of εΦ{X} under different exciting level
Exciting level | 1 g | 2 g | 3 g | 4 g | 5 g | |
The 4 order | Response amplitude / | 17.5 | 31.1 | 44.8 | 54.2 | 58.9 |
Function value of | –0.0012 | –0.0041 | –0.0067 | –0.0093 | –0.0119 | |
The 5 order | Response amplitude / | 20.1 | 36.1 | 55.9 | 64.1 | 78.9 |
Function value of | –0.0002 | –0.0026 | –0.0038 | –0.0046 | –0.0051 | |
According to the data listed in Table 8, the different expressions of monotonic function for the 4-order and the 5-order can be fitted by polynomial, the final results are:
It also can be seen from the Fig. 6, when the exciting level is 4 g or 5 g, the frequency response curves of the 4-order resonance frequency display the nonlinear jump phenomenon, so the system is strong nonlinear stiffness system under this state and Eq. (16) should be adopted to identify damping. In other cases, the structure systems are all weakly nonlinear stiffness system and damping identification should be performed by Eq. (14). During the damping identification, the value of is set as . The identified results of the 4-order and 5-order modal damping ratios are listed in Table 9. It can be known from the Table 9, both the 4-order and the 5-order modal damping ratios increase with the increase of the exciting levels and become constant gradually.
Fig. 6Frequency response curves used to identify the 4-order and 5-order modal damping ratio
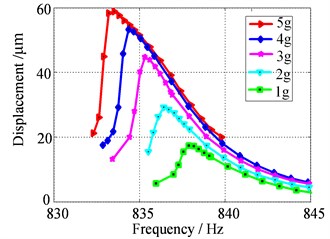
a) The frequency response included the 4-order resonance frequency
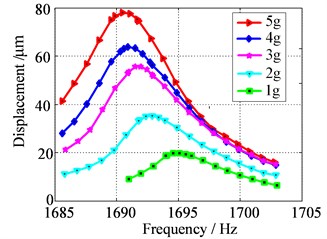
b) The frequency response included the 5-order resonance frequency
Table 9The 4-order and the 5-order modal damping ratios under different exciting levels
Exciting level | 1 g | 2 g | 3 g | 4 g | 5 g |
The 4-order modal damping ratio / % | 0.25 | 0.27 | 0.28 | 0.31 | 0.30 |
The 5-order modal damping ratio / % | 0.31 | 0.35 | 0.37 | 0.42 | 0.40 |
6. Conclusions
The method of damping identification was proposed for the nonlinear stiffness structure in this work. By modified the classical half-power bandwidth method, the identifying damping formulas were derived respectively for the weakly and strong nonlinear stiffness structure. Utilizing these identification formulas of strong nonlinear stiffness systems, even if only the resonance frequency and one of specific frequencies and are known, the damping can be identified effectively. The correctness of the proposed method was verified by a Duffing simulation system. The results show that for both the weakly nonlinear stiffness system and strong nonlinear stiffness system, the proposed method has broader applicability and higher identifying accuracy than the classic half-power bandwidth method.
The test procedure of the proposed method was presented for the nonlinear stiffness structure systems. This procedure was demonstrated using a hard coating specimen with soft nonlinear and the modal damping ratios of the 4-order and 5-order of the structure were obtained under different exciting levels. These results can provide the reference for the study of vibration reduction used the hard coating.
References
-
F. Mohammadi, R. Sedaghati Vibration analysis and design optimization of viscoelastic sandwich cylindrical shell. Journal of Sound and Vibration, Vol. 331, 2012, p. 2729-2752.
-
N. Kumar, S. P. Singh Experimental study on vibration and damping of curved panel treated with constrained viscoelastic layer. Composite Structures, Vol. 92, 2010, p. 233-243.
-
I. I. Argatov,E. A. Butcher On the Iwan models for lap-type bolted joints. International Journal of Non-Linear Mechanics, Vol. 6, 2011, p. 347-356.
-
H. Ohta, K. Tanaka Vertical stiffnesses of preloaded linear guideway type ball bearings incorporating the flexibility of the carriage and rail. Journal of Tribology, Vol. 132, 2010, p. 1-9.
-
I. T. Pearson, J. T.Mottram A finite element modelling methodology for the non-linear stiffness evaluation of adhesively bonded single lap-joints. Part 1: Evaluation of key parameters. Computers & Structures, Vol. 90, 2012, p. 76-88.
-
P. Ribeiro, H. Akhavan Non-linear vibrations of variable stiffness composite laminated plates. Composite Structures, Vol. 94, 2012, p. 2424-2432.
-
S. A. Reed, A. N. Palazotto,W. P. Baker An experimental technique for the evaluation of strain dependent material properties of hard coatings. Shock and Vibration, Vol. 15, 2008, p. 697-712.
-
S. Patsias, C. Saxton, M. Shipton Hard damping coatings: an experimental procedure for extraction of damping characteristics and modulus of elasticity. Materials Science and Engineering: A, Vol. 370, 2004, p. 412-416.
-
L. E. Pearson Vibration analysis of commercial thermal barrier coatings. Thesis, Air Force Institute of Technology, Dayton, Ohio, 2008.
-
C. Blackwell, A. Palazotto, T. J. George, et al. The evaluation of the damping characteristics of a hard coating on titanium. Shock and Vibration, Vol. 14, 2007, p. 37-51.
-
F. Ivancic, A. Palazotto Experimental considerations for determining the damping coefficients of hard coatings. Journal of Aerospace Engineering, Vol. 18, 2005, p. 8-17.
-
N. Tassini, K.Lambrinou, I. Mircea, M. Bartsch, S. Patsias Study of the amplitude-dependent mechanical behaviour of yttria-stabilised zirconia thermal barrier coatings. Journal of the European Ceramic Society, Vol. 27, 2007, p. 1487-1491.
-
P. J. Torvik On estimating system damping from frequency response bandwidths. Journal of Sound and Vibration, Vol. 330, 2011, p. 6088-6097.
About this article

This project is supported by National Natural Science Foundation of China (Grant No. 51375079).
