Abstract
Journal bearings are widely used to support the shaft of industrial machinery with heavy loads, such as compressors, turbines and centrifugal pumps. The major problem in journal bearing is catastrophic failure due to corrosion and erosion, results in economic loss and creates high safety risks. So, it is necessary to provide condition monitoring technique to detect and diagnose failures, to achieve cost benefits to industry. The method of vibration signal processing using filter analysis for condition monitoring and fault diagnosis has been evolving at a very rapid rate in recent years. The use of filter technique has proven to be a very powerful and reliable tool for fault detection and its most important attribute is its ability to efficiently detect non-stationary, non-periodic, transient features of the vibration signal. In this paper the application of Butterworth filter for processing vibration signal to detect faults in journal bearing is presented. A bearing testing apparatus is used for experimental studies to obtain vibration signal from a healthy bearing and a fault bearing. The signal processing methods using Fast Fourier Transform, enveloped filtered power spectrum based on Butterworth filter method and their implementation are presented. Further applications of Artificial Neural Network (ANN) are investigated as a model for automated fault diagnosis.
1. Introduction
In modern world most of the machines are operated by rotary parts which induce faults. The monitoring of the operative conditions of rotary machines provides a great economic advantage by reducing maintenance costs, improving safety level, etc. [1]. Vibration techniques is used to diagnose and predict various defects in journal bearing [2] and it provides early information about faults for future monitoring purpose. The engine journal bearing fault diagnosis is based on power spectral density of vibration signals in combination with support vector machine. The frequency domain vibration signals of internal combustion engine bearing based on various conditions such as normal, corrosion and excessive wear is discussed in [3].
The power spectrum analysis was based on the Fast Fourier transform (FFT) [4-5]. The FFT is not an efficient tool to describe non-stationary signals introduced by faults in vibration signal. In order to overcome these limitations over FFT, many modern techniques have been proposed during last 20 years [6-7]. The filter coefficient describes the correlation of signal with a particular filter and it is necessary to select an appropriate filter which is similar to the fault feature. In order to denoise the vibration signals digital filters are widely used [8]. Butterworth filter is one of the popular filters used for mechanical fault detection [9].
Expert systems and artificial intelligence are playing significant role in automated fault diagnosis and machine learning. Machine learning using the concepts of Artificial Neural Network (ANN) have become very popular and known for exploiting non-linear pattern classification properties, offering automatic detection and identification of gearbox fault conditions. It offers an advantage that they do not require an in-depth knowledge of the behavior of the system [10].
ANN is one of the approaches to forecast and validate using computer models with some of the architecture and processing capabilities of the human brain. Artificial neural networks are made of simple processing units, called neurons capable of storing experimental knowledge as a natural propensity [10]. The artificial neuron receives signals analogous to the natural electro-chemical signals. The way information is processed and intelligence is stored depends on the architecture and algorithms of ANN.
In this paper a bearing testing apparatus is used for experimental studies to obtain vibration signal from a journal bearing with and without defects. The signal processing methods using FFT, enveloped filter power spectrum based on Butterworth method and their implementation are presented. A comparative study detailing features of fault characterization is also given in order to understand the effectiveness of various signal processing methods and their fault diagnosis capability. Further application of ANN for extracting features like RMS, mean, kurtosis, shape factor, crest factor and impulse factor is investigated as a model for automated fault diagnosis.
2. Design of Butterworth filter
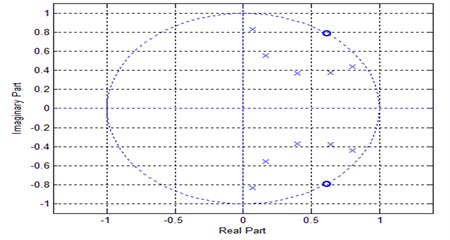
The Butterworth filter is one type of signal processing filter and it is designed to have a frequency response which is flat as mathematically possible in the pass band. These filters have monotonically changing magnitude with , unlike other filter types that have non-monotonic ripple in the pass band and stop band. Also, these filters have a more linear phase response in the pass band than the Chebychev and elliptic filters, so that a smoother curve is obtained. The frequency response of the filter is shown in Fig. 1 and the pole zero plot contains both real and imaginary part is shown in Fig. 2. Butterworth filters are digital filters used to reduce the additional noise generated due to electrical interference during running conditions. This filter is used to minimize the error between the idealized filter characteristics and the actual filter range. This filter has been designed by setting up a single pole parameter which represents their cut-off frequency. A Single S-plane pole is trying to allow some frequencies to pass through the filter while stopping others. So, the ideal case therefore is unity gain in the pass band and an instantaneous drop to zero in the stop band. Hence, the Butterworth filter is very efficient in terms of providing a characteristic which approximates to the ideal case without significant side lobes and with flat pass bands. So, the characteristic is represented in terms of single pole.
Fig. 1Frequency response of Butterworth filter
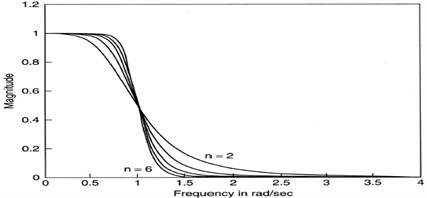
Fig. 2Pole zero plot for Butterworth filter
The transfer function is given by Eqs. (1)-(3):
To obtain frequency response take and the functions of interest are and .
For a single pole, the expression is given by the equation:
Hence the function is given by:
The equivalent frequency response is given by the Eqs. (4)-(5):
For multi pole, the expression for frequency response is given by:
3. Experimental setup
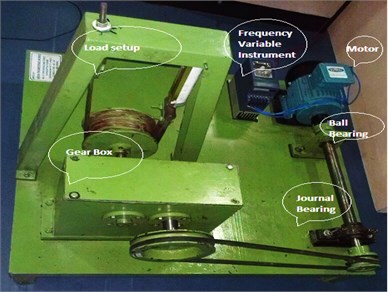
The experimental set up consists of motor of 0.5 HP, 3000 rpm connected to the rotor, through a coupling supported with one ball bearing and journal bearing at the end of pulley and attached to a loading system is shown in Fig. 3. The vibration data is collected from the journal bearing through the accelerometer sensor 621B40 and the vibration signals are processed with DWESOFT software. Peaks of low amplitude when bearing is normal, but amplitudes will go high when there are defects in journal bearing. Amplitude of peaks will be prominent about frequency when the bearing damage is severe.
Fig. 3Experimental set up
In the experimental investigation, the vibration signals was collected at an ideal condition without any crack or wear i.e., healthy surface at a shaft speed of 1050 rpm. and at constant load condition as shown in Fig. 2. The readings were recorded at a sampling rate of 12000 Hz.
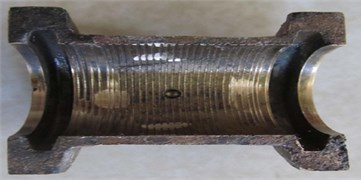
An eccentric bore fault at stage F1 was produced on inner surface of bearing and the corresponding vibration readings were taken and it is shown in Fig. 4. The Fig. 5 and Fig. 6 shows the readings which is taken when the crack of 3 mm on inner surface of the bearing and the material was broken partially and completely at stage F2 and F3. The Bearing Frequency (BF) is calculated to be RPM/60 = 1050/60 = 17.5 Hz.
Fig. 4No fault on the journal bearing
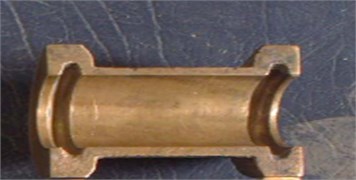
Fig. 5Bore fault on the bearing (Fault F1)
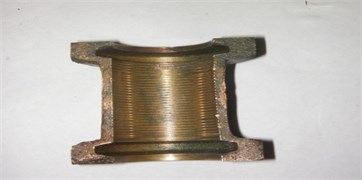
Fig. 6Bore fault with hole on the bearing (Fault F2)
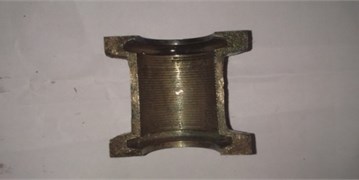
Fig. 7Material removal and bore fault with hole on the bearing (Fault 3)
The accelerometer type 621B40, 1 M I sensor has sensitivity 1.02 mv/m/sec2 and frequency range up to 10 KHz, is used in vertical position on the bearing housing with magnetic base to collect vibration data. The other end of the accelerometer is connected to the vibration data collector with DWESOFT software. The obtained data (time domain signals) from Dwesoft is processed with MATLAB software. MATLAB software is used to develop filtered envelop power spectrum. Thus, the various types of faults are induced on the bearing surface and the corresponding signals for each fault are recorded and analyzed through MATLAB to check its severity.
4. Results and discussion
A typical time domain signal obtained from the experimental setup without any defect, using accelerometer is given in Fig. 8. This is further processed using various signal processing techniques based on FFT and principle of Butterworth filter enveloped Power Spectrum Density (PSD) is explained in the previous section 2.
Fig. 8Time domain signal for no fault
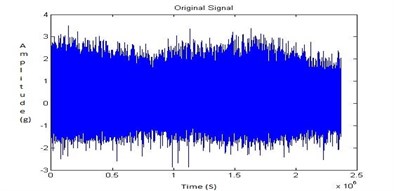
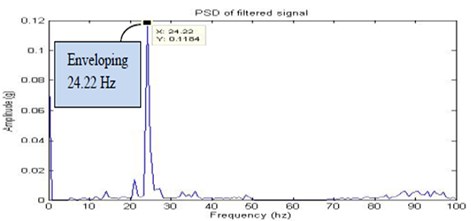
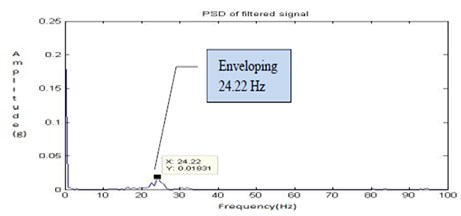
The PSD plot shows that the frequency in Hz along -axis and the amplitude ‘’ in m/s2 along -axis. The Fig. 8, Fig. 9, Fig. 10 and Fig. 11 shows the time domain signal, FFT signal, before applying filter PSD of signal for no fault and filtered signal for no fault i.e., healthy bearing. From this power spectrum density plot, it is observed that before applying the filter the bearing frequency is 24.22 Hz for the shaft speed of 1050 rpm. After applying the Butterworth filter, the PSD plot shows the frequency of 17.19 Hz. From the results it was found that the filter used to reduce the additional noise generated due to electrical interference during running conditions. Also it is clearly indicated that there is no fault. But, through Fast Fourier Transform (FFT) signal plot it is too difficult to locate the fault.
Fig. 9FFT signal for no fault
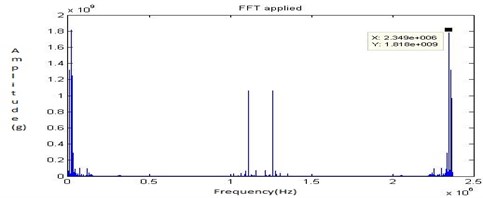
Fig. 10Before applying filter PSD of signal for no fault
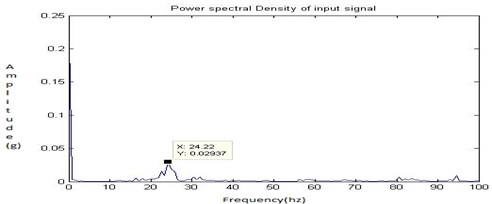
Fig. 11Filtered signal for no fault
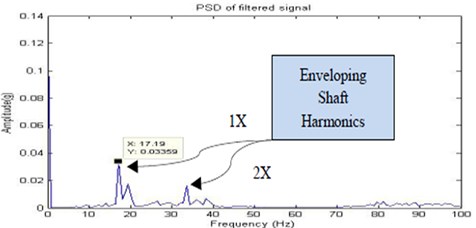
The above Fig. 11 depicts important features of frequency content including the shaft frequency and second harmonic of the shaft frequency of the vibration signal at 1050 rpm (17.5 Hz). There is no indication of the fault in the frequency spectrum.
In the journal bearings, mechanical looseness may only develop at operating speed and temperature. First, the half looseness is provided on the bearing casing and the signals are recorded through the experimental set up. The Fig. 12, Fig. 13, Fig. 14 and Fig. 15 shows the time domain signal, FFT signal, before applying filter PSD of signal for half looseness and filtered signal for half looseness of the bearing. From this Power Spectrum Density (PSD) plot, it is observed that the bearing frequency for half mechanical looseness is 24.22 Hz with the peak amplitude of 0.1184. This increased frequency is due to combination of sub harmonics and interharmonics for mechanical looseness.
Fig. 12Time domain signal for half looseness
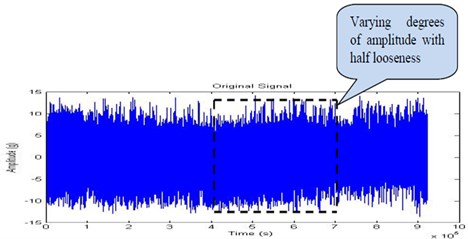
Fig. 13FFT signal for half looseness
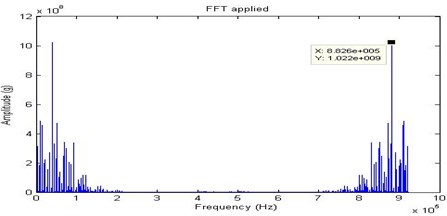
Fig. 14Before applying filter PSD of signal for half looseness
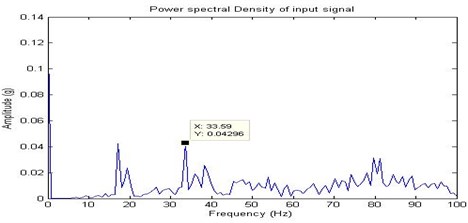
Fig. 15Filtered signal for half looseness
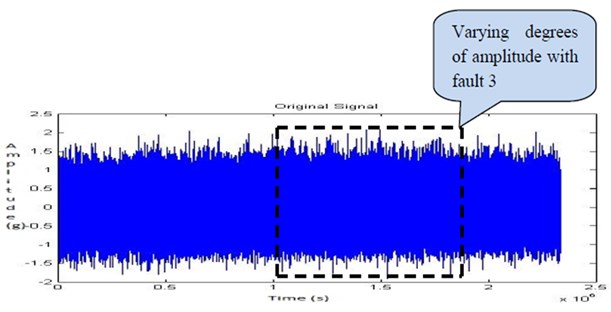
By comparing the time domain signals of Fig. 12, Fig. 16, Fig. 20, Fig. 24, Fig. 28, Fig. 32 and Fig. 36, highlight a few waveforms showing varying degrees of amplitude of the modulated waveform which proved to be a function of the intensity of the fault. These observations validate the results of indication of a fault contact within the journal. Thus, a vibration signature modulated at the rotational speed of the unit is illustrative of a continuous fault source. This continuous fault implies a sustained contact between the shaft and the bearing generating vibration levels above the operational background levels.
Comparing the spectra in the Fig. 11, it can be found that the amplitudes of the friction frequency and its harmonics increase with the increasing misalignment conditions. This accelerates the shaft causing it to rebound from the surface at 1X (17.19 Hz) vibrations in frequency spectrums.
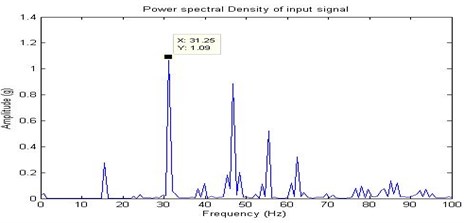
In the journal bearings, full looseness may only develop at high speed and temperature. Then the full looseness is provided on the bearing casing and the signals are recorded through the experimental set up. The Fig. 16, Fig. 17, Fig. 18 and Fig. 19 shows the time domain signal, FFT signal, before applying filter PSD of signal for full looseness and filtered signal for full looseness of the bearing. From this Power Spectrum Density (PSD) plot, before applying filter it is observed that the bearing frequency for full looseness is 31.25 Hz with the peak amplitude of 1.09. After applying the filter the PSD plot shows the frequency of 31.25 Hz with the peak amplitude of 0.4758. Thus, after applying filter considerable peak amplitude is get reduced due to electrical interference of motor. When compared to the half looseness, an increase in frequency and peak amplitude are observed in the full looseness and hence it is noisier. From the result it shows that there increase in the severity of the looseness.
Fig. 16Time domain signal for full looseness
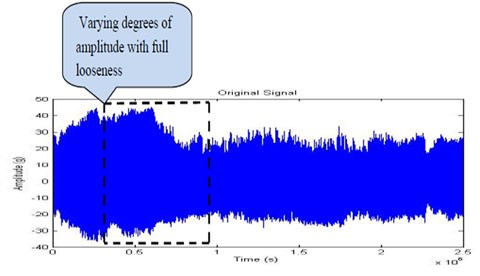
Fig. 17FFT signal for full looseness
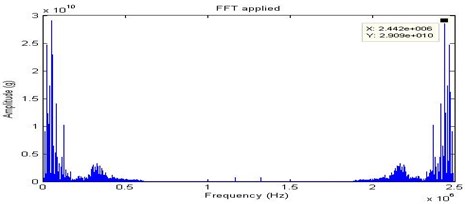
Fig. 18Before applying filter PSD of signal for full looseness
Half lubrication behavior is due to side leakages of oil between shaft and the bearing. It can deteriorate and cause metal to metal contact in journal bearings. This will decrease eccentricity, increase oil temperature and reduce viscosity. In the journal bearings, oil instability may only develop at side leakages and poor mechanical maintenance. The half lubrication is poured through the oil hole provided on the bearing casing and the signals are recorded. Due to improper lubrication, the coefficient of friction gradually starts to increase between the shaft and the bearing. The Fig. 20, Fig. 21, Fig. 22 and Fig. 23 shows the time domain signal, FFT signal, before applying filter PSD of signal for half lubrication and filtered signal for half lubrication of the bearing. From this Power Spectrum Density (PSD) plot, it is observed that the bearing frequency for half lubrication is 24.22 Hz.
Fig. 19Filtered signal for full looseness
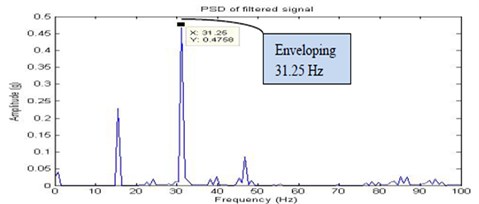
Fig. 20Time domain signal for half lubrication
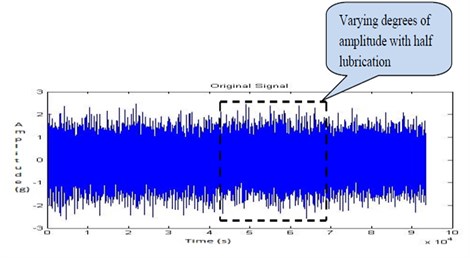
Fig. 21FFT signal for half lubrication
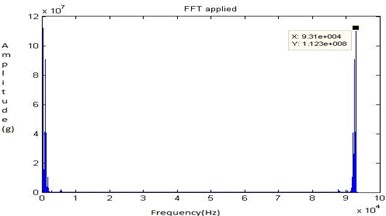
Fig. 22Before applying filter PSD of signal for half lubrication
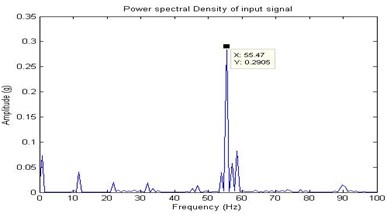
Fig. 23Filtered signal for half lubrication
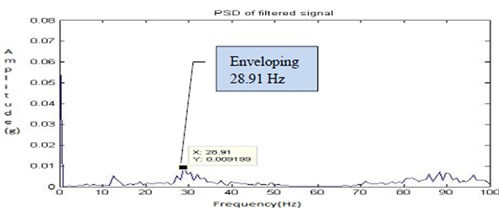
In the journal bearings, absence of oil may only develop at more side leakages and poor maintenance. The oil is completely drained and the signals are recorded through the experimental set up. Due to absence of lubrication, the coefficient of friction and the temperature are increased leads to corrosion of the bearing. Under dry running condition due to the asperities formation, an increased surface roughness is observed. The Fig. 24, Fig. 25, Fig. 26 and Fig. 27 shows the time domain signal, FFT signal, before applying filter PSD of signal for no lubrication and filtered signal for no lubrication of the bearing. From this Power Spectrum Density (PSD) plot, it is observed that the bearing frequency for no lubrication is 28.91 Hz. From the result, it shows that there is increase in frequency when compared to half lubrication and leads to the corrosion.
Fig. 24Time domain signal for no lubrication
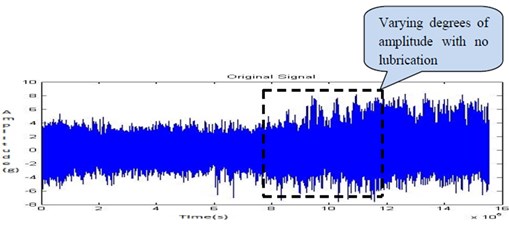
Fig. 25FFT signal for no lubrication
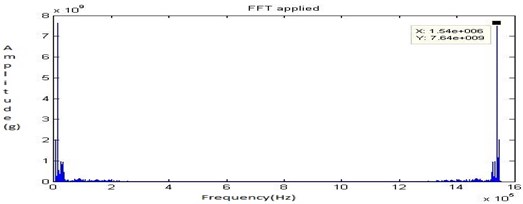
Fig. 26Before applying filter PSD of signal for no lubrication
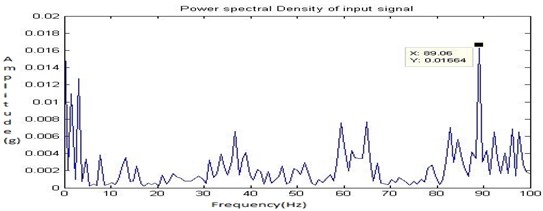
Fig. 27Filtered signal for no lubrication
First the eccentric bore fault (fault 1) was created shown in Fig. 5 and the readings were recorded with the shaft speed of 1050 rpm. The Fig. 28, Fig. 29, Fig. 30 and Fig. 31 shows the time domain signal, FFT signal, before applying filter PSD of signal for fault 1 and filtered signal for fault 1of the bearing. From this Power Spectrum Density (PSD) plot, it is observed that the bearing frequency for fault 1 is 26.56 Hz which is greater than the healthy bearing of 17.19 Hz. This shows that the fault is induced on the bearing.
Fig. 28Time domain signal for fault 1
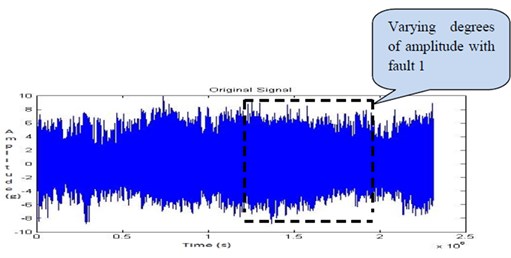
Fig. 29FFT signal for fault 1
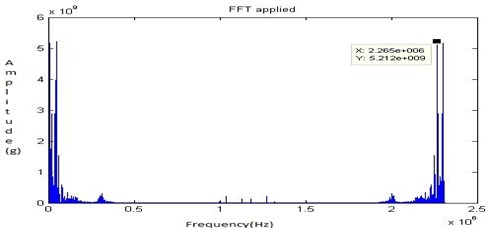
Fig. 30Before applying filter PSD of signal for fault 1
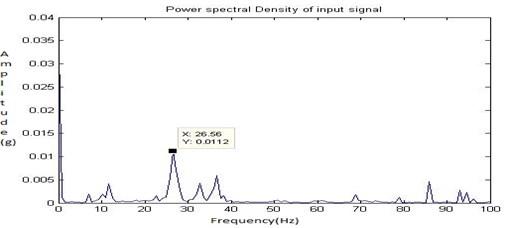
Fig. 31Filtered signal for fault 1
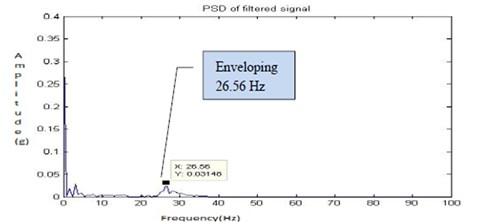
Eccentric bore fault (fault 1) and fault with hole (fault 2) can cause strong harmonics of the shaft rotational speed in vibration analysis. In fault simulation once the shaft and bearing are in contact the stiffness of the test rig increases. This fault behavior tends to produce strong impulses between the journal and bearing which is used to excite system resonance and in addition create harmonics. From the Fig. 31 and Fig. 35, it was found that the dominant frequency of the vibration signals for fault 1 and fault 2 conditions are registered to be approximately 27 Hz and 30 Hz respectively. The Non-synchronous peaks on the frequency spectrum are an indication of bearing fault. The increase in amplitude of these frequencies indicates the rate of fault. As the fault increases, the frequency of these peaks develops harmonics, indicative of impacting.
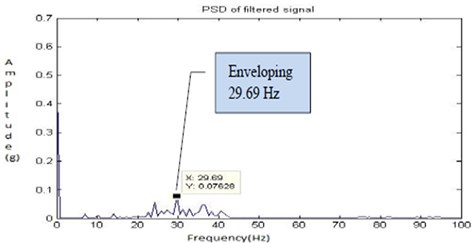
Next the eccentric bore fault with crack of 3 mm (Fault 2) shown in Fig. 6 was created and the readings were recorded with the shaft speed of 1050 rpm. The Fig. 32, Fig. 33, Fig. 34 and Fig. 35 shows the time domain signal, FFT signal, before applying filter PSD of signal for fault 2 and filtered signal for fault 2 of the bearing. From this Power Spectrum Density (PSD) plot, it is observed that the bearing frequency for fault 2 is 29.69 Hz which is greater than the healthy bearing of 17.19 Hz. The PSD plots shows more peaks and an increase in frequency are observed. From the result it shows that there is increase in the severity of the faults when compared to the fault 1.
Fig. 32Time domain signal for fault 2
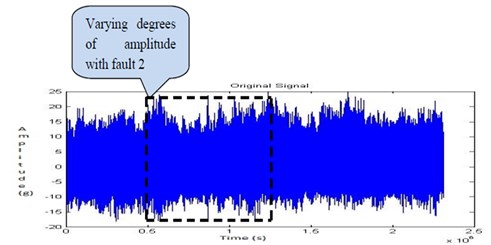
Fig. 33FFT signal for fault 2
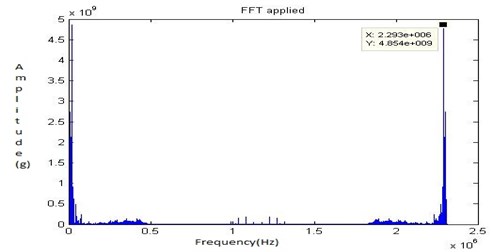
Fig. 34Before applying filter PSD of signal for fault 2
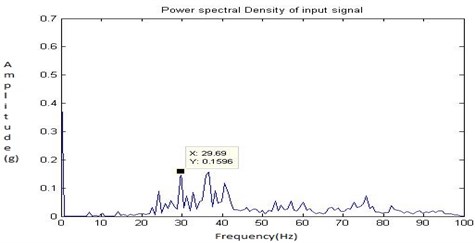
Fig. 35Filtered signal for fault 2
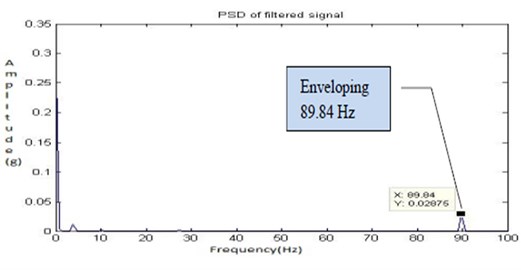
Finally, the material removal and bore fault with hole on the bearing (Fault 3) is shown in Fig. 7 was created and the readings were recorded with the shaft speed of 1050 rpm. The Fig. 36, Fig. 37, Fig. 38 and Fig. 39 shows the time domain signal, FFT signal, before applying filter PSD of signal for fault 3 and filtered signal for fault 3 of the bearing. From this Power Spectrum Density (PSD) plot, before applying filter it is observed that the bearing frequency for fault 3 is 89.84 Hz with the peak amplitude of 0.119. After applying the Butterworth filter the PSD plot shows the frequency of 89.84 Hz with the peak amplitude of 0.02875. Thus, after applying filter considerable peak amplitude is get reduced due to faulty running condition of the bearing and the electrical interference of motor. From the result it shows that there increase in the severity of the faults. When compared to the fault 2, more peaks and an increase in frequency are observed. Hence, the Butterworth filter locates the exact fault on the bearing.
Fig. 36Time domain signal for fault 3
By increasing the fault (material removal fault 3) on the bearing, the frequency is increased, to the high frequency side of the spectrum. This shows that the system is hardening as a result of the stiffness produced by the contact of the shaft with bearing. From the Fig. 39 it is observed that the frequency increases as a result of product of the higher-energy content of the fault impacts. The enveloping analysis demonstrates that the dominant frequency of the vibration signals for fault 3 are registered to be approximately 90 Hz.
Fig. 37FFT signal for fault 3
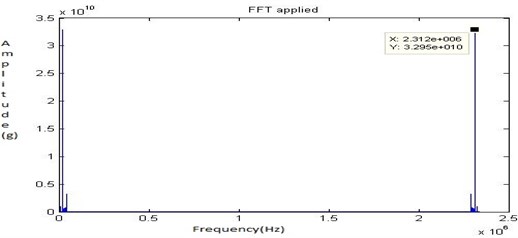
Fig. 38Before applying filter PSD of signal for fault 3
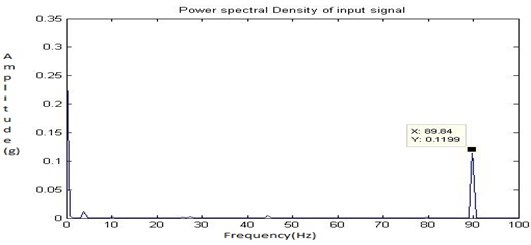
Fig. 39Filtered signal for fault 3
The FFT power spectrums indicated that the amplitude of peaks at BF for healthy and various defect conditions. It is clear that the FFT represent considerable increase in amplitude compared to filtered spectrums. However, the increase in amplitude of peaks at BF as obtained from FFT spectrum is very minimal. From the FFT power spectrum, it is difficult to identify the faults.
5. Artificial neural network (ANN)
A feed forward Multi Layer Perceptron (MLP) neural network has been developed consists of three layers. The input layer of six source nodes represents the normalized features extracted from the time domain. The hidden layer with five computation nodes has been used. The number of hidden nodes is optimized by minimization of Mean Square Error (MSE) between the actual network outputs and the corresponding target values. The output layer with two nodes indicates the different bearing working conditions (healthy and faulty) to be identified by the neural network.
The two digit output target nodes that need to be mapped through the ANN which classifies the working condition of healthy bearing as (0, 1) and faulty (1, 0) has been developed. The Fig. 40 shows the architecture of ANN of the proposed diagnostic system.
The training of Multi Layer Perceptron network is achieved by modifying the connection weights and biases iteratively to optimize a performance criterion. The performance criterion is the minimization of the Mean Square Error (MSE) between the actual network output and the corresponding target values in the training set. The training algorithms for Multi Layer Perceptron are based on Back Propagation (BP). The Back propagation adapts a gradient descent approach by adjusting the ANN connection weights. The Mean Square Error is achieved through Back Propagation in the network and is used to adjust the connection weights between the layers, thus improving the network classification performance. This process is repeated until the overall Mean Square Error value drops below some predetermined threshold shown in Fig. 41. After achieving the training process, the ANN weighs are fixed and the system is deployed to solve the journal bearing condition identification problem using unseen vibration data.
Fig. 40Architecture of ANN
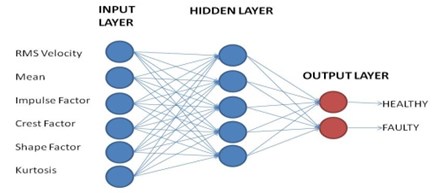
Fig. 41ANN training process
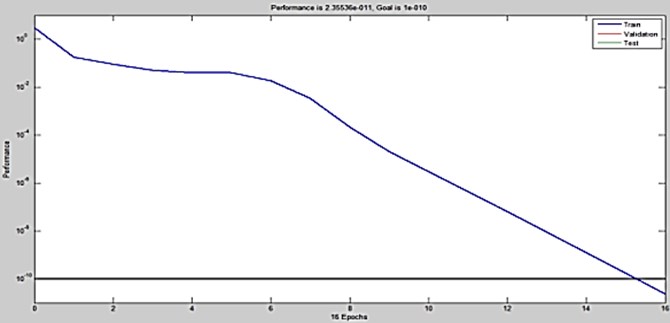
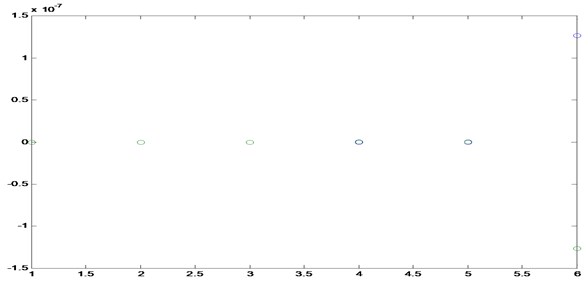
The Artificial Neural Network (ANN) was created, trained and tested using MATLAB Neural Network Toolbox with Levenberg-Marquarat Back Propagation (LMBP) training Algorithm. In this work, statistical features like mean, impulse factor, shape factor, crest factor, kurtosis and Root Mean Square (RMS) of vibration signals are used as input elements to the ANN and MSE of 10E-10, a minimum gradient of 10E-10 and maximum iteration (epochs) of 1000 were used. The training process would stop if any of these conditions were met. The initial weights and biases of the network were randomly generated by the program. The ANN needs only 16 epochs to reach the required goal of 10-10 MSE. The MSE for the testing process is shown in Fig. 42. The Fig. 42 shows the error simulation along -axis and classification of MSE along -axis. The Neural Network test process for unseen vibration data of the trained ANN combined with the ideal output target values is presented. This indicates the high success classification rate of 100 % for journal bearing fault detection and classification.
Fig. 42ANN Testing process
6. Conclusion
The test rig shows a complex structure, if there is any excitation, it will move around the structure. The most common sources of internal and external excitation identified in the experimental set up are; the coupling, the eccentricity of the shaft, the eccentricity of pulleys, the belt pitch variation causing angular acceleration and deceleration, the AC electronic motor, the ball bearing, etc. All these vibrations can be controlled by enveloping the Butterworth filter with time domain signal where sources of internal noise and external noise is removed and it will give only vibration spectra of the journal bearing by allowing some frequencies in pass band and stopping others. From these studies, in high rotational speed machines, it is more advantageous to use Butterworth filter technique rather than the traditional ones because the results obtained through FFT were not capable of detecting the fault in the journal bearing test rig. The enveloped Butterworth filter PSD proved to be a valuable tool in conjunction with routine vibration data to provide a more complete picture of the health of the rotating machinery. Thus the condition monitoring provides more effective in early diagnosis of bearing faults. The results show that various fault vibration signals and the fault detection rate of the proposed method is more superior than that of FFT. Hence this Butterworth filter technique will produce considerable savings by reducing unwanted external and internal noises of machinery so a company can get the full benefit from condition monitoring.
The various signal processing methods adopted for journal bearing vibration analysis is presented in this paper. Bearing fault diagnosis based on vibration signal processing techniques using FFT and Butterworth filter enveloped power spectrum are implemented and the results are compared for various stages of induced defect conditions. From the studies conducted both FFT, and Butterworth filter based enveloped power spectrum shows their prominence in extracting the bearing defect peaks at BF are compared to traditional FFT analysis. Further, the study shows significant change of trend in vibration amplitude at BF. Further, filter coefficients provide provision for statistical features of signal which can be used as inputs to ANN. The result of the learning process of the proposed ANN shows that the training with 16 iterations met the MSE stopping criteria (MSE less than 10E-10). The test process for unseen vibration data of the trained ANN combined with the ideal output target values indicates the high success rate for automated bearing fault detection. The accuracy of various conditions of the journal bearing was 100 % on both training and testing process.
References
-
Ahmadi H., Moosavian A. Fault diagnosis of journal bearing of generator using power spectral density and fault probability distribution function. Proceedings of the 1st International Conference of Innovative and Computing Technology, Springer-Verlag, Berlin, 2011, p. 30-36.
-
Igarishi T. Hiroyoshi Studies on vibration and sound of defective rolling bearing. Bulletin JSME, Vol. 25, Issue 204, 1980, p. 994-1001.
-
Moosavian A., Ahmadi H., Tabatabaeefar A. Condition monitoring of engine journal bearing using Power Spectral Density and support vector machine. Elixir International Journal, Elixir Mech. Engg. Vol. 43, 2012, p. 6631-6635.
-
Kay S. M. Modern spectral estimation. Printice Hall Signal Processing Series, Engle wood Cliffs, New Jersey, 1988.
-
Haloui N., Chikouche D., Benidir M., Bekka R. E. Diagnosis of gear systems by spectral analysis of vibration signals using synchronous cepstre technique. ESTS International Transactions on Communication and Signal Processing, Vol. 8, Issue 1, 2006, p. 27-36.
-
Jack L. B., Nandi A. K. Fault detection using support vector machines and artificial neural network augmented by genetic algorithms. Mechanical systems and Signal Processing, Vol. 16, 2002, p. 37-390.
-
Kay S., Marpele S. L. Spectrum analysis: A modern perspective. Procedding of IEEE, Vol. 69, Issue 11, 1981, p. 1380-1419.
-
Richa Gupta, Onkar Chand Analysing Chebychev filter for displaying radar target track. International Journal of Engineering Research and Applications, Vol. 2 Issue 6, 2012, p. 326-329.
-
Challis R. E., Kitney R. I. The design of Butterworth and Chebychev filters. Journal of Biomedical engineering, Vol. 5, 1983, p. 91-102.
-
Rafieea J., Arvania F., Harifib A., Sadeghic M. H. Intelligent condition monitoring of a gearbox using artificial neural network. Mechanical Systems and Signal Processing, Vol. 21, 2007, p. 1746-1754.
About this article

