Abstract
Electric motors play an important role in industry, and the induction motors are the most widely used among them. Any motor failure interrupts the process, causes loss of productivity, and may also damages to other machinery. Therefore, to prevent sudden failure of motor (such as on the large or critical motor) it is essential to have an early fault detection mechanism. The work presented in this paper is concerned with the detection of the mechanical faults in three phased induction motors. Motor current signal analysis (MCSA) is used in identification of artificially induced mechanical faults, and it is also supported with vibration signal analysis. The most common mechanical problems; mechanical unbalance, shaft misalignment, and bearing failures are investigated experimentally. The efficacy of MCSA based monitoring for the detection of mechanical faults is demonstrated. Matlab based an automatic peak detection algorithm is also used in this study for determination of changes in signal spectrums.
1. Introduction
Condition monitoring of induction motors traditionally involves vibration measurement to detect mechanical failures, and MCSA to determine electrical faults. In vibration analysis, there are some disadvantages such as the influence of the transmission path, the effect of certain resonance frequencies on the original vibration signal and mechanical connection of the transducer [1]. Therefore studies [2-4] are focusing on MCSA to detect mechanical faults without utilizing any additional expensive sensor. Current monitoring can be used in this way as a predictive surveillance technique, with conventional vibration analysis being used to confirm the fault diagnosis before a motor is removed for maintenance. Current monitoring is well suited for continuous machine monitoring, especially if direct access to the machine is not possible (e.g. underground pumps), and for machines in hazardous, noisy, or difficult environments where vibration or acoustic noise measurement may be difficult to obtain.
The monitoring and analysis of motor current signal provide an indirect method of determining mechanical faults because it does not require physical access to motor. The motor itself is used as a transducer to identify any change. Therefore, it is an attractive method. Considerable efforts has been put into detection of air-gap eccentricity and broken rotor bars by previous researches [5-6]. Detection of the mechanical defects is shown by the frequency domain analysis of the phase current and neutral currents. It is implemented by a visual reading of the patterns that correspond to each type of anomaly [7]. Stator winding, bearing, and misalignment faults are diagnosed by monitoring current, speed and temperature signals in that research work. The validity of neural network based fault detection of the single phase induction motor is shown in the research [8].
A recent work proposes a microcontroller based system to detect the change in signature of the motor current and wirelessly transmit it to the control room, where it get analyzed for diagnosing any mechanical or electrical fault [9]. A novel approach of Hurst analysis is also applied to artificially aged bearing of induction motor using vibration signals [10, 11].
As an indicator of an induction machine’s health, vibration, thermal and electrical monitoring techniques are all utilized. There is a demanding challenge to detect mechanical faults by using advanced signal processing techniques. A versatile, noninvasive, cost effective means of detecting common mechanical faults with minimal use of special sensors are still essential in industry.
2. Experimental setup
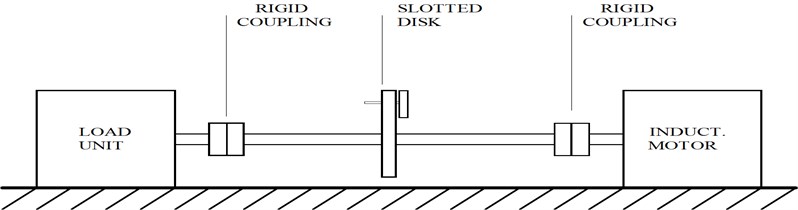
The test setup comprises a test rig, data collection system, signal conditioning circuits, and signal analysis system. A test rig is designed to demonstrate mechanical failures. It is bolted on a machined flat metal surface to ensure a well aligned and balanced system. The motor under test is connected via two rigid couplings to an eddy current loading unit (an adjustable magnetic type of loading) (see Figure 1). A slotted disk is used to introduce unbalance fault, and fitted to the main shaft with the help of three grub screws. Misalignment is created by forcing the motor plate to move horizontally by adjusting screws. In the test rig, a three phased, 50 Hz, 440 V, four pole, high slip induction motor is used for all tests. An optical encoder attached on the shaft end of the motor measures the speed of the system.
Fig. 1Experimental test rig
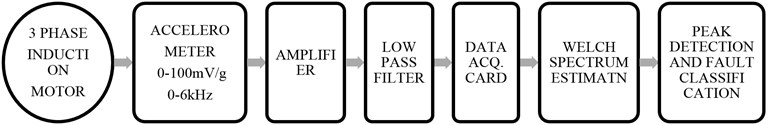
Block diagram of the experimental circuit for the vibration signal is shown in Figure 2. Vibration measurement is made using a piezoelectric type of accelerometer (0-6 kHz).
Fig. 2Block diagram of the experimental circuit for vibration signal analysis system
Analyzing motor current signature by utilizing experimental setup is shown in Figure 3.
Fig. 3Motor current signal analysis system
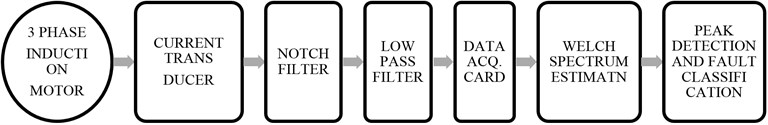
The accelerometer and current signals require amplification and filtering by signal conditioning circuits. The first step in both signal analyses is to examine the frequency spectra of healthy and faulty motor signals to distinguish fault. Each phase current and accelerometer signal is digitized simultaneously and recorded using Lab-PC data acquisition board. The frequency resolution in spectrum is 0.25 Hz. To prevent aliasing in data fourth order switch capacitor low pass filters are used for both signals. The analysis of motor current is complicated by the supply frequency. Thus, it is eliminated by 4th order notch filter. Data segmentation and ensemble smoothing procedure are used to increase the signal to noise ratio. It is implemented on PC using Matlab. Signal analysis is based on Welch's Method. Basically, in this spectrum estimation algorithm the following steps are used to transform a time-based vector into a frequency-based vector:
– The data is broken up into user-specified sections. The sections are de-trended, removing linear trends (including the DC component).
– The sections are windowed using a Hanning window.
– The FFTs of the de-trended, windowed sections are taken.
– The magnitude of the FFTs are averaged together and normalized by the square of the norm of the Hanning window, to generate an asymptotically unbiased estimate. The averaging in this process causes the variance of the spectrum to be diminished by a factor of . This lowers the floor of random noise in the signal, making it easier to pick out deterministic components.
3. Fault detection algorithm
It is performed by processing the power spectrum of both motor current and vibration signals using peak detection algorithm. Firstly, the spectrum is scanned for detection of all peaks between fundamental rotor speed and maximum frequency within the 6 Hz bandwidth. In this detection, the frequency and actual amplitude of peaks are determined by interpolation. The principle idea is explained shortly in Eq. (1)-(3); index of the actual and discrete maximum is equal for a leaking spectrum [12].
where maximum peak in given bandwidth. The actual peak frequency is then:
where frequency resolution. Actual peak amplitude is given below if equals :
Secondly, the peaks if they are bigger than a minimum height (–30 dB) and exceed a minimum peak height (10 dB) above noise level are detected. After removing the irrelevant supply harmonics, remaining peaks are saved. When the periodicity is removed, useful information for change detection may be highlighted. Final step is the comparison with next set of peaks for different fault conditions. If the difference between two peak heights is bigger than 6 dB, and signal power is bigger than threshold then, a fault is indicated. In this algorithm, the fundamental and harmonics of rotor speed are easily detected for trend analysis purposes. Moreover, this algorithm enables us not only detect the fault but also predicts the severity of fault in motor.
4. Detection of shaft misalignment and test results
There are three forms of misalignment: 1 – Coupling misalignment, 2 – Bearing misalignment, 3 – Bent shaft. It is measured according to a relative position of shafts or their couplings. Position of two shafts with parallel misalignment is shown in Figure 4. B and C imply drive end bearings, and A and D show the non drive end bearings.
There is a load increase on bearings A and C and a decrease on bearings B and D. The forces F will act on the couplings. It is important to understand the nature of the fault mechanism. It causes rotor preloading in radial direction, like a constant radial force which pushes the rotor to the side. The directional force is applied to the rotating shaft through the coupling element. A normal shaft radial motion in a bearing is going to be a circle or an ellipse but any preloading distorts this basic elliptical pattern to banana shaped or figure “8” shaped. It is apparent that the occurs simply because the shaft is pushed back toward the force twice per revolution. Thus, it produces higher dynamic air gap eccentricity and is possible for the rotor to become bowed. It is diagnosed by monitoring following frequency component (refer to Eq. (4)) in the supply current [6].
Fig. 4Parallel misalignment [13]
![Parallel misalignment [13]](https://static-01.extrica.com/articles/15126/15126-img4.jpg)
where – integer (1, 2, ...), – the order of the stator MMF harmonics (1, 3, 5, ...), – number of rotor slot, – pole pairs, – eccentricity order ( for dynamic, for static eccentricity), – motor slip, – supply current frequency.
The Eq. (4) is derived from the MMF permeance wave approach and the experimental results are proved analytically by [14]. This component occurs at relatively high frequency interval and requires knowledge of the number of rotor slots in advance. Therefore, it is easier to monitor the frequency components shown in Eq. (5):
where – supply current frequency (Hz) and – rotor speed (Hz or rev/s).
Fig. 5Motor current spectrums at no load
Motor supply current frequency, rotor speed, motor slip, and other vibrational frequency components can be extracted from the frequency domain analysis of current. The motor current is modulated by rotor speed and contains large supply harmonics. Therefore, rotor speed appears as sidebands around carrier frequency. Although classical motor theory claims that these sidebands should not exist, in practice they are induced in supply current because the motor is not completely symmetrical (electrically or magnetically). It has been verified experimentally that these components can be seen in the stator current signal as in Figure 5. Magnitudes of these eccentricity components () increase as the fault level increases and are independent of load level. On motor current signal, Figure 6, there is clear increment on the eccentricity components particularly at (). It is also verified by motor vibration signal, Figure 7, at .
Fig. 6Zoom spectrum around 75 Hz
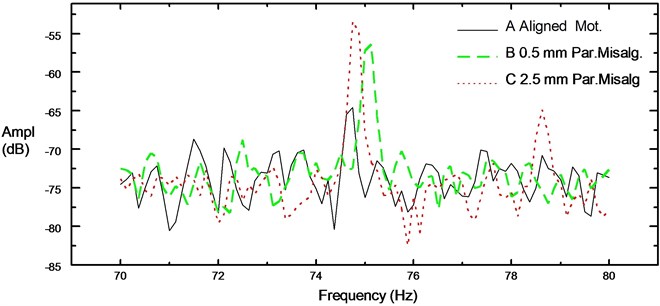
Fig. 7Vibration spectrums in radial direction at no load
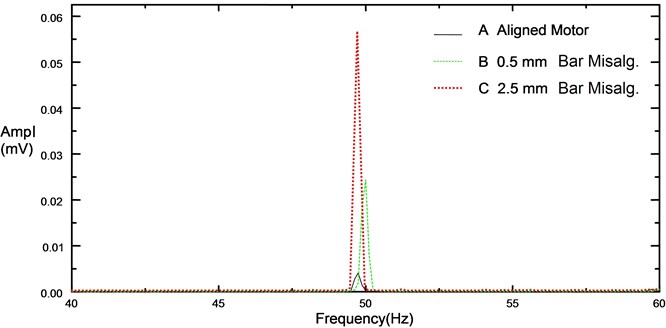
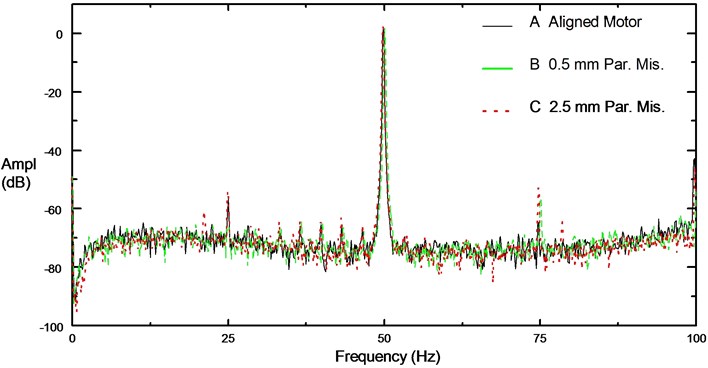
Fig. 8Comparison of stator current spectrums for unloaded 4 pole induction motor
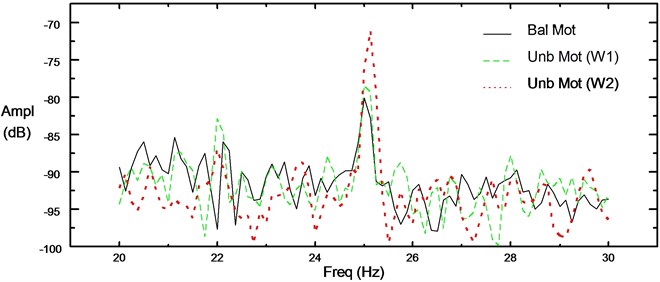
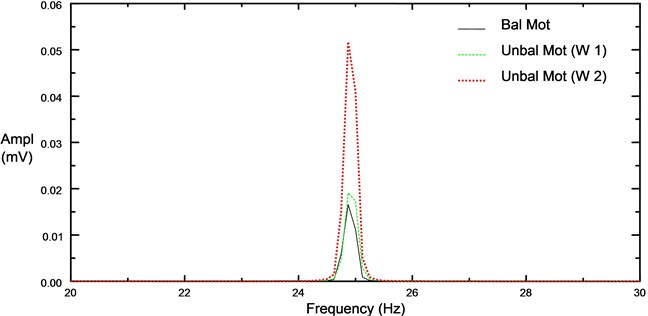
Fig. 9Comparison of vibration spectrums for unloaded 4 pole induction motor
5. Detection of mechanical unbalance and test results
Mechanical unbalance is simulated using a slotted disk. It produces significant dynamic load. In the test rig, a mass is fixed on the disk to produce unbalance force. The resulting spectrums, Figure 8 and Figure 9, prove that the fault indicator is the fundamental frequency of rotor speed. It is a linear problem and also speed dependent.
6. Detection of outer race defect on the bearing and test results
Bearings are essential part in the every type of rotating machinery. Several factors from lubrication to load conditions may severely shorten their lifetime. For the monitoring of the localized bearing defect on the outer race, frequency component is calculated according to the dimensions of bearing and rotor speed. In the experiment this type of fault is introduced by drilling a 3 mm hole through the outer race of drive end bearing (NSK 6206). Calculated rotor speed () and outer race defect frequency component () are 24.95 Hz and 89.19 Hz respectively.
To understand how the bearing fault progresses with time it requires to know symptoms of each stage. Bearing defect frequency (BDF) exists only if the bearing is actually defective. In detection stage, existence of BDF indicates the fault and location; harmonic content and amplitude indicates seriousness of the fault. Since amplitudes and harmonics of BDF are both important, it is not reliable only to monitor the amplitude level alone.
Any bearing fault in a motor causes a small radial movement of the rotor in the bearing housing. This mechanical displacement between the rotor and stator produces air gap modulation. This is actually a kind of air gap eccentricity. Eccentricities of the rotor and bearing wear cause a periodic load torque variation at the rotor speed. Variation in the air gap flux density due to this eccentricity produces frequency components (given in Eq. (6)) related to bearing defect [4].
where is the supply frequency, and is one of the bearing defect frequencies. This mechanical load variation will result in simultaneous cyclic amplitude and frequency modulations of the motor current.
Here it is some experimental results for the bearing faulty motor. From Figure 10, there is clear increase on vibration level for the bearing fault (defect on the outer race) which is plotted in dotted line. The main indicator of the fault in the vibration spectrum is all harmonics of outer race defect frequency (90 Hz) due to the modulations. It is also verified that the defect frequency harmonics are increasing with speed and bearing load as shown in Figure 11.
Fig. 10Comparison of spectrums for vibration signal
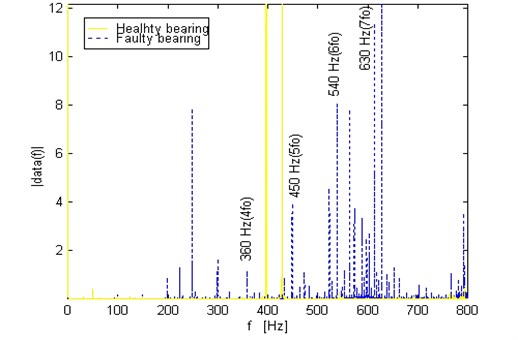
Fig. 11Spectrum of the vibration signal for bearing faulty motor under large radial load
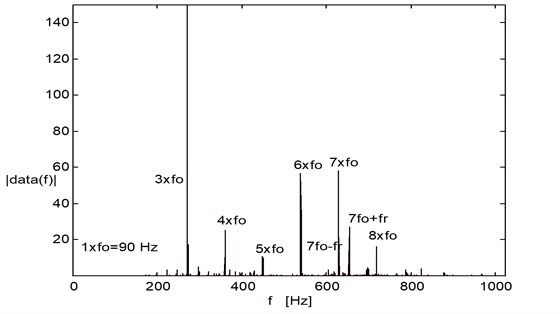
In Figure 11, it is shown that how the amplitude of fundamental and harmonics of outer race defect frequency components increase when the bearing load increases.
The influence of the fault on motor current is determined using the difference of peak amplitude and peakheights between healthy and faulty current spectrums by the peak detection algorithm on certain frequency components (see Figure 12).
Fig. 12Comparison of the spectrum for motor current signals
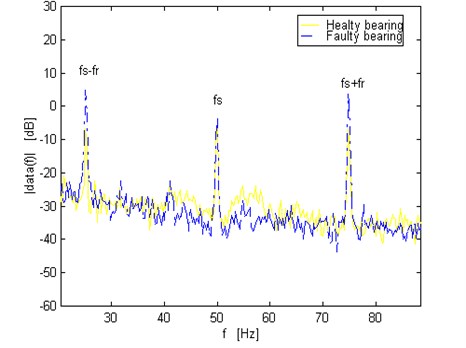
In Figure 12, it was demonstrated that this fault generates a noticeable increment on components (given in Eq. (6)) around fundamental supply frequency in stator current spectra.
7. Critical appraisal of the results
The measurement of rotor speed is an important parameter for automatic identification of fault indicator components. It is calculated as the difference between supply frequency and the highest peak in the range of 24-28 Hz for motor used in the experiments. In case of any difficulty for the detection, it should be determined by tracking rotor slot-passing frequency component, or by monitoring the speed component in the vibration signal. To quantify the fault severity, the change in the background noise level in the motor current spectra can be used for the detection of bearing fault. The increase in the background noise level of current spectra from bearing fault is associated with the continuous torque impulses from damage to outer race surface. The significant increase in noise occurs at the later stages of bearing wear.
This paper has produced the following contributions to current based detection of mechanical faults in induction motors:
It is essential to itemize all frequency components within the spectrum. Accuracy of calculation of peak frequencies and amplitudes is important for finer frequency resolution. To do this, an automated peak detection algorithm is developed for the fault detection system. Bearing fault, shaft misalignment, and mechanical unbalance are diagnosed.
Detection of a faulty bearing can be implemented by monitoring the background noise level of the spectrum when the bearing dimensions are unknown. Monitoring the background noise level in the current spectra can be also used to separate bearing faults from eccentricity. Misalignment and mechanical unbalance are distinguished by observing the appearance of fundamental sidebands or harmonics around supply frequency. Mechanical unbalance produces only fundamental sidebands. On the other hand, misalignment produces other harmonic sidebands due to the interaction of machine fluxes, torque and load. However, the developed algorithm cannot distinguish between parallel and angular misalignment. This may require monitoring sideband frequencies around the rotor slot passing frequency. The appearance of both () and slot passing frequency components at the same time offers a good method of distinguishing between fault types due eccentricity, broken rotor bars.
8. Conclusions
Although induction motors are rugged and robust, they are not hundred percent reliable and failures still occur. MCSA method has been tested for predicting mechanical failures of motor using Matlab based signal processing routines. The work is supported with experimental results.
It should be noted from current spectrums the predicted current components was small compare to large supply harmonics. Therefore it is important in the spectrum analysis to recognize those small changes. It is the key part of signal analysis in detection algorithm. The magnitude of the outer race defect is the strongest compare to other type of bearing faults. That’s why it is more predictable. Sensitivity to bearing faults remains an unresolved issue. Further study is underway to identify different kind of bearing faults and increase the sensitivity with any kind of supply.
References
-
Bate A. H. Vibration Diagnostics for Industrial Electric Motor Drives. Bruel & Kjaer Application Note.
-
Farag S. F., Bartheld R. G., Habetler T. G. An integrated, on-line, motor protection system. IEEE Industry Applications Society Annual Meeting, 1994, p. 117-122.
-
Schoen R. R., et al. Motor bearing damage detection using stator current monitoring. IEEE Industry Applications Society Annual Meeting, Vol. 1, 1994, p. 110-116.
-
Schoen R. R., et al. An unsupervised, on-line system for induction motor fault detection using stator current monitoring. IEEE Industry Applications Society Annual Meeting, Vol. 1, 1994, p. 103-109.
-
Thomson W. T. On-line current monitoring to detect rotor winding and electromechanical problems in induction motor drives. IEE Colloquium on Condition Monitoring of Electrical Machines (Digest No. 1995/019), p. 8/1-6.
-
Thomson W. T., Rankin D., Dorrell D. G. On line current monitoring to diagnose airgap eccentricity in large three-phase induction motors – industrial case histories verify the predictions. IEEE Transaction on Energy Conversion, Vol. 14, Issue 4, 1999, p. 1372-1378.
-
Shahjamal Khan A. A., et al. Monitoring and detecting health of a single phase induction motor using data acquisition interface (DAI) module with artificial neural network. WSEAS Transactions on Systems and Control, Vol. 9, 2014, p. 229-237.
-
Naseer A., Raghied A. Cost-effective wireless-controlled motor failure prediction for HVAC system in large buildings using demodulated current signature analysis. Life Science Journal, Vol. 11, Issue 10s, 2014, p. 33-39.
-
Bouras A. K., et al. Investigation on the diagnosis of simple and combines mechanical faults in asynchronous motor based electric drives. American Journal of Applied Sciences, Vol. 11, Issue 6, 2014, p. 994-1004.
-
Šiljak H., Subasi A. A novel approach to Hurst analysis of motor vibration data in aging processes. Journal of Vibroengineering, Vol. 16, Issue 5, 2014, p. 2244-2250.
-
Šiljak H., Şeker S. Hurst analysis of induction motor vibrations from aging process. Balkan Journal of Electrical and Computer Engineering, Vol. 2, Issue 1, 2014, p. 16-19.
-
Beuschel M. Detection of Faults in Centrifugal and Positive Displacement Pumps by Digital Signal Analysis of Flow and Pressure Measurements. Final year project, University of Sussex, 1996.
-
Gurevich G. Misalignment and vibration. The Shock and Vibration Digest, Vol. 28, Issue 2, 1996, p. 15-1.
-
Sahraoui M., et al. Dynamic eccentricity in squirrel cage induction motors – simulation and analytical study of its spectral signatures on stator currents. Simulation Modelling Practice and Theory, Vol. 16, 2008, p. 1503-1513.
About this article

