Abstract
This paper aims to quantify the adverse effects of contact type sensors on modal parameters of lightweight structures and to present a practical way for identification of modal parameters of structures with minimal sensor effects. The adverse effects of a contact type sensor on natural frequencies, damping levels and mode shapes are explored using the theoretical model of a typical beam-like sample carrying a sensor and a controlled experimental study based on measurement of frequency response functions using non-contact excitation and response sensors. The half-power and circle fit modal identification methods are used to extract modal parameter from measured data. The experimental and theoretical modal analysis results are evaluated, and a practical methodology based on classical acoustic and vibration frequency response functions is suggested to identify modal loss factors and natural frequencies of lightweight structures with minimal sensor effects.
1. Introduction
Mechanical properties such as Young’s moduli and damping levels of materials are frequently identified using measured modal parameters of some typical lightweight test samples such as beams and plates [1]. In addition, modal parameters of lightweight engineering structures such as satellite components often need to be determined via experimental modal analysis [2]. On the other hand, the accuracy of measured modal data of a test structure is adversely affected by mass loading, stiffness and damping effects of sensors especially when the mass (or effective modal mass) of the structure is small. Although, there are some standard methods based on frequency response function measurements using non-contact sensors for identification of mechanical properties of materials [1], these standard methods may not be appropriate for identification of some materials such as non-ferromagnetic ones or for identification of the test samples that are beyond the specified dimensions in the method [3] and the engineering structures that are different from beam and plate test samples. The damping of sandwich samples may be quite high and it may not be possible to measure the response data due to damping, so there may be need to utilize some other test samples that can not be tested using these test samples. The test rigs of these standard methods may also be very complicated [4] and there may be also the adverse effects of non-contact sensors [5]. The accelerometers are the most traditional and widely used sensors employed in experimental modal analysis; they have many advantages (i.e., frequency span covered, dynamic amplitude range, cost) over other techniques such as laser vibrometer [6]. However, it should be noted that the adverse effects of contact type sensors can be quite huge and misleading [2, 7, 8]. Overall, there is a need to measure the modal properties of both lightweight test samples and engineering structures using conventional (low-cost) sensors such as accelerometers and microphones with minimal sensor effects in an effective way in practice.
The outline of this paper is as follows. The adverse effects of a contact type sensor on natural frequencies, damping levels and mode shapes are first investigated using the theoretical model of a typical beam-like (test) sample carrying a sensor, and the errors in the modal parameters are quantified as a function of sensor position. The damping of the structure is modelled by using the complex Young’s modulus approach while the sensor is modelled by using a solid element; the sensor is assumed to be rigidly joined to the structure as it is desired in the practical measurements. Then, a controlled experiment based on frequency response function measurements using non-contact excitation and response sensors is designed to study adverse sensor effects experimentally. Various modal identification methods such as half-power and circle fit are used to extract modal parameter from measured data. The experimental and theoretical modal analysis results are evaluated, and a practical methodology based on classical acoustic and vibration frequency response functions is suggested to identify modal loss factors and natural frequencies of lightweight structures with minimal sensor effects. The results presented in this paper can be used in various fields to minimize the adverse effects of sensors and to identify the correct modal parameters of structures in an effective way in practice.
2. Theoretical study
Mechanical properties of typical materials are frequently identified via the modal data measured using beam test samples [1, 3] while the beam samples are quite lightweight in most cases. The Boundary Conditions (BCs) of the beam samples are preferred to be free-free in practice as the damping and stiffness effects of the BCs are eliminated by this way. Considering the practical use of beam samples, a lightweight beam-like structure carrying a sensor is studied in this section.
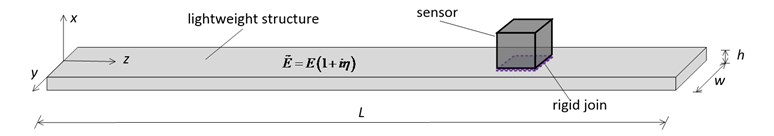
The beam-like structure is modelled using 4-node shell finite elements. The shell element used here has physical “drilling” degrees of freedom in the element normal direction, which is validated to predict the modal behavior of thin and thick shell structures with high accuracy [9]. The damping of the structure is modelled by using the complex Young’s modulus approach as where is the storage Young’s modulus, is loss factor, is viscous damping ratio and . The sensor is modelled by using a solid element (both the mass and mass moment of inertia of the sensor is included); the sensor is assumed to rigidly join to the structure as it is desired in practical measurements. The schematic of the model of the beam-like structure carrying a sensor is shown in Fig. 1 where and show the position (the center of the bottom surface) of the sensor along the long and short edges of the structure, respectively.
Fig. 1Schematic of the model of a beam-like structure carrying a sensor
The natural frequencies () and modal loss factors () for a damped system are obtained by solving the complex eigenvalue problem given by:
where and are the stiffness and mass matrices of the assembly of the beam-like structure and the sensor, respectively. Here matrix is complex, representing non-proportional damping distribution. The complex eigensolution is obtained here by using Subspace Iteration Method [10] and the solution of the eigenvalue problem above yields:
where and are complex eigenvalues and mode shapes (eigenvectors), respectively. By defining , and are given as:
The length, width and thickness of the lightweight structure studied here are 300, 20 and 3 mm, respectively. The side length of the cubic shape sensor is 10 mm. The Young’s modulus, loss factor and density of the material of the structure are 50 GPa, 0.05 and 4000 kg/m3, respectively. The corresponding values for the sensor material are 200 GPa, 0 and 4000 kg/m3, respectively. The Poisson’s ratio is assumed to be 0.3. Overall, the mass of the sensor is 4 g while the mass of the structure is 72 g where 18 here.
The analyses are first conducted for the structure without carrying a sensor (actual case). After that, the analyses are conducted for the structure carrying a sensor (modified structure) for various positions of the sensor ( or values). Here, the sensor is placed at midspan along the short edge of the structure ( 0) for all z values. As the structure and the BCs are symmetrical and the deflections of the structure for 0 to 150 mm are the same with the results for 300 mm to 150 mm, the analyses are conducted only for the sensor positions 10 to 150 mm with a spatial resolution 10 mm (i.e., 10, 20, 30, …, 150 mm). Comparison and correlation of data sets of the structure without and with a sensor are performed in terms of natural frequencies, loss factors (damping levels) and mode shapes. The mode shapes of a structure without and with a sensor are compared using Modal Assurance Criteria (MAC) given as [2]:
where is the reference mode shape vector, is the mode shape vector compared with the reference one and indicates the transpose of a vector. Here, the first eight modes (include at least 1 bending, 1 in-plane bending and 1 torsional modes) of the structure are examined.
Table 1The modal parameters of the beam-like structure (under free-free BCs) without a sensor
Mode | (Hz) | |
Type (, ) | ( 0.05 for all modes) | |
1 | Bending (3,1) | 121.2 |
2 | Bending (4,1) | 334.1 |
3 | Bending (5,1) | 655.3 |
4 | In-plane Bending | 797.9 |
5 | Torsional (2,2) | 1055.9 |
6 | Bending (6,1) | 1084.0 |
7 | Bending (7,1) | 1620.4 |
8 | Torsional (3,2) | 2118.3 |
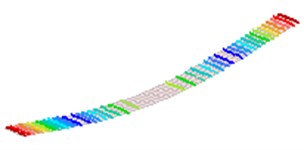
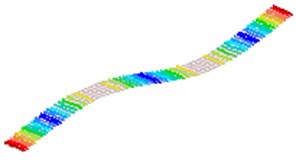
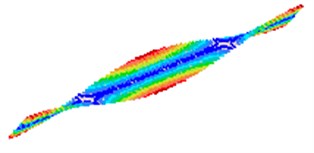
The modal parameters of the structure without a sensor are listed in Table 1, where indicates the mode number and and are the number of half-waves in a mode shape along the long and short edges of a structure, respectively. It is seen that the loss factor is equal to 0.05 for all modes as expected. The first eight mode shapes of the structure without a sensor are given in Fig. 2. The natural frequencies of the structure with a sensor for various values and corresponding MAC values are listed in Table 2. The loss factors () do not change when an additional sensor is attached to the structure (for any values) as long as the sensor is rigidly connected to the structure (as it is desired in practice). The natural frequencies and mode shapes change with sensor position as expected. The shapes of the bending modes (1st, 2nd, 3rd, 6th and 7th modes) do not seriously affected by an additional sensor; the MAC values of these modes are greater than 0.99 for any values in the frequency range of interest. The in-plane bending mode (4th mode) deviates from the actual mode when the sensor is placed to the positions where the deflections are large (or when the sensor is far from anti-nodes) for the individual mode. The MAC values for all modes and values are summarized in Fig. 3. It is seen that the mode sequences of the torsional 5th and 8th modes interchange with the sequences of 6th and 9th (or 10th), respectively.
Fig. 2The first 8 modes of a beam-like structure without a sensor (under free-free BCs)
a) 1
b)2
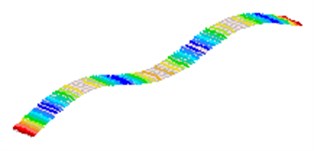
c)3
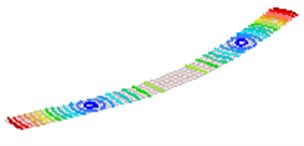
d) 4
e)5
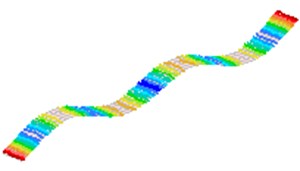
f) 6
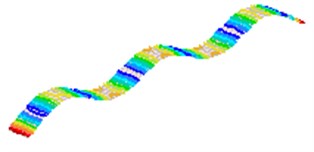
g) 7
h) 8
Fig. 3The MAC values for a) z= 10 and 20 mm, b) z= 30 mm, c) z= 40 mm and 50 mm where r= 8, z= 60 and 90 mm where r= 9 and z= 70 and 80 mm where r= 10 and d) z= 100 and 110 mm where r= 9 and z= 120, 130, 140 and 150 mm where r= 8 for the beam-like structure under free-free BCs and y= 0
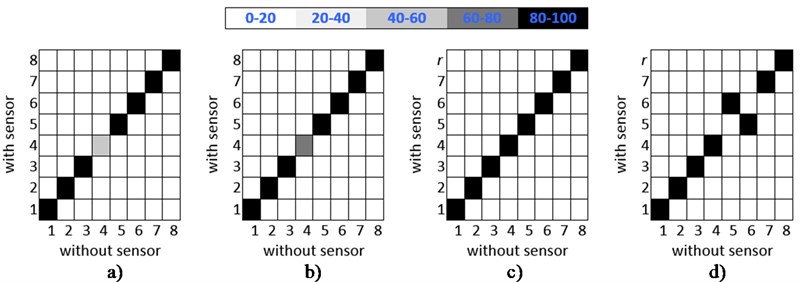
Table 2The modal parameters of the beam-like structure (under free-free BCs) carrying a sensor for various sensor positions (z/L) and corresponding MAC values (ηr= 0.05 for all modes and z/L values) where y= 0
(Hz) | MAC | (Hz) | MAC | (Hz) | MAC | (Hz) | MAC | ||||
1 | 113.6 | 99.7 | 1 | 115.9 | 99.8 | 1 | 119.3 | 99.9 | 1 | 120.4 | 100.0 |
2 | 319.2 | 99.3 | 2 | 326.9 | 99.8 | 2 | 333.4 | 100.0 | 2 | 332.0 | 100.0 |
3 | 633.3 | 99.1 | 3 | 648.0 | 99.9 | 3 | 647.0 | 99.9 | 3 | 637.4 | 99.8 |
4 | 747.4 | 51.5 | 4 | 762.8 | 59.2 | 4 | 786.4 | 81.0 | 4 | 794.0 | 91.8 |
5 | 1005.0 | 99.3 | 5 | 1006.6 | 99.3 | 5 | 1014.8 | 99.4 | 5 | 1021.4 | 99.4 |
6 | 1054.7 | 99.0 | 6 | 1075.1 | 99.9 | 6 | 1053.3 | 99.5 | 6 | 1045.1 | 99.3 |
7 | 1581.8 | 98.9 | 7 | 1603.4 | 99.9 | 7 | 1566.6 | 98.9 | 7 | 1578.1 | 99.0 |
8 | 1985.6 | 92.6 | 8 | 2031.9 | 96.3 | 8 | 2111.2 | 98.6 | 8 | 2132.6 | 93.9 |
) | |||||||||||
(Hz) | MAC | (Hz) | MAC | (Hz) | MAC | (Hz) | MAC | ||||
1 | 120.9 | 100.0 | 1 | 121.1 | 100.0 | 1 | 120.2 | 100.0 | 1 | 119.4 | 100.0 |
2 | 328.6 | 99.9 | 2 | 324.7 | 99.9 | 2 | 320.3 | 99.9 | 2 | 320.9 | 99.8 |
3 | 630.9 | 99.7 | 3 | 631.0 | 99.6 | 3 | 645.2 | 99.7 | 3 | 651.9 | 99.9 |
4 | 798.6 | 98.6 | 4 | 800.4 | 99.9 | 4 | 797.2 | 93.9 | 4 | 793.6 | 90.8 |
5 | 1029.6 | 99.4 | 5 | 1039.1 | 99.4 | 5 | 1060.5 | 99.4 | 6 | 1071.2 | 99.4 |
6 | 1052.3 | 99.3 | 6 | 1067.3 | 99.6 | 6 | 1074.2 | 99.8 | 5 | 1056.8 | 99.5 |
7 | 1600.9 | 99.7 | 7 | 1607.9 | 99.9 | 7 | 1559.5 | 99.2 | 7 | 1561.6 | 99.2 |
9 | 2184.6 | 98.3 | 10 | 2204.7 | 98.7 | 9 | 2197.7 | 99.0 | 9 | 2173.2 | 98.3 |
(Hz) | MAC | (Hz) | MAC | (Hz) | MAC | (Hz) | MAC | ||||
1 | 118.6 | 100.0 | 1 | 117.9 | 100.0 | 1 | 116.9 | 100.0 | 1 | 116.7 | 100.0 |
2 | 323.2 | 99.8 | 2 | 326.5 | 99.8 | 2 | 332.6 | 100.0 | 2 | 333.6 | 100.0 |
3 | 653.0 | 100.0 | 3 | 647.2 | 99.8 | 3 | 629.0 | 99.7 | 3 | 625.7 | 99.8 |
4 | 789.6 | 88.6 | 4 | 785.9 | 87.2 | 4 | 780.9 | 86.1 | 4 | 780.2 | 86.0 |
6 | 1081.1 | 99.5 | 6 | 1089.6 | 99.6 | 6 | 1100.3 | 99.8 | 6 | 1101.7 | 99.8 |
5 | 1041.1 | 99.5 | 5 | 1039.7 | 99.6 | 5 | 1070.4 | 99.7 | 5 | 1078.7 | 100.0 |
7 | 1586.5 | 99.4 | 7 | 1607.5 | 99.9 | 7 | 1571.8 | 99.3 | 7 | 1557.0 | 99.5 |
9 | 2150.0 | 96.5 | 8 | 2033.8 | 95.4 | 8 | 1999.0 | 98.7 | 8 | 1993.8 | 99.0 |
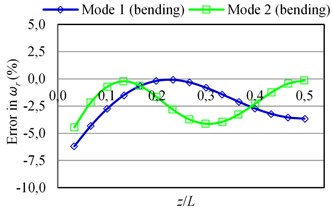
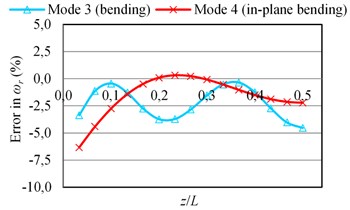
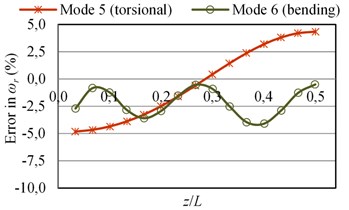
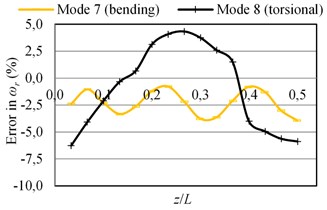
The errors in the natural frequencies () as a function of the given sensor position () are plotted in Fig. 4. It is seen that the error values are always negative for all bending modes; the mass loading effect of the sensor is dominant and the stiffness effect is low. However, the error values can be quite greater than zero for the torsional modes for some values. The increases in the natural frequencies of torsional modes (also the change of mode sequences) are due to stiffening effect of the connection of a sensor to the structure.
Here, the analyses were also performed when 5 mm (the sensor is not at midspan along the short edge) although the results are presented here for brevity. The results showed that the MAC values for 5 mm can be quite different from the MAC values obtained when 0. The MAC values for bending modes are in general lower when 5 mm. On the other hand, the decreases in natural frequencies of torsional modes are higher when 5 mm. The lower values of natural frequencies of torsional modes are due to the larger deflections when 5 mm (see Fig. 2 for corresponding mode shapes). It is noted that the connection of a sensor to the structure provides more rigidity when the sensor is at the nodal line; hence the natural frequencies of torsional modes are higher when 0. On the other hand, the increases in natural frequencies decrease or the mass loading effect of a sensor become dominant when the sensor is placed to one side of the nodal line.
Fig. 4The errors in natural frequencies (ωr) of the beam-like structure (under free-free BCs) carrying a sensor for various types of modes as a function of sensor position (z/L) where y= 0
a)
b)
c)
d)
3. Experimental study
Here, a controlled experimental study is designed for measuring structural frequency response function given by [11]:
where and are the Fourier Transforms of the time domain excitation force applied at the point and the vibration velocity (response) measured at point , respectively, is time and superscript indicates the complex conjugate. Both half-power and circle-fit methods are employed to identify modal loss factors by using measured structural frequency response functions. In the half-power method [2], the loss factor () for mode is determined by:
where () are the frequencies corresponding to half power points around . In the circle-fit method [12], the modal loss factor is determined by:
where two frequencies () correspond to the angles () around when the function is plotted using the Nyquist diagram [2]. Both the excitation and response sensors are (magnetic) non-contact; there is no (or minimal) sensor effects in the controlled experiment. First, the actual modal parameters of the structure are identified using the functions measured via employing non-contact sensors described above. Then, an additional mass is attached to the structure to simulate the contact type sensor in the previous section, and the functions are measured on the modified structure again using the non-contact sensors. The additional sensor is joined to the structure using a commercial (widely used) glue (wax) to simulate the practical measurements. The schematic of the experimental set-up is shown in Fig. 5. The functions are measured for various sensor positions ( values). It is noted that one end of the structure is clamped in this experiment. The bending modes of a structure can be excited by using the non-contact excitation system in this test set-up; hence only the bending modes are measured here. Also, the modal parameters of the test sample with and without an additional sensors (or additional mass) are determined using the theoretical model presented before and theoretical results are compared with experimental ones.
Fig. 5Schematic of the experiment; measurements include structural velocity (v) and the excitation force (f)
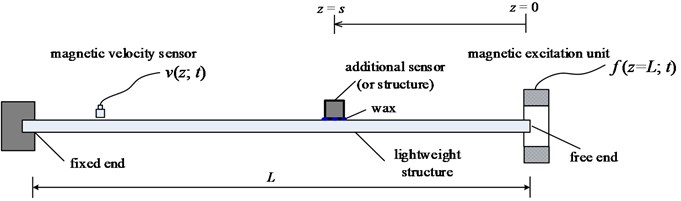
A very lightweight steel structure is intentionally studied here; the length, width and thickness of the structure are 200, 10 and 1 mm, respectively. The side length of the cubic shape sensor is 10 mm. The Young’s modulus, loss factor and density of the material of the structure are 202 MPa, 0.0025 and 7850 kg/m3, respectively. The corresponding values for the additional sensor are 200 MPa, 0.0025 and 4800 kg/m3, respectively. The Poisson’s ratio is assumed to be 0.3. Overall, the mass of the additional contacting sensor is 4.8 g while the mass of the beam-like structure is 15.7 g where 3.27 (very lightweight structure).
The theoretical and experimental modal parameters of the structure without an additional sensor are listed in Table 3. It is worth stating that the first mode can not be measured with reliable accuracy using the designed experiment; hence the results for the first mode are excluded here. It is seen that theoretical and experimental natural frequencies are almost the same; the differences between theoretical and experimental results are less than 0.1 %. Both the half-power and circle-fit methods estimate almost the same damping levels; the average loss factors for the identified modes are when the half-power method is used and when the circle-fit method is used.
Table 3The modal parameters of the beam-like structure (under free-fixed BCs) without an additional sensor
Bending Mode No., | (,) | Theoretical | Experimental | (%) | |||
(Hz) | (Hz) | Half Power | Circle Fit | Average | |||
2 | (2,1) | 128.8 | 128.8 | 0.0040 | 0.0042 | 0.0041 | 0.02 |
3 | (3,1) | 360.6 | 360.3 | 0.0033 | 0.0030 | 0.0031 | 0.11 |
4 | (4,1) | 707.0 | 706.8 | 0.0018 | 0.0018 | 0.0018 | 0.04 |
5 | (5,1) | 1169.4 | 1170.5 | 0.0015 | 0.0017 | 0.0016 | –0.09 |
Absolute average value | 0.0026 | 0.0027 | 0.0027 | 0.07 | |||
Table 4The modal parameters of the beam-like structure (under free-fixed BCs) with an additional sensor for various sensor positions (z/L values)
0.05 ( 10 mm) | ||||||
Theoretical | Experimental | |||||
(Hz) | (Hz) | – Half Power | – Circle Fit | – Average | (%) | |
2 | 109.9 | 110.05 | 0.0054 | 0.0049 | 0.0051 | –0.11 |
3 | 326.1 | 325.75 | 0.0020 | 0.0021 | 0.0020 | 0.11 |
4 | 646.1 | 643.75 | 0.0023 | 0.0025 | 0.0024 | 0.37 |
5 | 1051.3 | 1045.5 | 0.0049 | 0.0050 | 0.0049 | 0.55 |
Average Value | 0.0036 | 0.0036 | 0.0036 | 0.29 | ||
0.300 ( 60 mm) | ||||||
Theoretical | Experimental | |||||
(Hz) | (Hz) | – Half Power | – Circle Fit | – Average | (%) | |
2 | 122.5 | 123.5 | 0.0065 | 0.0064 | 0.0064 | –0.86 |
3 | 311.6 | 319.8 | 0.0080 | 0.0074 | 0.0077 | –2.56 |
4 | 663.9 | 665.6 | 0.0046 | 0.0049 | 0.0047 | –0.25 |
5 | 1084.5 | 1069 | 0.0040 | 0.0036 | 0.0038 | 1.48 |
Average Value | 0.0058 | 0.0056 | 0.0057 | 1.29 | ||
0.550 ( 110 mm) | ||||||
Theoretical | Experimental | |||||
(Hz) | (Hz) | – Half Power | – Circle Fit | – Average | (%) | |
2 | 102.6 | 105.75 | 0.0075 | 0.0074 | 0.0074 | –3.01 |
3 | 344.1 | 345.15 | 0.0026 | 0.0023 | 0.0025 | –0.30 |
4 | 629.0 | 641 | 0.0043 | 0.0041 | 0.0042 | –1.88 |
5 | 1071.7 | 1074.6 | 0.0033 | 0.0032 | 0.0033 | –0.27 |
Average Value | 0.0044 | 0.0042 | 0.0043 | 1.36 | ||
0.800 (160 mm) | ||||||
Theoretical | Experimental | |||||
(Hz) | (Hz) | – Half Power | – Circle Fit | – Average | (%) | |
2 | 121.4 | 120.3 | 0.0051 | 0.0049 | 0.0050 | 0.93 |
3 | 298.2 | 300 | 0.0056 | 0.0056 | 0.0056 | –0.57 |
4 | 593.5 | 603.5 | 0.0050 | 0.0053 | 0.0051 | –1.65 |
5 | 1046.7 | 1044 | 0.0046 | 0.0045 | 0.0046 | 0.21 |
Average Value | 0.0051 | 0.0051 | 0.0051 | 0.84 | ||
The measured and predicted modal parameters of the structure with an additional sensor for various sensor positions ( values) are listed in Table 4. It is seen that the theoretical natural frequencies are close the experimental results for the lightweight structure carrying a sensor. The average absolute differences between theoretical and experimental natural frequencies () are 0.29, 1.29, 1.36 and 0.84 % when 10, 60, 110 and 160 mm, respectively. The half-power and circle-fit methods estimate almost the same damping levels for each mode and values. The natural frequencies strongly depend on sensor position () as expected. The measured modal loss factors exhibit a small variation with respect to sensor position (). The damping effect of the sensor seems to be apparent when the sensor is placed to a position where the modal strain energy of the structure is high for the individual mode. For example, the effect of the sensor on the damping of the 2nd and 3rd modes is highest when the sensor is at 110 mm for the 2nd mode and 60 mm for the 3rd mode. It is noted that 110 mm and 60 mm are the positions where the modal strain energies of the 2nd and 3rd modes, respectively, are relatively high. On the other hand, the modal loss factors of the 2nd to 4th modes are very close to the actual results (the modal loss factors of the structure without a sensor) when 10 mm; note that the modal strain energies of these modes are relatively low for 10 mm. It is seen that the frequency response data measured when the sensor is at the free end of a beam give the most reliable modal loss factors when a few modes of a structure are to be identified (the most common case in practice). The average loss factor is about for 10 mm, for 60 mm, for 110 mm and for 160 mm; note that for the structure without a sensor.
4. Discussion of experimental and theoretical results
In most cases in practice, the modal parameters of structures need to be determined without needing the correction of raw data (measured frequency response functions) as it requires additional capabilities. Also, the correction methods in the literature are based on some assumptions, i.e., only mass loading effect of a sensor is taken into account [2, 8]. Therefore, there is a need for a low-cost as well as practical way to directly identify the modal parameters of structures with minimal sensor effects. The results in the previous sections showed that the damping effect of a sensor rigidly connected to a structure is negligible; the additional average damping effect of the sensor (or the connection of the sensor to the structure) is less than 0.3 % for an extreme test case, i.e., the structure is quite lightweight and 3.3 although the negligible damping effect changes with respect to sensor position ().
Opposite to the negligible adverse effects of a sensor on modal loss factors, the results presented in the previous sections showed that the natural frequencies of a lightweight structure vary with sensor position ( or values). For bending modes, stiffness affects are very small and both mass and stiffness effects may be dominant for torsional modes as expected. On the other hand, the results showed that the error values in the identified natural frequencies can be quite small as well as the sensor is placed the appropriate position ( value). For example, the natural frequencies of the first mode of the structure is determined to be 121.1 Hz when the sensor is at 70 mm (or 0.233). It is noted that the correct value of the natural frequency of the first mode is 121.2 Hz and the error value is only 0.1 % in this case. Similarly, the natural frequency of the second mode is 333.6 Hz when the sensor at 100 mm (or 0.333) while the actual value for this mode is 334.1 Hz; the error value is still 0.1 % in this case. Overall, it is seen that the first four modes of the structure can be determined with an error less than 0.5 %. This suggests that sensors are best placed were mass effects are small, in order to minimize the error in natural frequency of a given mode. Such positions, however, correspond to the nodes of the mode considered, so the sensors will pick up little of the contribution of the corresponding mode to the beam vibration and it is doubtful whether this will lead to good identification results. Therefore, in practice, as the vibration amplitude the sensor experienced is extreme weak and the SNR (Signal to Noise Ratio) is very low when the sensor is placed at or near the nodal point of one bending mode, it is difficult to obtain high quality FRFs and high precision modal parameters, especially modal loss factors.
5. Identification of modal parameters with minimal sensor effects
Overall, the results in the previous sections suggest that the loss factors of the lightweight structures can be identified using the vibration frequency response functions measured on the structure carrying a sensor (an accelerometer). The natural frequencies, on the other hand, can be identified in a different way. Here, it is suggested that acoustic frequency response functions should be measured using a microphone and natural frequencies can be identified using these functions. As there is no mass, stiffness and damping effects of a microphone, the measured natural frequencies will contain zero (or minimal) errors due to sensor adverse effects. It is noted that the identification of damping levels using acoustic frequency response functions may not always be convenient as it is not possible to measure the amplitudes of acoustic responses with reliable accuracy in the laboratory although the accuracy of the amplitude information is not important for identification of natural frequencies. Overall, damping levels are identified on structural frequency response functions. This methodology can be used to identify modal parameters of any kind structure. The performance of this method is demonstrated using an experimental test case below.
Fig. 6Schematic of the experiment; measurements include sound pressure (p), structural acceleration (a) and the excitation force (f)
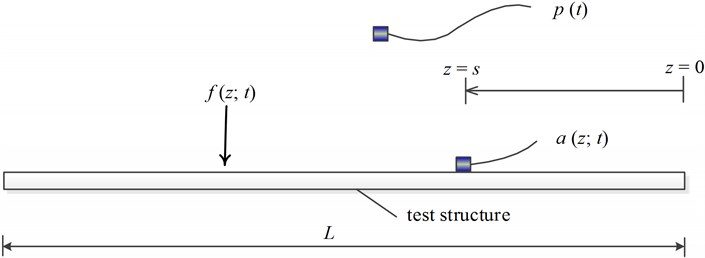
Table 5The natural frequencies and loss factors of a test (glass composite) sample and errors in the modal parameters identified using a few structural frequency response functions Hij for various i and j points
Using | 25 mm, 65 mm | 65 mm, 65 mm | 105 mm, 225 mm | |||||||||
Mode No., | (Hz) | (%) | (%) | (Hz) | (%) | (%) | (Hz) | (%) | r | (%) | ||
1 | 287.5 | –5.7 | 0.0076 | –0.04 | 303.3 | –0.6 | 0.0072 | –0.08 | 291.0 | –4.6 | * | * |
2 | 791.5 | –3.0 | 0.0080 | 0.00 | 777.0 | –4.8 | 0.0071 | –0.10 | 789.0 | –3.3 | 0.0066 | –0.14 |
3 | 1535.1 | –3.1 | * | * | 1493.5 | –5.8 | 0.0106 | 0.04 | 1534.5 | –3.2 | 0.0090 | –0.12 |
Average value | 0.0078 | 0.02 | 0.0083 | 0.07 | 0.0078 | 0.13 | ||||||
*could not be identified using the individual frequency response function | ||||||||||||
The schematic of the test set-up studied here is shown in Fig. 6. The B&K 3560D analyzer, the B&K 4507B accelerometer, the Endevco 2302-10 modal hammer and the B&K 4189-A-21 microphone are used in the measurements. A sample (made of glass composite material) with length, width and thickness 250, 25.4 and 5 mm is used. The mass of the accelerometer is 4.8 g while the mass of the structure is 60.5 g; 12.6. First, a microphone is placed about 10 cm away from the test sample and an acoustic frequency response function where the first three modes of the sample are well-excited is measured by exciting the structure using a modal hammer. The natural frequencies and loss factors of the first 3 modes of the test sample are determined using the acoustic frequency response function and the half-power method first. The natural frequencies are 305.0, 815.9 and 1584.8 Hz and the loss factors are 0.0080, 0.0080 and 0.0102. These are the correct modal parameters of the structure as there is no adverse effect of a non-contact sensor. Next, an accelerometer is attached to the test sample and a few structural frequency response functions for three sensor positions ( or values) are measured by exciting the structure using a modal hammer. The natural frequencies () and loss factors () of the test sample and the errors in the modal parameters using the vibration frequency response functions for various and points (or values) and the half-power method are given in Table 5. It is again seen that the accelerometer has negligible effect on the damping of the structure while the effect varies with sensor position () for each mode. The average loss factor is for (or ) 25 mm, for 65 mm and for 105 mm. Overall, the effect of a sensor on the damping of the test sample is less than 0.15 % while the natural frequencies are identified with zero error using an acoustic frequency response function. The demonstrations were conducted for some other practical structures and similar results were obtained although the results are not presented here for brevity.
The approach (needing only an accelerometer and a microphone) verified above can effectively be used in practice. For example, the approach can be used to identify natural frequencies and modal loss factors of the test samples in Oberst beam method instead of using the more complicated Oberst test rig defined in ASTM E 756 standard [3] where both excitation and response sensors are non-contact. It is noted that the errors in the identified modal parameters can be quite high although the non-contact response and excitation sensors are used in the Oberst beam method [5]. Here there is a need to ensure mode sequences. Note that the mode shapes are known in most cases. For example, only the bending modes are excited in the Oberst beam method [3] and they are defined.
6. Conclusions
This paper investigates the adverse effects of sensors on modal parameters of lightweight structures and present a practical way for identification of modal parameters of structures with minimal sensor effects. Specific contributions of this paper include the following. The adverse effects of a contact type sensor on natural frequencies, damping levels and mode shapes are investigated using the theoretical model of a typical (beam-like) test sample carrying a sensor; the errors in the modal parameters are quantified as a function of sensor position. The damping of the beam material is included in the theoretical model while the sensor is modelled using a solid element. A controlled experiment based on measurements of structural frequency response functions using non-contact excitation and response sensors is designed to study adverse effects of sensors experimentally. A practical as well as simple way based on measurements of structural and acoustic type frequency response functions is suggested to identify the correct modal parameters of typical lightweight structures in an effective way. The results show that a contact type sensor (and the connection of a sensor to the structure) provides mass loading and additional stiffness effects while the additional damping effect is negligible.
Results show that the modal loss factors of a structure do not change as long as the sensor is rigidly connected to the structure. However, the modal loss factors exhibit a small variation with respect to sensor position in practical measurements. The damping effect of the sensor seems to be apparent when the sensor is placed to a position where the strain energy of the structure is high for the individual mode. The modal loss factor for each mode can be determined by averaging the loss factors determined using various spectrums; the spectrums measured at the points where the modal strain energies are low can give more reliable results. The natural frequencies of a structure can also be identified with high accuracy by using acoustic frequency response functions while the modal loss factors can be determined by using structural frequency response functions. The results given in this paper can be used in many engineering fields to minimize the adverse effects of sensors and to identify modal parameters of structures with minimal sensor effect in an effective way.
References
-
Nashif A. D., Jones D. I. G., Henderson J. P. Vibration Damping. John Wiley, New York, 1993.
-
Ewins D. J. Modal Testing: Theory, Practice and Application. Second edition, Research Studies Press, England, 2000.
-
ASTM E 756-05. Standard test method for measuring vibration-damping properties of materials. American Society for Testing and Materials, 2005.
-
Wojtowicki J. L., Jaouen L., Panneton R. New approach for the measurement of damping properties of materials using the Oberst beam. Review of Scientific Instruments, Vol. 75, Issue 8, 2004, p. 2569-2574.
-
Koruk H., Sanliturk K. Y. Identification and removal of adverse effects of non-contact electromagnetic excitation in Oberst Beam Test Method. Mechanical Systems and Signal Processing, Vol. 30, 2012, p. 274-295.
-
Warren C., Niezrecki C., Avitabile P., Pingle P. Comparison of FRF measurements and mode shapes determined using optically image based, laser, and accelerometer measurements. Mechanical Systems and Signal Processing, Vol. 25, 2011, p. 2191-2202.
-
Ashory M. R. Correction of mass-loading effects of transducers and suspension effects in modal testing. Proceedings of the 16th International Modal Analysis Conference, USA, 1998, p. 815-828.
-
Cakar O., Sanliturk K. Y. Elimination of transducer mass loading effects from frequency response functions. Mechanical Systems and Signal Processing, Vol. 19, Issue 1, 2005, p. 87-104.
-
Sanliturk K. Y., Koruk H. Development and validation of a composite finite element with damping capability. Composite Structures, Vol. 97, 2013, p. 136-146.
-
FINES, Finite Element for Structures. Istanbul Technical University, Turkey, 2006.
-
Bendat J. S., Piersol A. G. Random Data Analysis and Measurement Procedures. 4th Edition, John Wiley, 2010.
-
Kennedy C. C., Pancu C. D. P. Use of vectors in vibration measurement and analysis. Journal of the Aeronautical Sciences, Vol. 14, Issue 11, 1947, p. 603-625.
About this article

