Abstract
Modern vehicles are equipped with highly developed electronic computer systems allowing diagnostics of control system elements, but – notwithstanding – deprived of the diagnostic function of purely mechanical defects. The reason of this situation is less and less number of breakdown vehicles. However, mechanical defects still occur, which is confirmed by the information from car repair workshops, and their too late finding increases repair costs. From the economic point of view, supplementing computer systems with diagnostics functions seems justified. The existence of such gap was the reason for undertaking several active experiments, aimed at explaining whether there is a possibility of improving the existing systems by an additional diagnostics function. The results of the possibility of applying quantitative estimation measures of the selected vehicle state are presented in the paper. Directions of further investigations and stages of diagnostic experiments, which would confirm the effectiveness of the proposed measures are provided in the hereby paper. This paper also constitutes the attempt of answering the question whether the similar algorithm application is possible in vehicles of the newest generation, equipped with adaptive systems of on board diagnostics.
1. Introduction
The automotive sector is developing dynamically in the current years, not only in the performance, design or comfort improvements but also in the field of diagnostics. The present systems of the on board diagnostics (OBD) are highly developed, meeting ‘exorbitant’ emission standards and including successive mechanical systems of vehicles. However, they are still directed mainly towards the environment protection and not to assessing mechanical systems of the driving unit. As the result, control systems which are adjusting the engine operation to the required low emission levels of harmful substances, by proper controlling the work cycle parameters, are masking early phases of mechanical defects [1, 2].
Certain defects which are not revealed by the electronic computer system are progressing, which leads not only to these defects’ increase, but also has an adverse influence on the remaining subassemblies. Such situation leads to increased repair costs, since the detection of advanced faults causes either the acceleration of operational wear and tear condition of cooperating elements and the necessity of their repairs.
Thus, in such situation, supplementing control systems by additional symptoms of mechanical defects – omitted, up to now, in the on board diagnostics – seems reasonable and economically justified. Thus the question arises, where to look for the symptom meeting the basic diagnostic conditions of the ‘on-line’ type? The authors [1] indicate the possibility of using the vibration signal in the diagnostics process of defective elements of driving units. The rightness of this thesis is confirmed by the results given in paper [3]. Diagnostics of vehicle powertrains using vibroacoustic signals and attempt to modelling of the real damages are the problems which has been investigated in many research centers around the world. It is impossible to mention all of them and to present all the methods used. Interesting positions of literature demonstrating the utility of vibration signal for the diagnosis of internal combustion engines with a comprehensive review of the methods used are the works [4, 5]. From the point of view of proper operation of the combustion engine, it is very important to monitor the status of valves and proper cooperation between the piston and the cylinder. In the process of diagnosing malfunction of internal combustion engines are often used various methods of averaging the measured signal. And so in [6], the author uses a synchronous averaging of vibration signal of the engine to the exhaust valve leakage diagnosis method, wavelet power spectrum averaging for detecting looseness in the piston-cylinder system was shown in [7] and in work [8] where to assess of the valve clearance or the valve leakage the measures obtained by PSFA (Partial Sampling and Feature Averaging) were used. In the process of diagnosing internal combustion engines defects use of “genetic programming” [9] is useful. In [10] was presented the procedure for estimating the clearances of valves of combustion engines which uses time-spectral selection. A good carrier of information about the state of the drive unit is not only the vibration signal but an overall vibroacoustic signal, which is also the acoustic signal [11]. In the works [12, 13] authors show the correctness of diagnostic measures obtained in the cold test. The signal recorded on the cylinder head is the result of signals coming from a number of elements or assemblies therefore important in the development of engine diagnostic systems is also knowledge about work processes occurring between cooperating mechanical assemblies, even such as signals generated by the bearings and gearbox [14-18]. Assessment of the internal combustion engine is also possible on the basis of an analysis of changes of the crankshaft speed [19-21]. It is difficult to present all the methods used to record and analyze signals used to assess the state of the internal combustion engine, but in most cases, the proposed measures are quality measures or measures requiring advanced computational techniques to obtain, which can result in symptoms difficult to use in real-time diagnostics. The proposal of the quantitative measure of assessing the state, meeting conditions of the proper diagnostic symptom, possible for the implementation in the existing computer systems (at the similar base as in paper [22]), is presented in the hereby paper.
2. Object of investigations and experiments
The object of investigation was the spark ignition engine, at an advanced wear and of an unknown ‘initial’ condition. The mechanical defect, in a form of a cut of the exhaust valve face, was introduced into the engine to simulate a burned out valve. As it results from the previous experiments such defect is not signalled by the OBD system by lighting the MIL lamp as well as it is not saved in the control memory, regardless of the fact that such defect – in accordance of general guidelines of on board diagnostics systems – should be revealed.
Fig. 1Subsequent phases of the mechanical defect of the valve
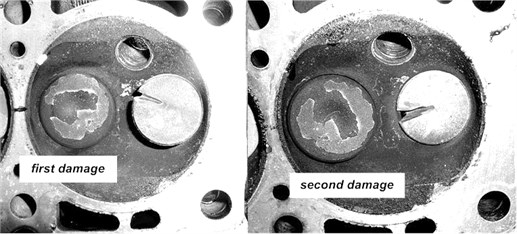
The experiment assumption was to reveal the defect at its initial stage. Finding the vibroacoustic response of the driving unit to the defect occurrence and increasing – was necessary. This would confirm that the symptom and its comparison with the ‘reference’ state can allow to reveal explicitly the defect early stage. To aim this, the mechanical defect was increased and the system responses were recorded at each stage of changing the unit state. The acceleration amplitude of vibrations of the head, near the exhaust valve of the first cylinder, was the recorded signal. Measurements were performed under road conditions at – as constant as possible – driving conditions, to be able to apply the measure during the real operation, thus making the diagnostics process independent of specialist stands [23-26].
The way of the defect implementation is presented in Fig. 1.
3. Analyses of results
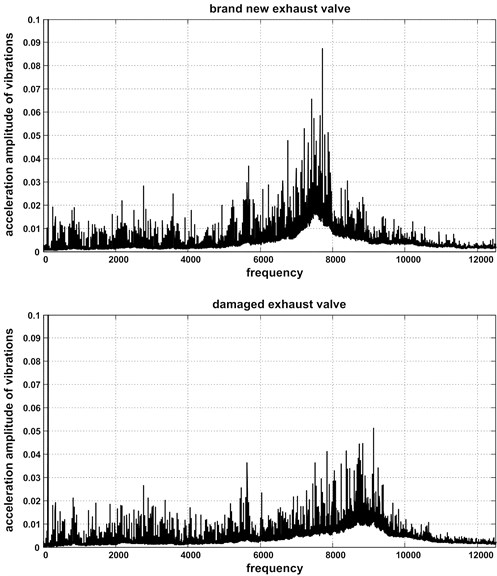
In case of brand-new vehicles, when their ‘initial’ condition is known, diagnostics possibilities seem very simple and explicit. Before starting the main investigations the simple experiment was performed on the new, not used, unit. The amplitudes of accelerations of head vibrations for two states: good/out of order, were recorded. The results of the analysis of the frequency structure of the vibration signals generated by the brand new car engine in the efficient state and after introducing the exhaust valve defect are presented in Fig. 2. The preliminary analysis allows already for the explicit distinction of the state: good/out of order. The introduced mechanical defect of one subassembly of the driving system (exhaust valve defect) clearly changes the spectrum of the amplitude of head vibrations accelerations.
Fig. 2Qualitative measure of the exhaust valve defect
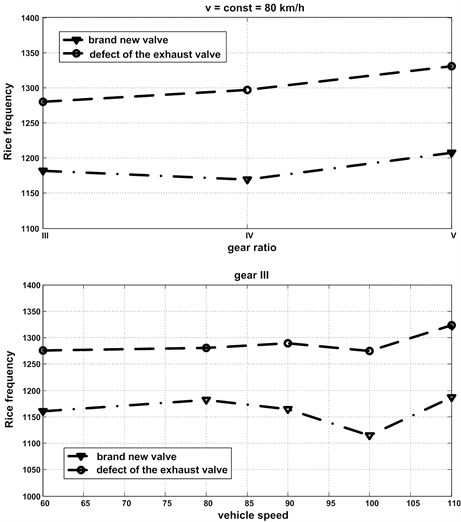
In this case, it was also possible to suggest an unambiguous and monotonic defect symptom in a form of the Rice’s frequency (Fig. 3) – for accelerations defined as the average frequency of the process described by formula:
where – power spectrum, – frequency.
The detailed description of the experiment and the obtained results can be found in paper [27].
From the point of view of the measure usefulness in the diagnostics process it is important, that the out of order symptom could be used at each stage of the vehicle operation and kept pace with subassemblies wearing of. In order to establish the measure, which would meet such conditions, the experiment was performed on the vehicle in an advanced operational state with the driving unit of an ‘unknown’ efficiency state. Vibration signals were recorded in four stages:
– unknown ‘initial’ condition,
– when the exhaust valve defect was introduced,
– when the exhaust valve defect was increased,
– after exchanging the damage valve for the brand new one.
The spectra of the recorded accelerations of vibrations are presented in Fig. 4.
Fig. 3Quantitative measure of the exhaust valve defect
As can be seen in Fig. 4, an explicit and simple distinguishing the vehicle state is not possible in case of vehicles being in use for some time, though changes in frequency structures, are still seen. Since the exhaust valve state – prior to introduced defects – was unknown, after equalization of rotation speed [28], the information related strictly to these defects were selected and separated from the information originated from the ‘good’ state, before looking for the quantitative measure. The spectrum of the brand new valve was treated as the reference base. Defect measures meeting the requirements of the proper diagnostic symptom were looked for – within signals prepared in such way. At the end, the measure in a form of the root mean square of the differential spectrum was proposed, calculated according to the formula:
where: , – spectrum of vibration acceleration – engine with simulated damage of exhaust valve, – spectrum of vibration acceleration – engine with brand new exhaust valve.
Examples of the results are presented in Fig. 5.
Fig. 4Spectra of accelerations of the head vibrations at various engine conditions: a) Brand new valve, b) First (I) defect of the exhaust valve, c) Second (II) defect of the exhaust valve, d) ‘Unknown operational’ condition
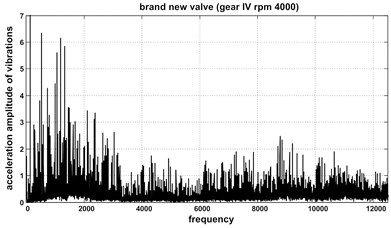
a)
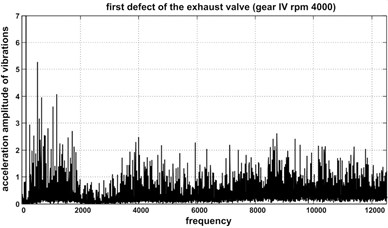
b)
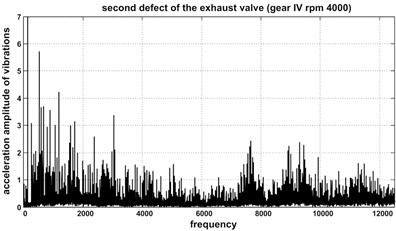
c)
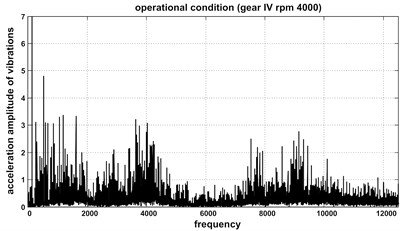
d)
Fig. 5Root mean square of the differential spectrum as the defect function: 1 – First (I) defect of the exhaust valve, 2 – Second (II) defect of the exhaust valve, 3 – ‘Unknown operational’ condition
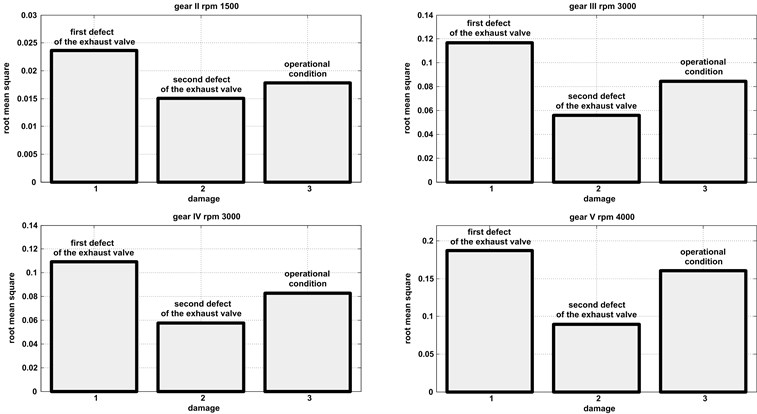
The root mean square of the differential spectrum seems to be the proper symptom of the mechanical defect. It allows to discriminate explicitly individual engine states with the introduced defects. This measure is monotonic versus the defect development function, which enables revealing the defect in its early stage. The root mean square for the ‘initial’ operational state is located in between the first and the second defect, which indicates its significant wear, tantamount to the early stage of simulated defects. The valve visual inspection as well as the fact of a very long mileage, without previous repairs of the driving unit, confirms – with a high probability – the correctness of the obtained results.
The behaviour of the proposed measure at changes of the rotational speed and gear ratios was also checked (Fig. 6). This measure is not sensitive to changes of driving conditions and retains the constant tendency of changes.
Fig. 6Root mean square value change as a function of: a) Rotational speed, b) Gear ratio
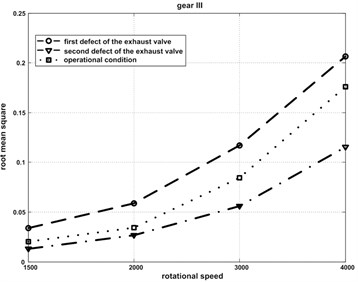
a)
b)
Such algorithm of looking for the inefficiency symptom not only allows to discriminate explicitly states: good/out of order, but also the actualization of the ‘basic’ state after each repair or intervention in a driving unit and – at an appropriate approximation – establishing the constant decision thresholds.
However, the presented situation is slightly idealized. In reality, especially taking into account the adapting ability of control systems, when elements or systems cooperating become faulty then simultaneously occurring defects can question the proposed measure correctness. To check this correctness an additional defect was introduced into the system. The valve clearance was increased to 0.8 mm. The analysis was performed in the analogous manner as in case of a single defect. Examples of root mean square value of the differential spectrum are presented in Fig. 7, and their comparison with the single defect in Fig. 8.
Fig. 7Root mean square value of the differential spectrum for defects occurring in parallel: 1 – First (I) defect of the exhaust valve with the increased valve clearance, 2 – Second (II) defect of the exhaust valve with the increased valve clearance, 3 – Increased valve clearance of the valve in the ‘unknown operational’ condition
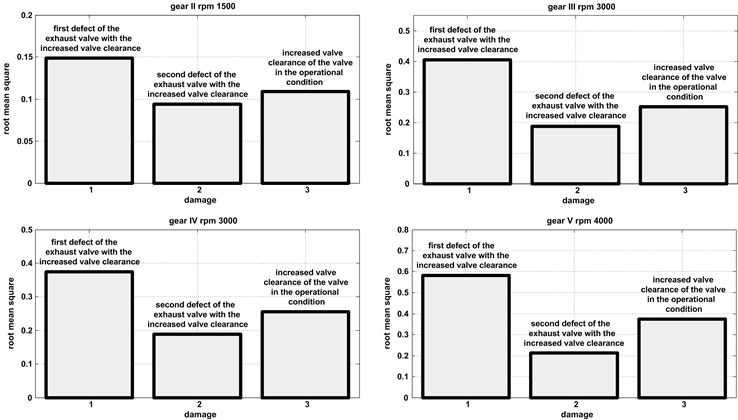
Fig. 8Influence of the defects occurring in parallel – on the proposed measure: Valve clearance 0.45: 1 – First (I) valve defect, 2 – Second (II) valve defect, 3 – ‘Operational’ condition, Valve clearance 0.80: 4 – First (I) valve defect, 5 – Second (II) valve defect, 6 – ‘Operational’ condition
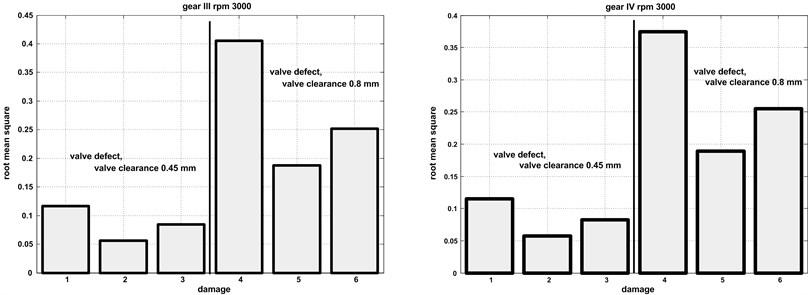
In the case of an additional defect occurrence in a form of the increased valve clearance the relation between defected states is the same as in the case of a single malfunction of the exhaust valve. The question whether another defect occurring in parallel will not disturb the estimation of the exhaust valve state remains still to be answered, since this is crucial in eliminating any doubts of the proposed measure correctness. All states of the driving unit, it means the state: when the valve was with the single defect, when the clearance was changed and when both defects were present together, are combined in Fig. 8.
As can be seen in the presented diagrams, the valve clearance change significantly increases the root mean square of the differential spectrum and is dominating in signals with additionally introduced valve defects. The defect occurring in parallel does not disturb the correctness of the estimation of the exhaust valve state, but also allows the diagnostics when the valve clearance is increased. Such symptom is not sensitive to a general increase of clearances.
The influence of the rotational speed change and gear ratio on the differential spectrum root mean square was also checked in this case, in order to eliminate the influence of the parallel defect on the proposed diagnostic symptom of the exhaust valve in a wider range of the unit operation (Fig. 9).
Fig. 9Change of the root mean square of the differential spectrum for parallel defects as a function of: a) Rotational speed, b) Gear ratio
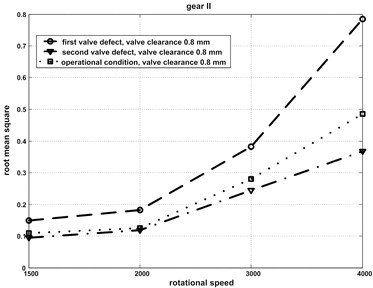
a)
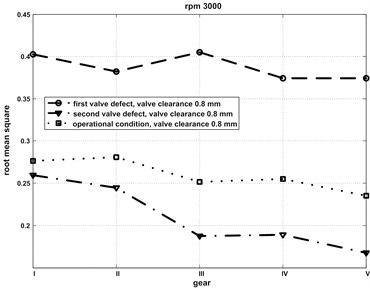
b)
As it results from the diagrams analysis, the root mean square of the differential spectrum is insensitive to changes of driving parameters, which means that an additional malfunction does not explicitly influence the proposed estimation symptom of the valve state.
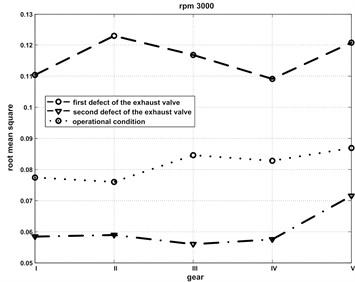
Root mean square value change for all considered defects, together with their simultaneous occurrence, as the gear ratio function for the selected rotational speed of the engine, are presented in Fig. 10.
Fig. 10Root mean square value change for all considered defects as the gear ratio function for the selected rotational speed of the engine
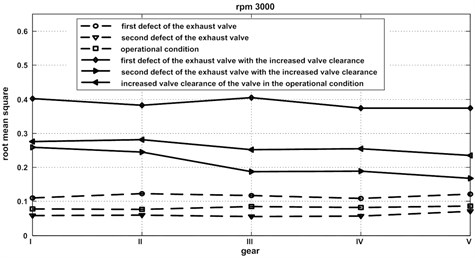
The root mean square of the differential spectrum allows to determine explicitly the damage stage of the exhaust valve for the nominal valve clearance. In addition, a parallel defect in a form of an increased valve clearance does not influence the reliability of the proposed symptom and allows for its revealing – as a single malfunction and in case of a simultaneous occurrence of the exhaust valve defect allows to reveal its early phase. Such pathway of the root mean square enables also to determine explicit diagnostic decision thresholds, possible for implementing in existing OBD and – in case of older generation vehicles – in electronic control systems.
4. Conclusions
The proposed measure in a form of root mean square of the differential spectrum seems to be meeting all conditions required from the proper damage symptom. It explicitly discriminates states: good/not in order allowing to reveal the defect in its early phase. This symptom is insensitive to measurement conditions changes, rotational speeds, gear ratios or damages occurring in parallel. In addition, this measure is the simple one not requiring developed mathematical tools, and the algorithm implementation in existing on board systems and even in simpler control systems in vehicles of the older generation will not be difficult.
References
-
Dąbrowski Z., Madej H. Masking mechanical damages in the modern control systems of combustion engines. Journal of Kones, Vol. 13, Issue 3, 2006, p. 53-60.
-
Dąbrowski Z., Zawisza M. Investigations of the vibroacoustic signals sensitivity to mechanical defects not recognised by the OBD system in diesel engines. Solid State Phenomena, Vol. 180, 2012, p. 194-199.
-
Górnicka D. Examination of vibroacoustics sensitivity of symptoms to mechanical damage in combustion engines. Scientific Papers of the Naval Academy, Vol. 1, Issue 184, 2011, p. 45-50, (in Polish).
-
Antoni J., Daniere J., Guillet F. Effective vibration analysis of IC engines using cyclostationarity. Part I – A methodology for condition monitoring. Journal of Sound and Vibration, Vol. 257, Issue 5, 2002, p. 815-837.
-
Antoni J., Daniere J., Guillet F., Randall R. B. Effective vibration analysis of IC engines using cyclostationarity. Part II – New results on the reconstruction of the cylinder pressures. Journal of Sound and Vibration, Vol. 257, Issue 5, 2002, p. 839-856.
-
Komorska I. Utilising the resonance frequency of the engine vibration sensor in diagnostics of the exhaust valve leakage. Journal of Kones, Vol. 17, Issue 2, 2010, p. 209-216.
-
Wojnar G., Madej H. Averaged wavelet power spectrum as a method for piston – skirt clearance detection. Diagnostics, Vol. 2, Issue 50, 2009, p. 93-98, (in Polish).
-
Shiyuan Liu, Frengshou Gu, Andrew Ball Detection of engine valve faults by vibration signals measured on the cylinder head. The Journal of Automobile Engineering, Vol. 220, 2006, p. 379-386.
-
Wen-Xian Yang Establishment of the mathematical model for diagnosing the engine valve faults by genetic programming. Journal of Sound and Vibration, Vol. 293, 2006, p. 213-226.
-
Barczewski R., Szymański G. Application of the time-frequency selection of the vibration to valve clearance assessment of a diesel engine. Diagnostics, Vol. 30, 2004, p. 18-22, (in Polish).
-
Fathi Elamin, Yibo Fan, Fengshou Gu, Andrew Ball Diesel engine valve clearance detection using acoustic emission. Advances in Mechanical Engineering, 2010.
-
Delvecchio S., Dalpiaz G., Niculita O., Rivola A. Condition monitoring in diesel engines for cold test applications. Part I: Vibration analysis for pass/fail decision. Proceeding of the 20th International Congress & Exhibition on Condition Monitoring and Diagnostic Engineering Management, Faro, Portugal, 2007.
-
Delvecchio S., Dalpiaz G., Niculita O., Rivola A. Condition monitoring in diesel engines for cold test applications. Part II: Comparison of vibration analysis techniques. Proceeding of the 20th International Congress & Exhibition on Condition Monitoring and Diagnostic Engineering Management, Faro, Portugal, 2007.
-
Huaqing Wang, Peng Chen A feature extraction method based on information theory for fault diagnosis of reciprocating machinery. Sensors, Vol. 9, 2009, p. 2415-2436.
-
Dziurdź J. Application of correlation and coherence functions in diagnostics systems. Solid State Phenomena, Vol. 196, 2013, p. 3-12.
-
Stanik Z. The assessment of the effects of the wear and tear of rolling bearing on the dynamic properities in the non-stationary conditions. Machine Dynamics Research, Vol. 37, Issue 3, 2013, p. 77-87.
-
Zhengkai Zhang Lichen Gu, Yongsheng Zhu Intelligent fault diagnosis of rotating machine based on SVMs and EMD method. The Open Automation and Control Systems Journal, Vol. 5, 2013, p. 219-230.
-
Hocine Bendjama, Salah Bouhouche, Mohamed Seghir Boucherit Application of wavelet transform for fault diagnosis in rotating machinery. International Journal of Machine Learning and Computing, Vol. 2, Issue 1, 2012, p. 82-87.
-
Dereszewski M., Charchalis A., Polanowski S. Analysis of diagnostics utility of instantaneous angular speed fluctuation of diesel engine crankshaft. Journal of Kones, Vol. 18, Issue 1, p. 123-128.
-
Geveci M., Osburn A. W., Franchek M. A. An investigation of crankshaft oscillations for cylinder health diagnostics. Mechanical Systems and Signal Processing, Vol. 19, 2005.
-
Charles P., Sinha J. K., Gu F., Lidstone L., Ball A. D. Detecting the crankshaft torsional vibration of diesel engines for combustion related diagnosis. Journal of Sound and Vibration, Vol. 321, 2009.
-
Górnicka D., Komorska I. Adaptation of engine vibration characteristics for diagnostics of mechanical defects. Combustion Engines, Vol. 3, Issue 146, 2011.
-
Górnicka D. Comparison of engine vibration measurements in the road and dyno test. Proceeding of the XXXIX Symposium Diagnostics of Machines, Wisla, 2012, (in Polish).
-
Folęga P., Siwiec G. Numerical analysis of selected materials for flexsplines. Archives of Metallurgy and Materials, Vol. 57, Issue 1, 2012, p. 185-191.
-
Burdzik R., Folęga P., Łazarz B., Stanik Z., Warczek J. Analysis of the impact of surface layer parameters on wear intensity of friction pairs. Archives of Metallurgy and Materials, Vol. 57, Issue 4, 2012, p. 987-993.
-
Burdzik R., Konieczny Ł., Figlus T. Concept of on-board comfort vibration monitoring system for vehicles. Activities of Transport Telematics, Vol. 395, 2013, p. 418-425.
-
Deuszkiewicz P., Górnicka D. Rice frequency as a measure of the valve damage in internal combustion engine. Overview of Mechanical Engineering, Vol. 4, 2009, p. 41-47, (in Polish).
-
Dziurdź J. Transformation of nonstationary signals into “pseudostationary” signals for the needs of vehicle diagnostics. Acta Physica Polonica A, Vol. 118, Issue 1, 2010, p. 49-53.
About this article

